| Param | Original file | Final file |
|---|---|---|
| Filename | modeM0/AS1A04_110T04_9000001886_12768cztM0_level2.evt | modeM0/AS1A04_110T04_9000001886_12768cztM0_level2_quad_clean.evt |
| Size (bytes) | 185,284,800 | 44,804,160 |
| Size | 176.7 MB | 42.7 MB |
| Events in quadrant A | 1,172,100 | 304,996 |
| Events in quadrant B | 1,475,499 | 303,661 |
| Events in quadrant C | 1,128,851 | 300,830 |
| Events in quadrant D | 1,673,430 | 277,979 |
| Mode SS | |||
|---|---|---|---|
| Quadrant | BADHDUFLAG | Total packets | Discarded packets |
| A | 0 | 48 | 0 |
| B | 0 | 48 | 0 |
| C | 0 | 48 | 0 |
| D | 0 | 48 | 0 |
| Mode M0 | |||
|---|---|---|---|
| Quadrant | BADHDUFLAG | Total packets | Discarded packets |
| A | 0 | 4955 | 2 |
| B | 0 | 5884 | 1 |
| C | 0 | 4860 | 1 |
| D | 0 | 6519 | 1 |
| Mode M9 | |||
|---|---|---|---|
| Quadrant | BADHDUFLAG | Total packets | Discarded packets |
| A | 0 | 10 | 0 |
| B | 0 | 10 | 0 |
| C | 0 | 10 | 0 |
| D | 0 | 10 | 0 |
| Quadrant | Total seconds | Saturated seconds | Saturation percentage |
|---|---|---|---|
| A | 2340 | 51 | 2.179487% |
| B | 2340 | 143 | 6.111111% |
| C | 2340 | 32 | 1.367521% |
| D | 2340 | 179 | 7.649573% |
Noise dominated data is calculated using 1-second bins in cleaned event files. If a bin has >2000 counts, and if more than 50% of those come from <1% of pixels, then it is considered to be noise-dominated and hence unusable.
| Quadrant | # 1 sec bins | Bins with >0 counts | Bins with >2000 counts | High rate bins dominated by noise | Noise dominated (total time) | Noise dominated (detector-on time) | Marked lightcurve |
|---|---|---|---|---|---|---|---|
| A | 3416 | 2342 | 0 | 0 | 0.00% | 0.00% | 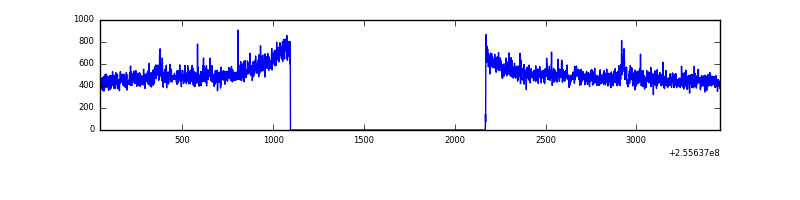 |
| B | 3416 | 2342 | 55 | 55 | 1.61% | 2.35% | 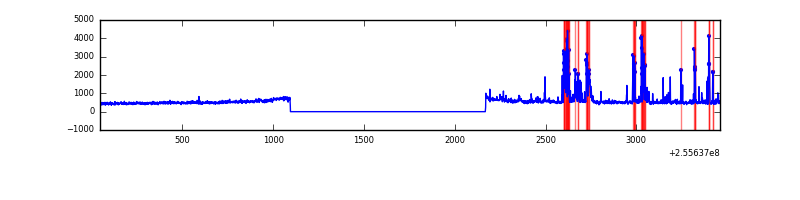 |
| C | 3416 | 2342 | 0 | 0 | 0.00% | 0.00% | 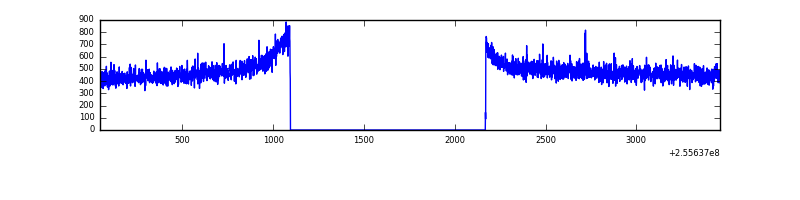 |
| D | 3416 | 2342 | 89 | 89 | 2.61% | 3.80% | 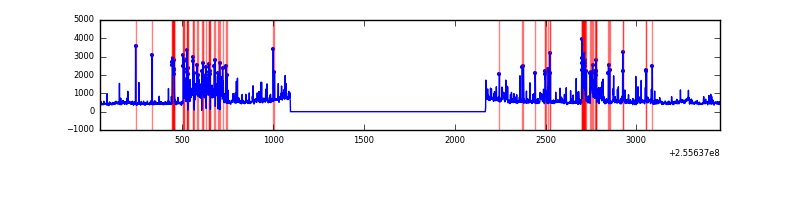 |
Top three noisy pixels from each quadrant. If the there are fewer than three noisy pixels in the level2.evt file, extra rows are filled as -1
| Pixel properties | Quadrant properties | ||||||
|---|---|---|---|---|---|---|---|
| Quadrant | DetID | PixID | Counts | Sigma | Mean | Median | Sigma |
| A | 12 | 189 | 15347 | 239.53 | 298 | 291 | 62.9 |
| A | 8 | 15 | 5776 | 87.26 | 298 | 291 | 62.9 |
| A | 8 | 6 | 3865 | 56.86 | 298 | 291 | 62.9 |
| B | 4 | 239 | 287725 | 4984.63 | 291 | 282 | 57.7 |
| B | 0 | 219 | 13123 | 222.68 | 291 | 282 | 57.7 |
| B | 0 | 85 | 12500 | 211.88 | 291 | 282 | 57.7 |
| C | 13 | 61 | 2136 | 27.5 | 288 | 288 | 67.2 |
| C | 0 | 207 | 1692 | 20.89 | 288 | 288 | 67.2 |
| C | 8 | 222 | 1337 | 15.61 | 288 | 288 | 67.2 |
| D | 1 | 52 | 470852 | 6780.38 | 280 | 271 | 69.4 |
| D | 8 | 195 | 85960 | 1234.65 | 280 | 271 | 69.4 |
| D | 2 | 136 | 39880 | 570.71 | 280 | 271 | 69.4 |
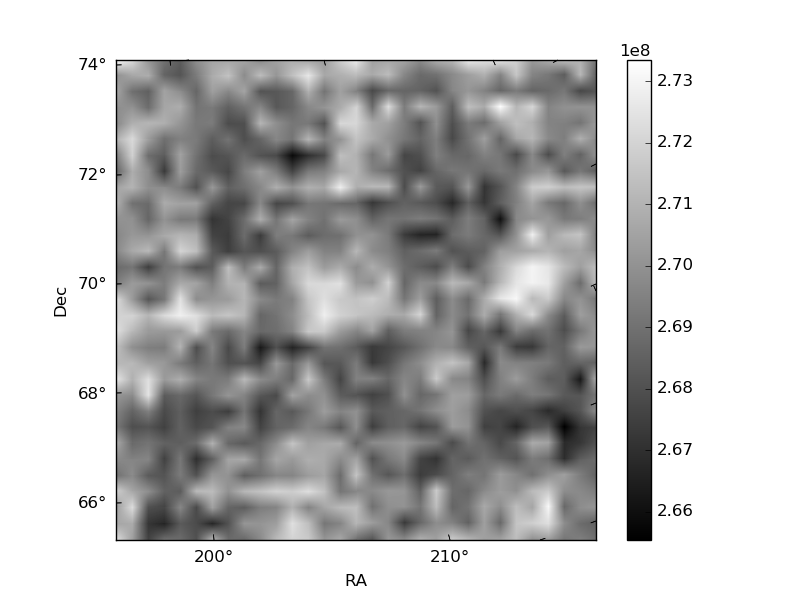
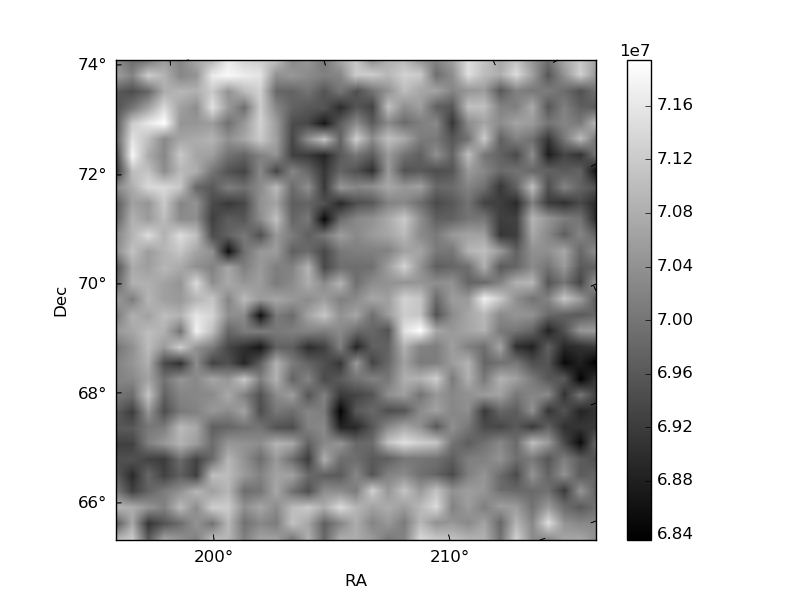
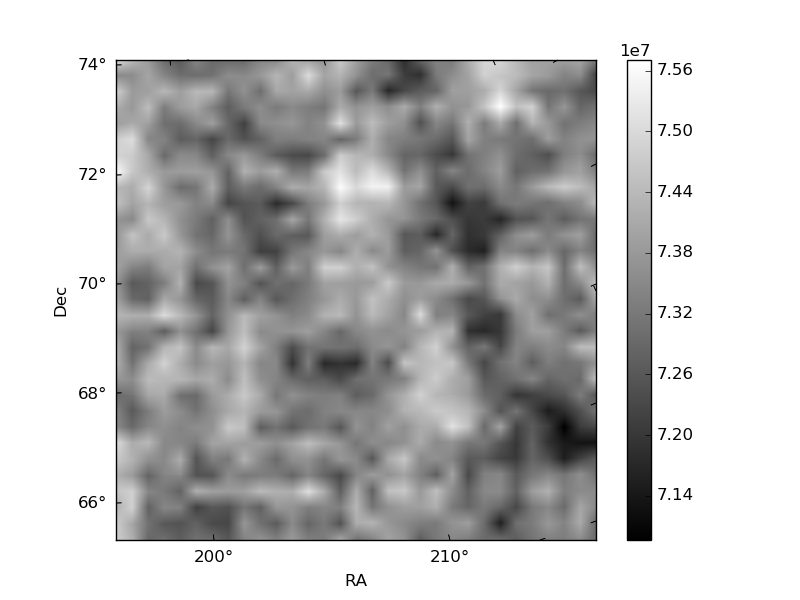
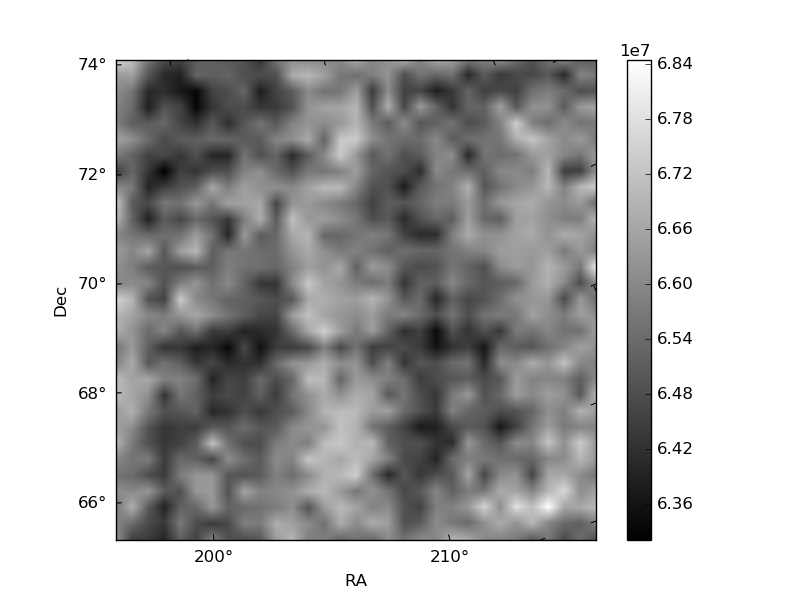
Histogram calculated using DETX and DETY for each event in the final _common_clean file
| Quadrant A | 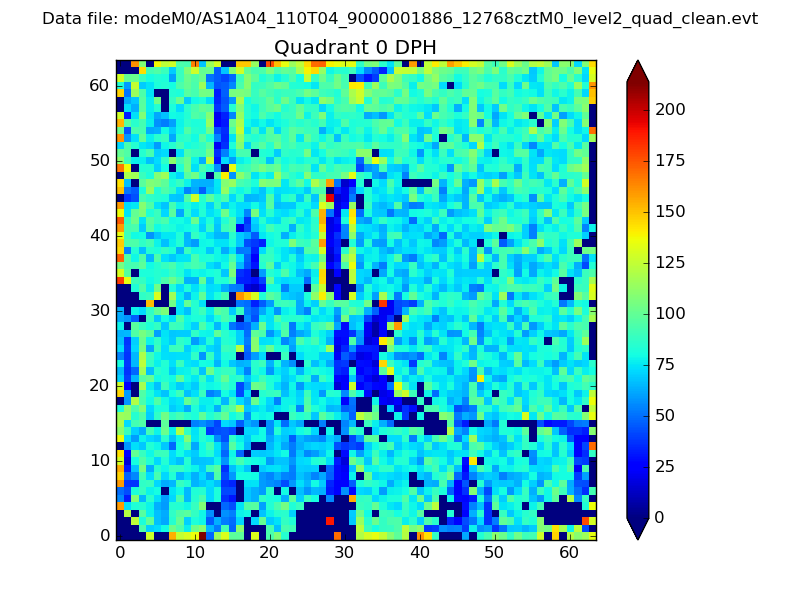 |
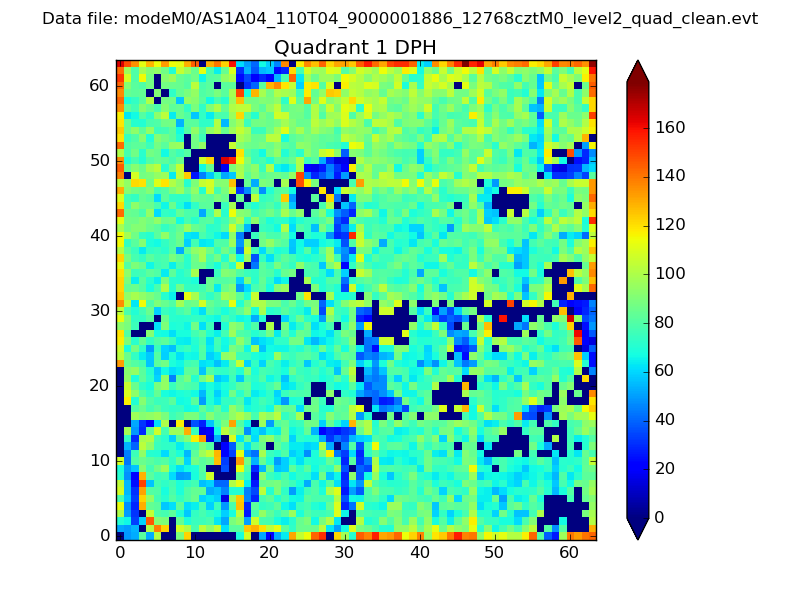 |
Quadrant B |
|---|---|---|---|
| Quadrant D | 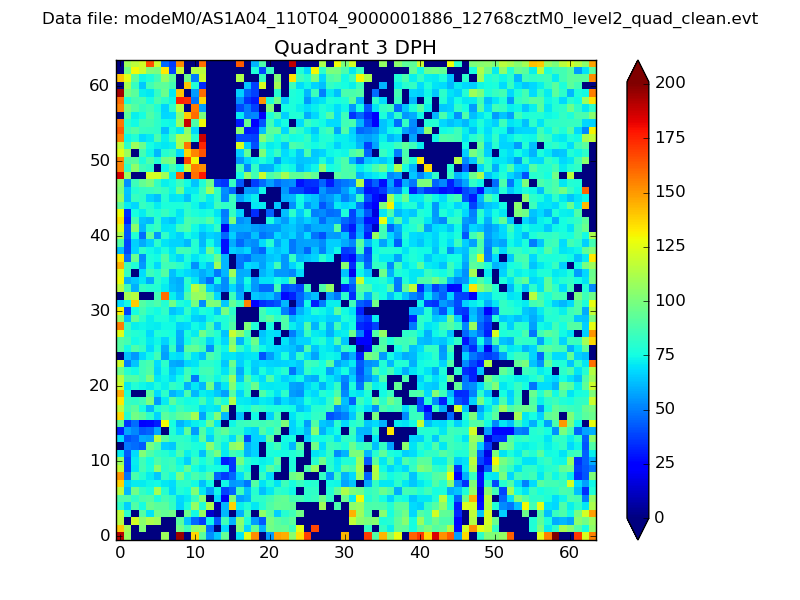 |
 |
Quadrant C |
| Plot type | Count rate plots | Images |
|---|---|---|
| Comparison with Poisson distribution Blue bars denote a histogram of data divided into 1 sec bins. Red curve is a Poisson curve with rate = median count rate of data. |
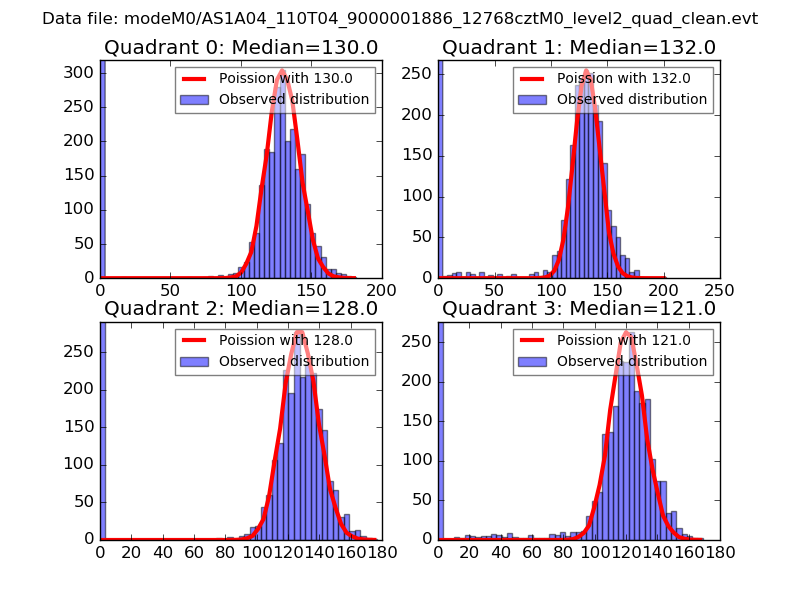 |
 |
| Quadrant-wise count rates Data is divided into 100 sec bins |
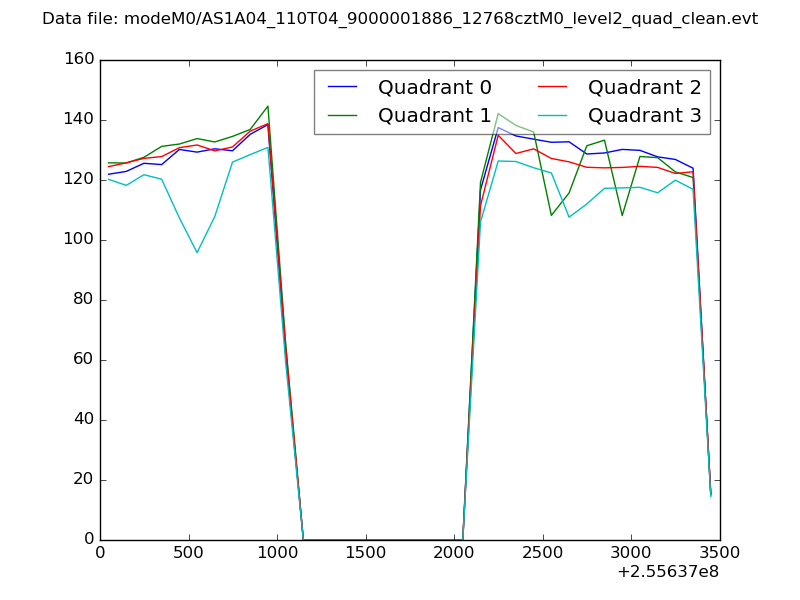 |
|
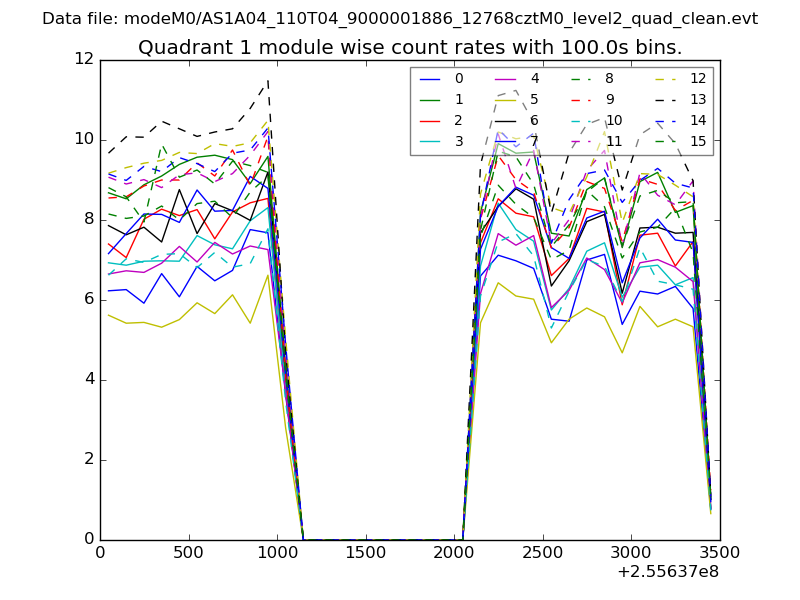
| Module-wise count rates for Quadrant A Data is divided into 100 sec bins |
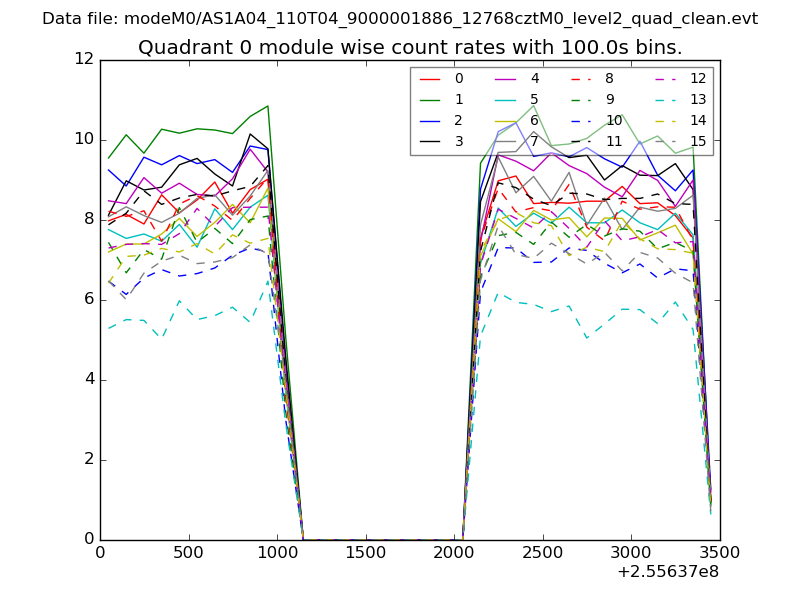 |
 |
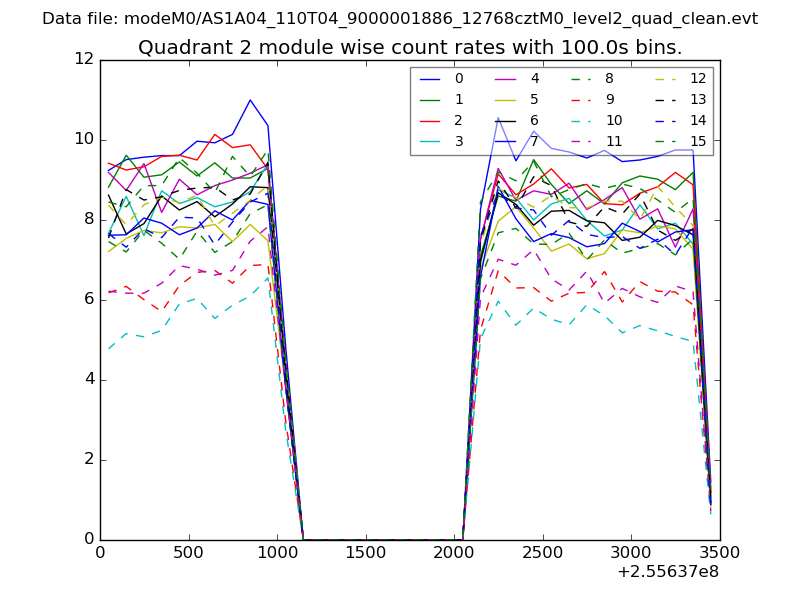
| Module-wise count rates for Quadrant B Data is divided into 100 sec bins |
 |
 |
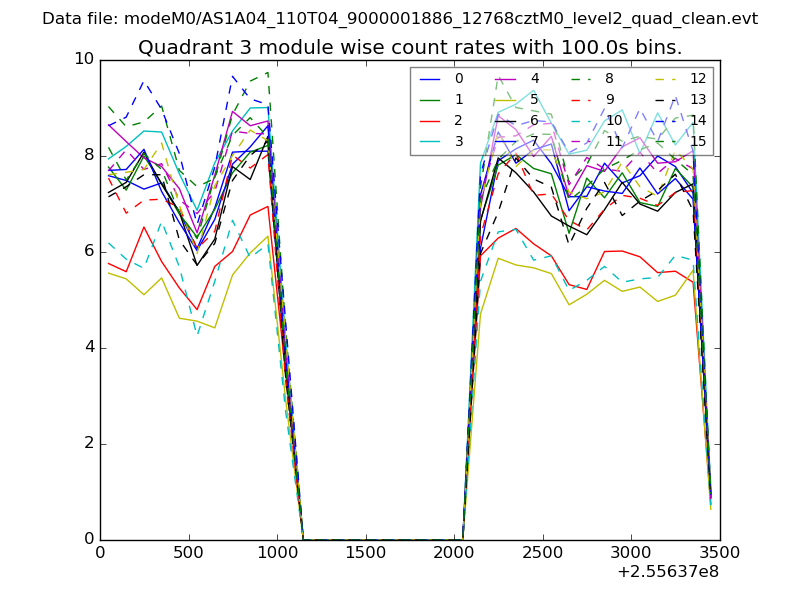
| Module-wise count rates for Quadrant C Data is divided into 100 sec bins |
 |
 |
| Module-wise count rates for Quadrant D Data is divided into 100 sec bins |
 |
 |
| Parameter | Plot |
|---|---|
| CZT HV Monitor | 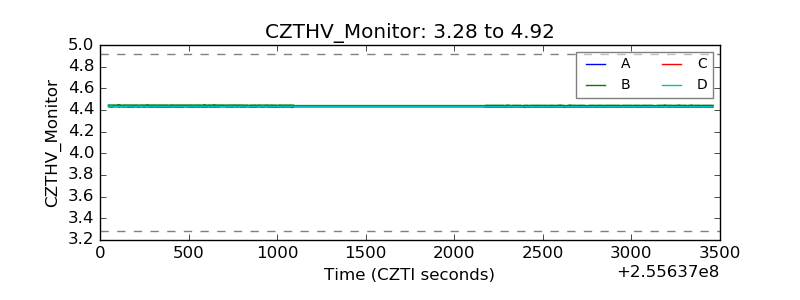 |
| D_VDD | 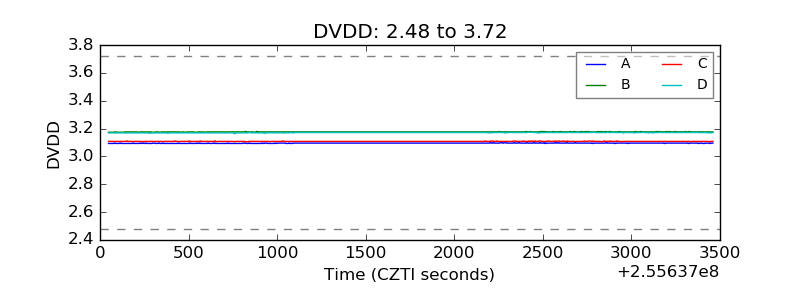 |
| Temperature 1 | 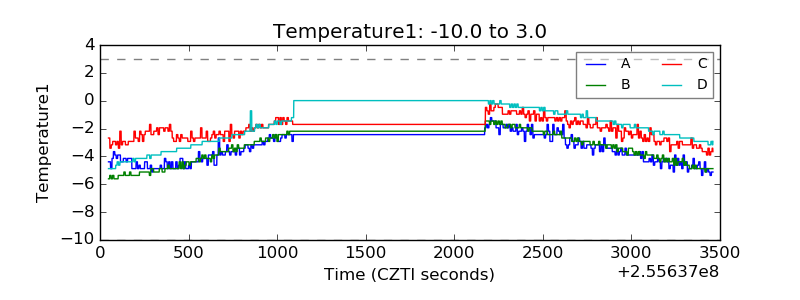 |
| Veto HV Monitor | 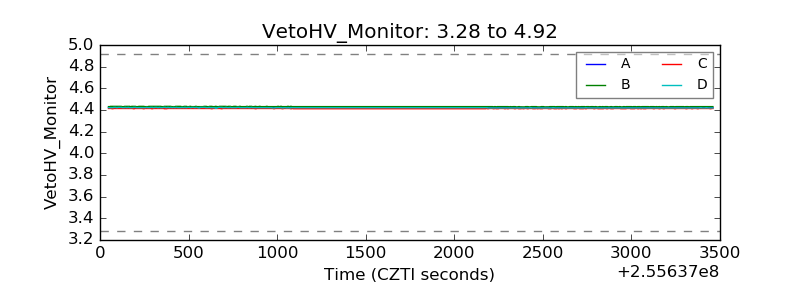 |
| Veto LLD | 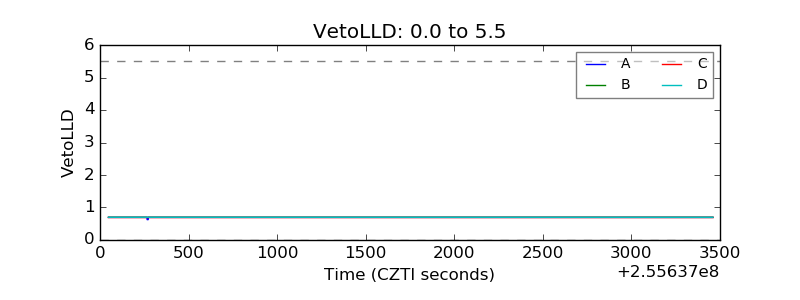 |
| Alpha Counter | 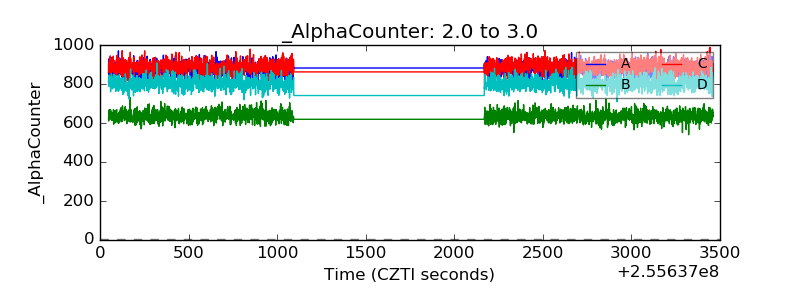 |
| _CPM_Rate | 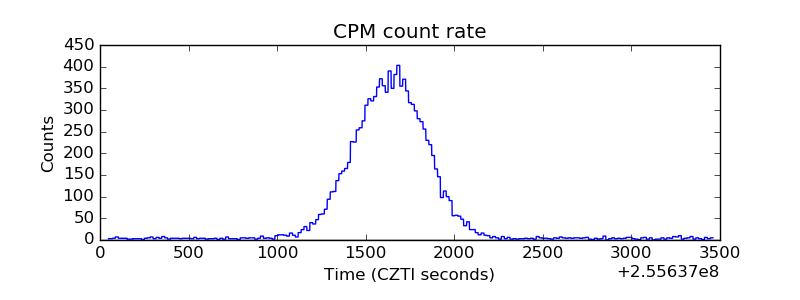 |
| CZT Counter | 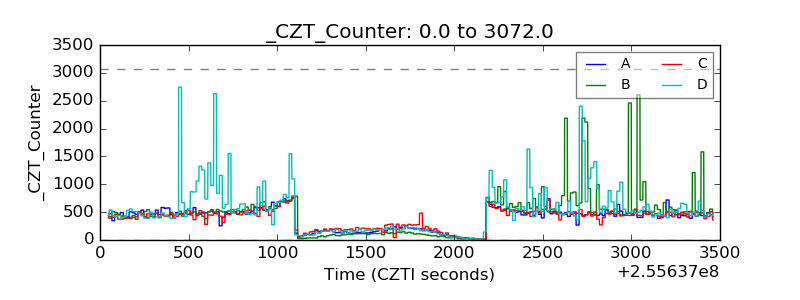 |
| +2.5 Volts monitor |  |
| +5 Volts monitor |  |
| _ROLL_ROT | 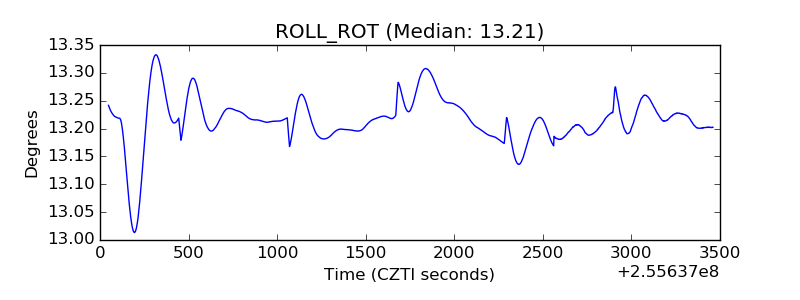 |
| _Roll_DEC | 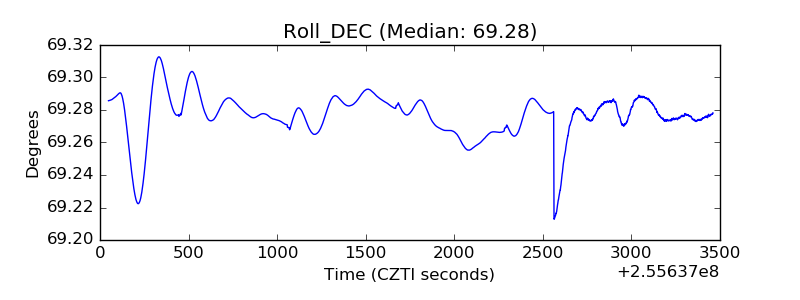 |
| _Roll_RA | 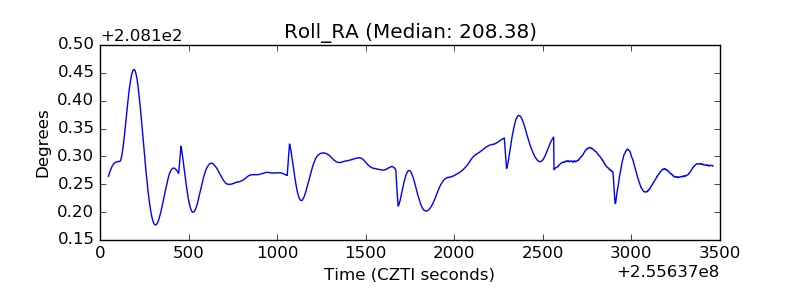 |
| Veto Counter | 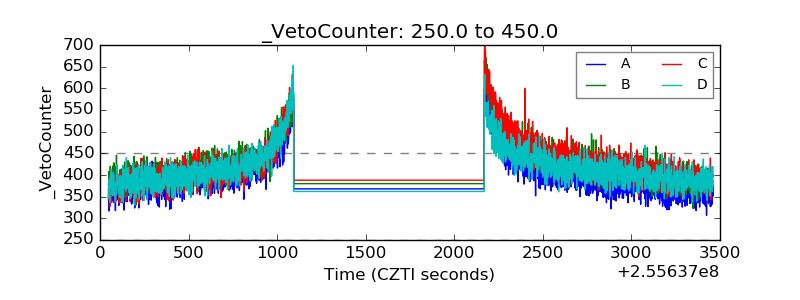 |