| Param | Original file | Final file |
|---|---|---|
| Filename | modeM0/AS1A04_110T04_9000001886_12769cztM0_level2.evt | modeM0/AS1A04_110T04_9000001886_12769cztM0_level2_quad_clean.evt |
| Size (bytes) | 527,990,400 | 131,811,840 |
| Size | 503.5 MB | 125.7 MB |
| Events in quadrant A | 3,257,663 | 892,650 |
| Events in quadrant B | 4,282,303 | 885,108 |
| Events in quadrant C | 3,205,259 | 887,475 |
| Events in quadrant D | 4,757,906 | 827,476 |
| Mode SS | |||
|---|---|---|---|
| Quadrant | BADHDUFLAG | Total packets | Discarded packets |
| A | 0 | 146 | 0 |
| B | 0 | 146 | 0 |
| C | 0 | 146 | 0 |
| D | 0 | 146 | 0 |
| Mode M0 | |||
|---|---|---|---|
| Quadrant | BADHDUFLAG | Total packets | Discarded packets |
| A | 0 | 14798 | 3 |
| B | 0 | 17669 | 2 |
| C | 0 | 14686 | 2 |
| D | 0 | 19302 | 2 |
| Mode M9 | |||
|---|---|---|---|
| Quadrant | BADHDUFLAG | Total packets | Discarded packets |
| A | 0 | 16 | 0 |
| B | 0 | 16 | 0 |
| C | 0 | 16 | 0 |
| D | 0 | 16 | 0 |
| Quadrant | Total seconds | Saturated seconds | Saturation percentage |
|---|---|---|---|
| A | 7164 | 61 | 0.851480% |
| B | 7164 | 393 | 5.485762% |
| C | 7164 | 50 | 0.697934% |
| D | 7164 | 433 | 6.044109% |
Noise dominated data is calculated using 1-second bins in cleaned event files. If a bin has >2000 counts, and if more than 50% of those come from <1% of pixels, then it is considered to be noise-dominated and hence unusable.
| Quadrant | # 1 sec bins | Bins with >0 counts | Bins with >2000 counts | High rate bins dominated by noise | Noise dominated (total time) | Noise dominated (detector-on time) | Marked lightcurve |
|---|---|---|---|---|---|---|---|
| A | 8921 | 7168 | 0 | 0 | 0.00% | 0.00% | 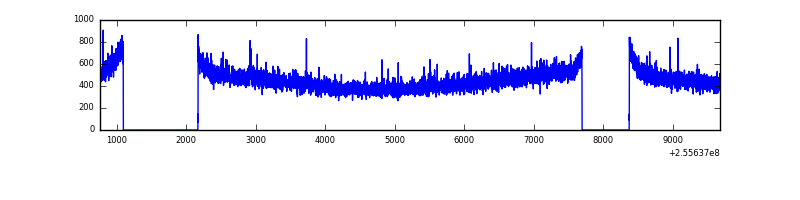 |
| B | 8921 | 7168 | 194 | 194 | 2.17% | 2.71% | 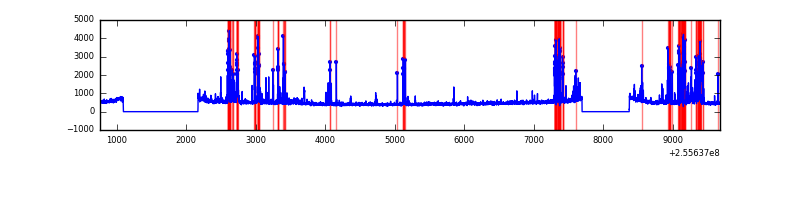 |
| C | 8921 | 7168 | 0 | 0 | 0.00% | 0.00% | 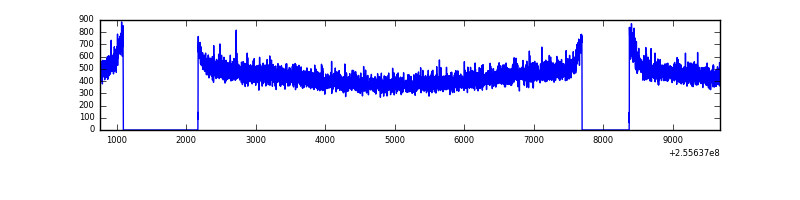 |
| D | 8921 | 7168 | 257 | 257 | 2.88% | 3.59% | 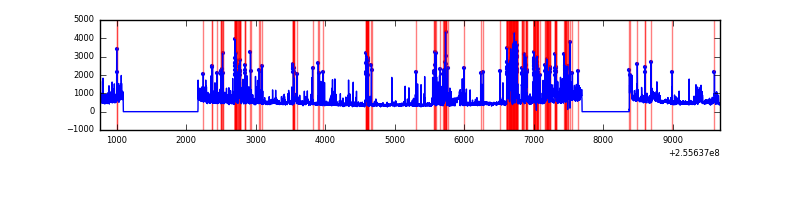 |
Top three noisy pixels from each quadrant. If the there are fewer than three noisy pixels in the level2.evt file, extra rows are filled as -1
| Pixel properties | Quadrant properties | ||||||
|---|---|---|---|---|---|---|---|
| Quadrant | DetID | PixID | Counts | Sigma | Mean | Median | Sigma |
| A | 12 | 189 | 10809 | 58.16 | 839 | 820 | 171.8 |
| A | 8 | 6 | 9737 | 51.92 | 839 | 820 | 171.8 |
| A | 0 | 226 | 7713 | 40.13 | 839 | 820 | 171.8 |
| B | 4 | 239 | 885059 | 5685.56 | 825 | 801 | 155.5 |
| B | 0 | 85 | 43936 | 277.35 | 825 | 801 | 155.5 |
| B | 3 | 209 | 23806 | 147.92 | 825 | 801 | 155.5 |
| C | 13 | 61 | 5989 | 27.49 | 820 | 821 | 188.0 |
| C | 15 | 208 | 5508 | 24.93 | 820 | 821 | 188.0 |
| C | 0 | 207 | 2388 | 8.33 | 820 | 821 | 188.0 |
| D | 1 | 52 | 1129460 | 5912.8 | 797 | 774 | 190.9 |
| D | 10 | 253 | 222261 | 1160.29 | 797 | 774 | 190.9 |
| D | 8 | 195 | 167791 | 874.94 | 797 | 774 | 190.9 |
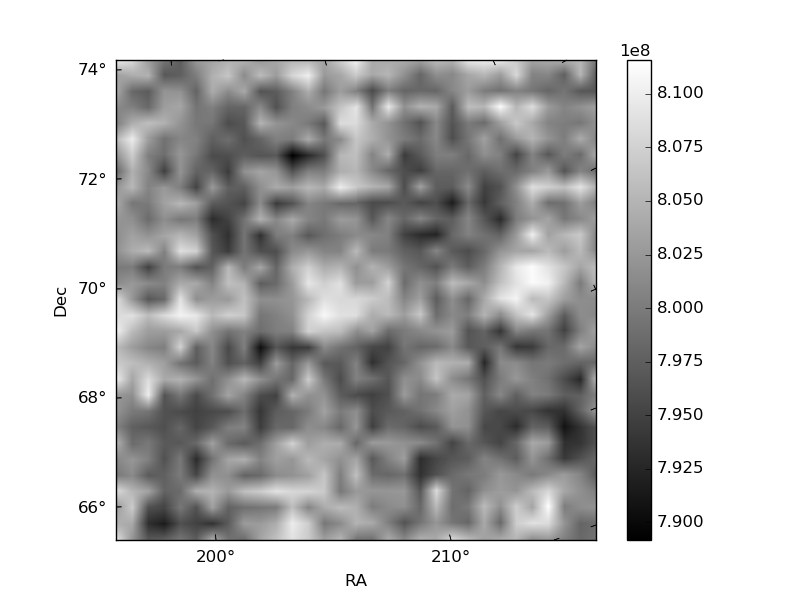
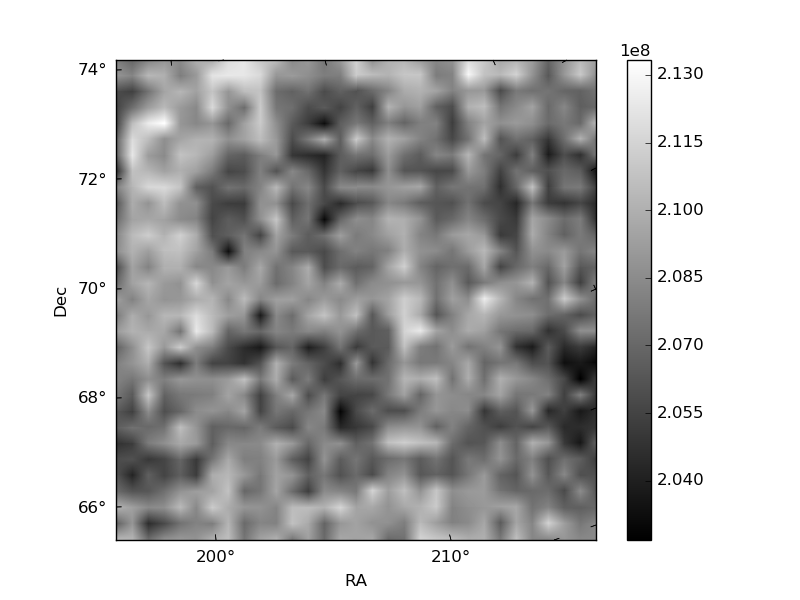
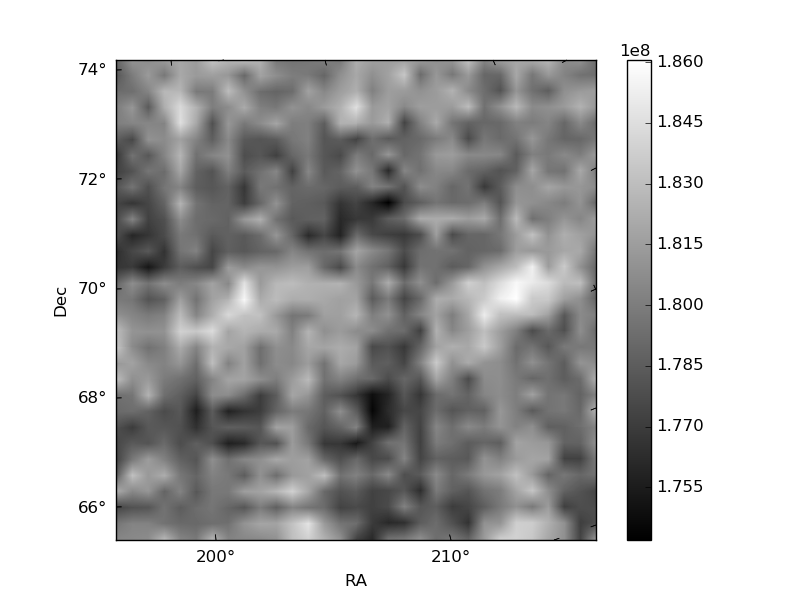
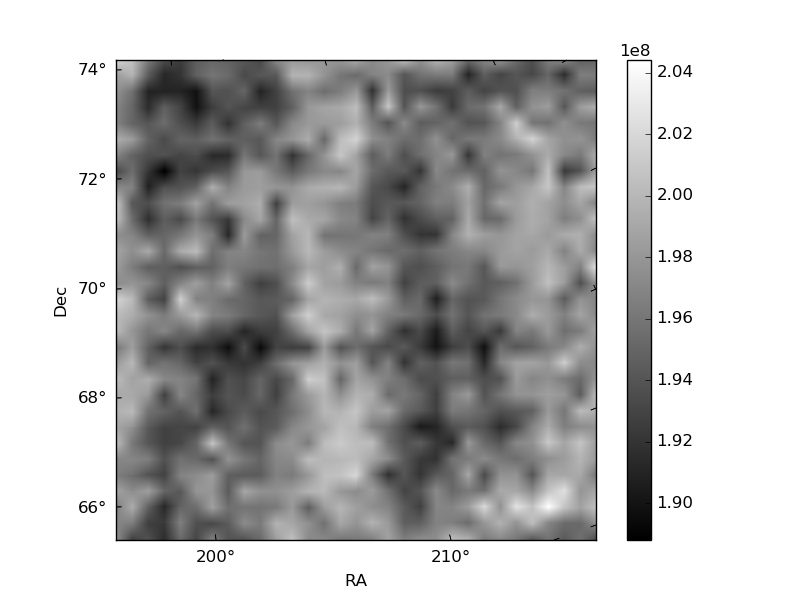
Histogram calculated using DETX and DETY for each event in the final _common_clean file
| Quadrant A | 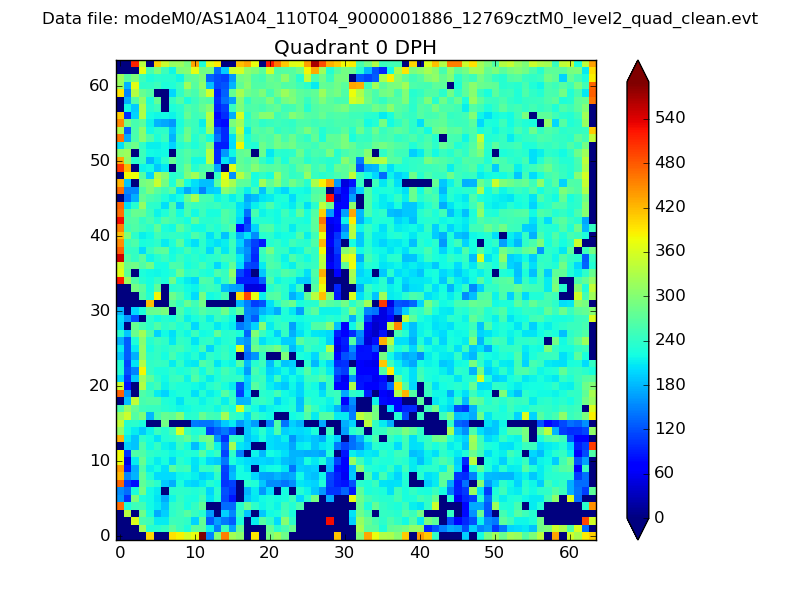 |
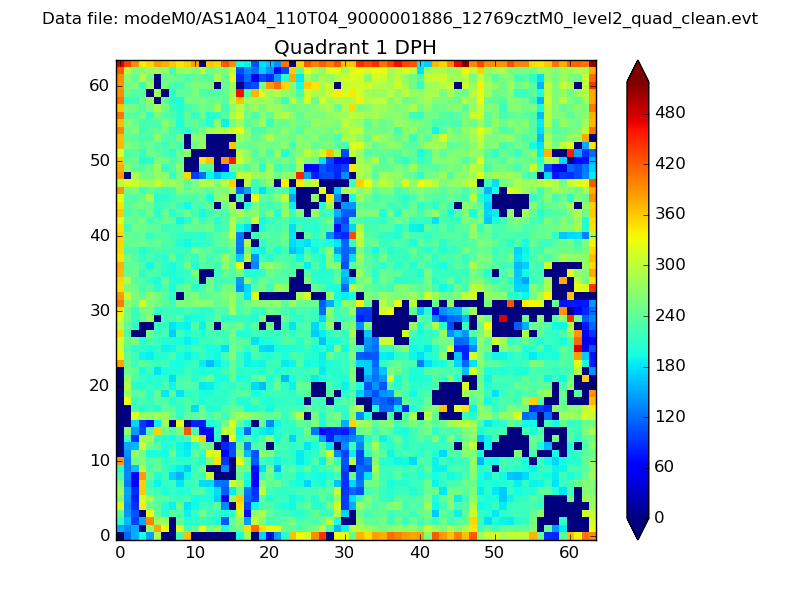 |
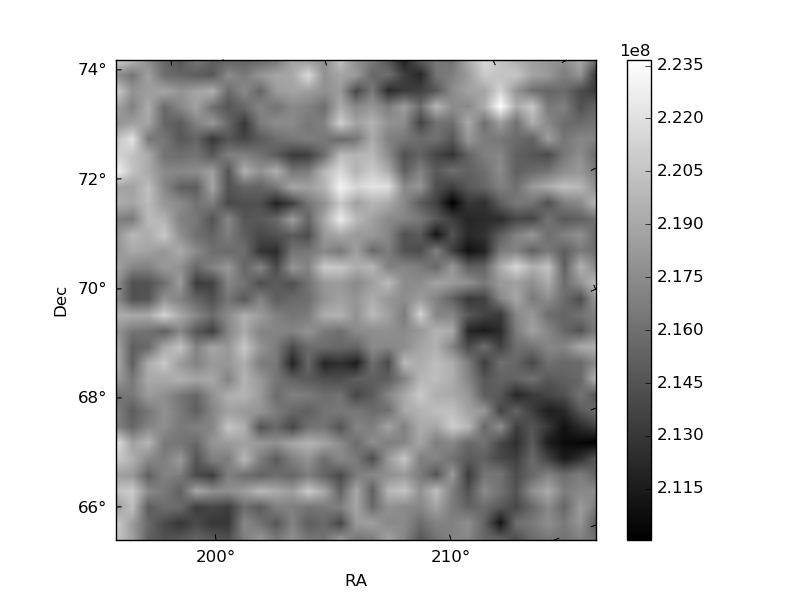
Quadrant B |
|---|---|---|---|
| Quadrant D | 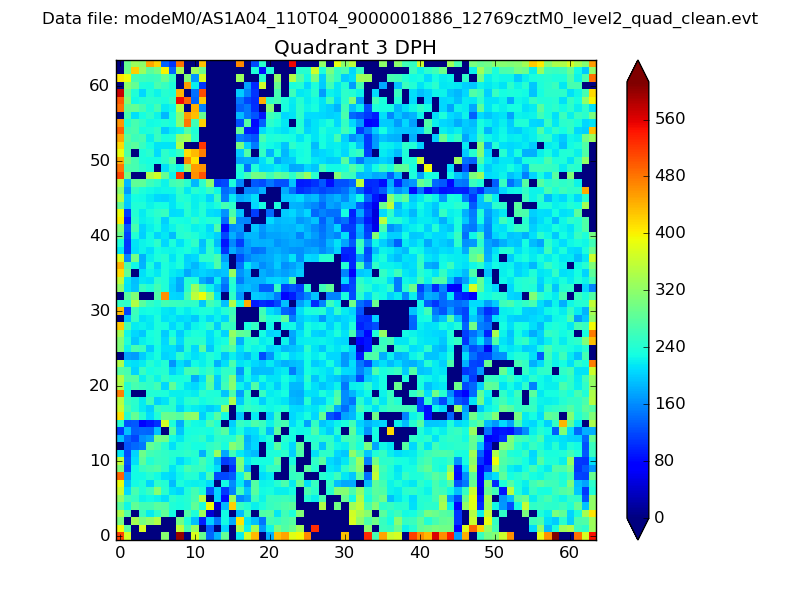 |
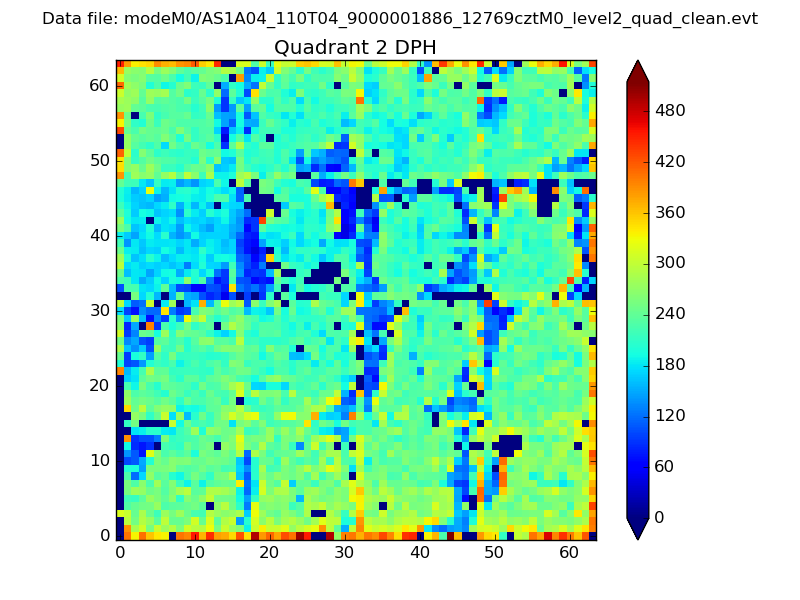 |
Quadrant C |
| Plot type | Count rate plots | Images |
|---|---|---|
| Comparison with Poisson distribution Blue bars denote a histogram of data divided into 1 sec bins. Red curve is a Poisson curve with rate = median count rate of data. |
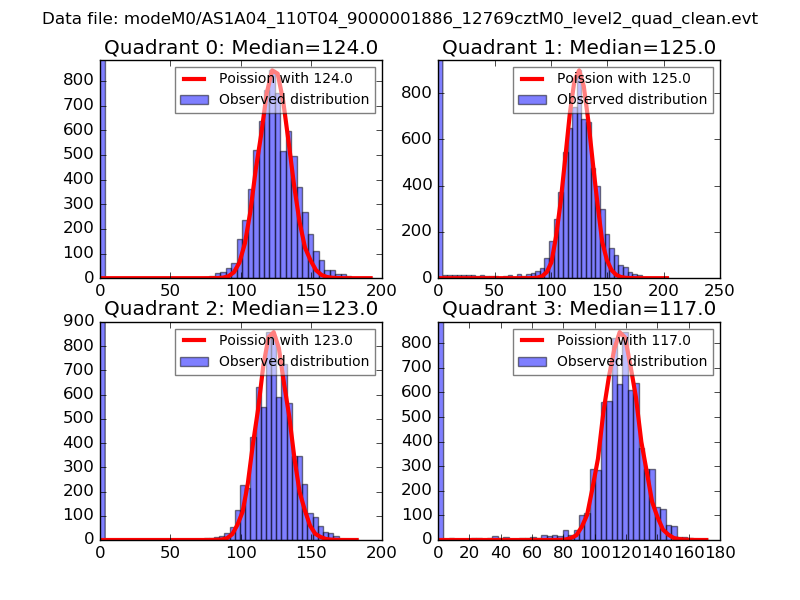 |
 |
| Quadrant-wise count rates Data is divided into 100 sec bins |
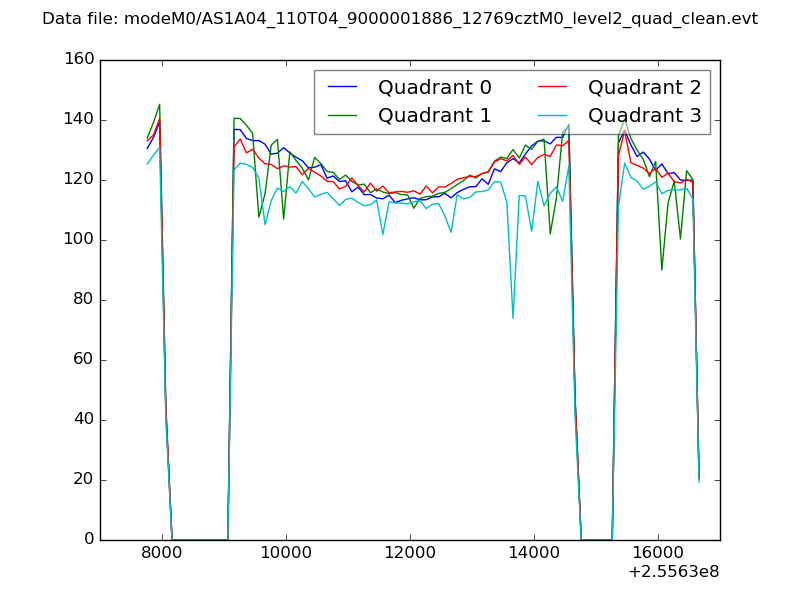 |
|
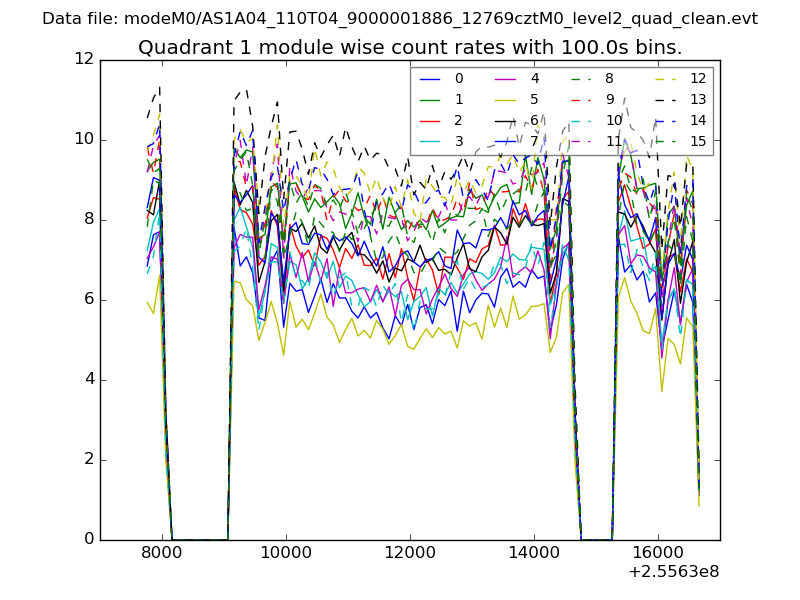
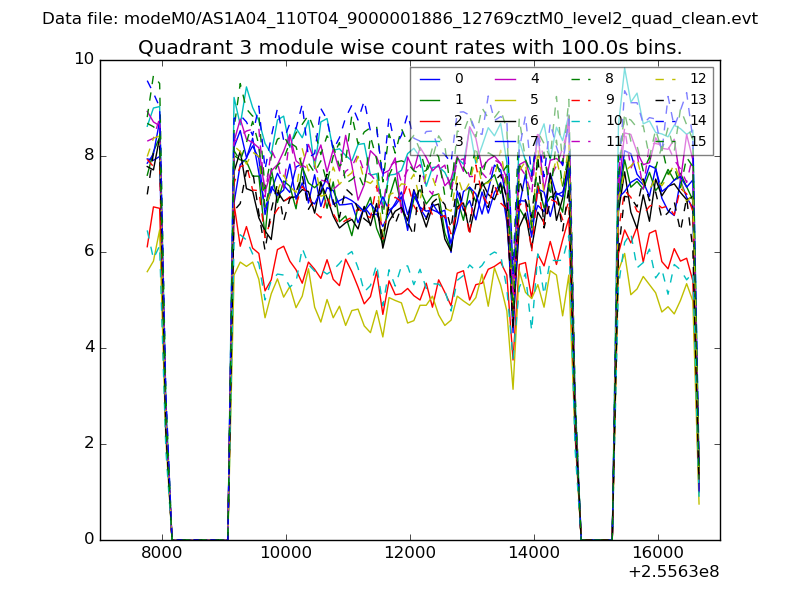
| Module-wise count rates for Quadrant A Data is divided into 100 sec bins |
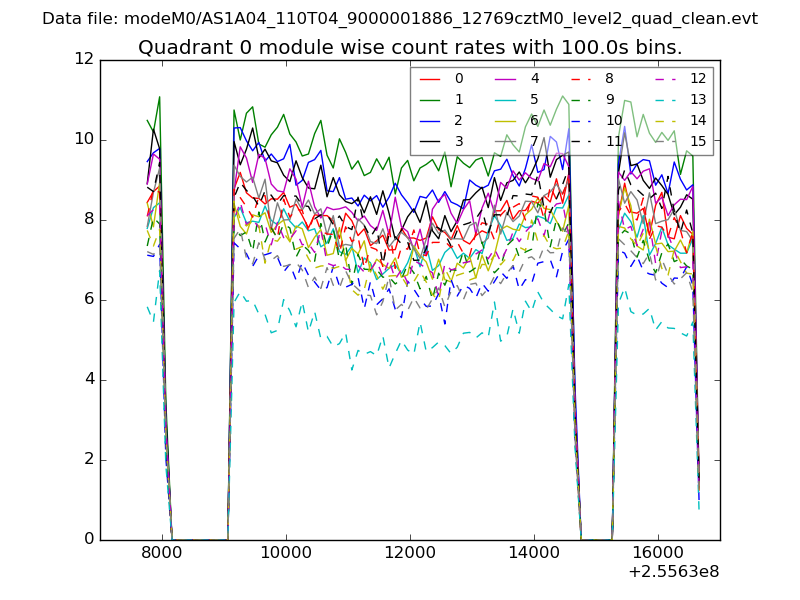 |
 |
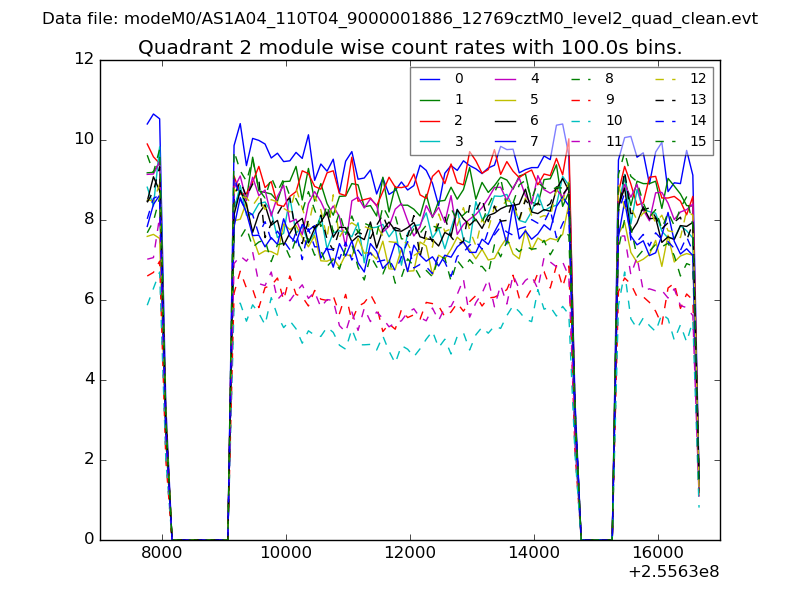
| Module-wise count rates for Quadrant B Data is divided into 100 sec bins |
 |
 |
| Module-wise count rates for Quadrant C Data is divided into 100 sec bins |
 |
 |
| Module-wise count rates for Quadrant D Data is divided into 100 sec bins |
 |
 |
| Parameter | Plot |
|---|---|
| CZT HV Monitor | 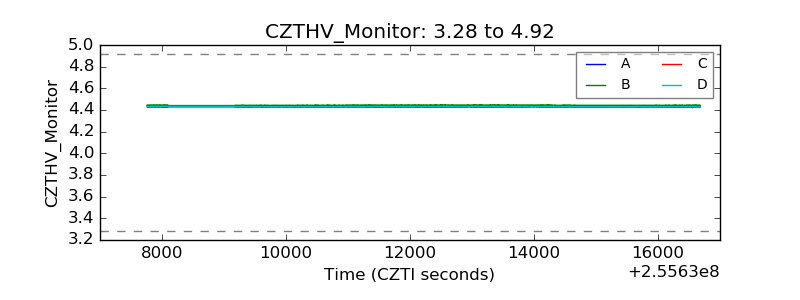 |
| D_VDD | 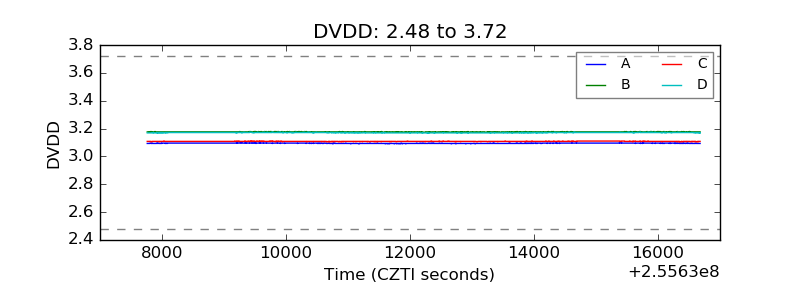 |
| Temperature 1 | 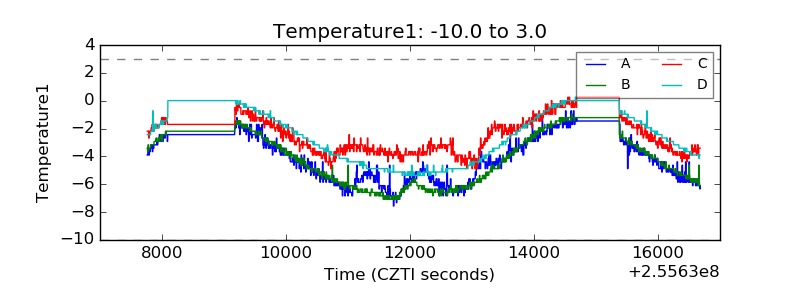 |
| Veto HV Monitor | 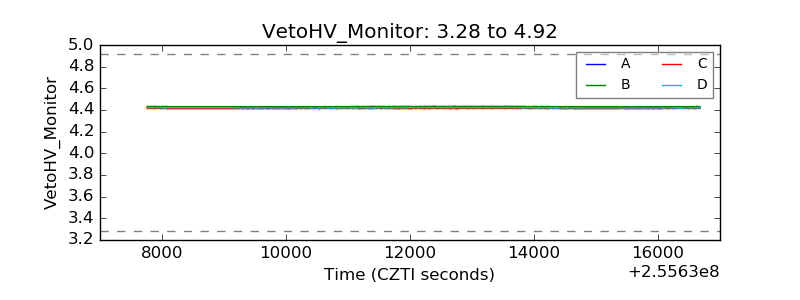 |
| Veto LLD | 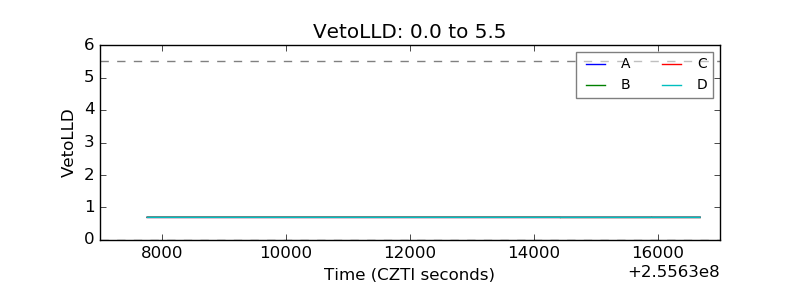 |
| Alpha Counter | 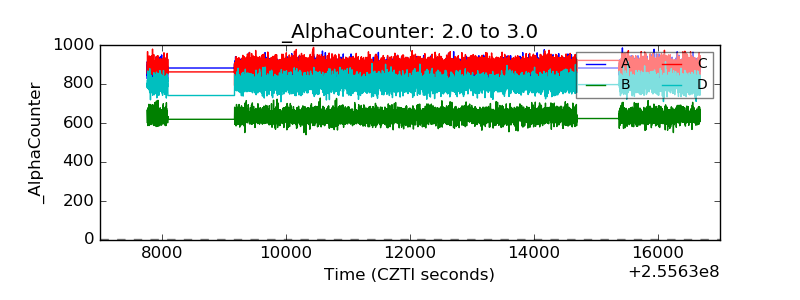 |
| _CPM_Rate | 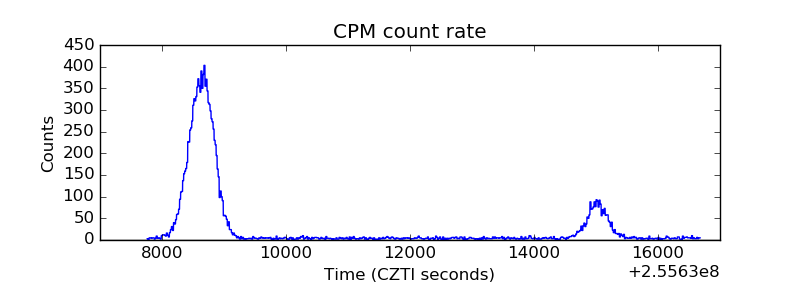 |
| CZT Counter | 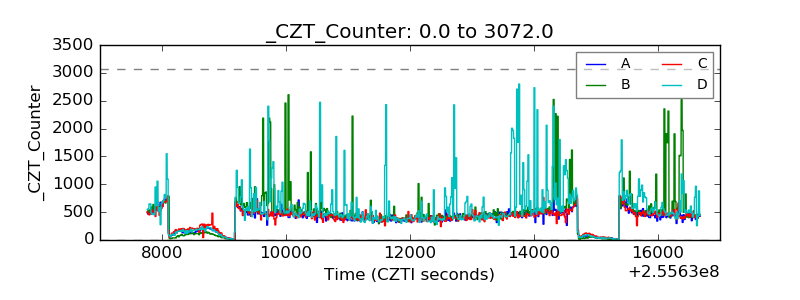 |
| +2.5 Volts monitor |  |
| +5 Volts monitor |  |
| _ROLL_ROT | 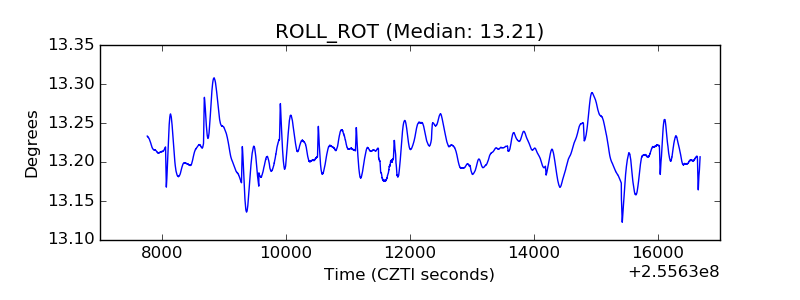 |
| _Roll_DEC | 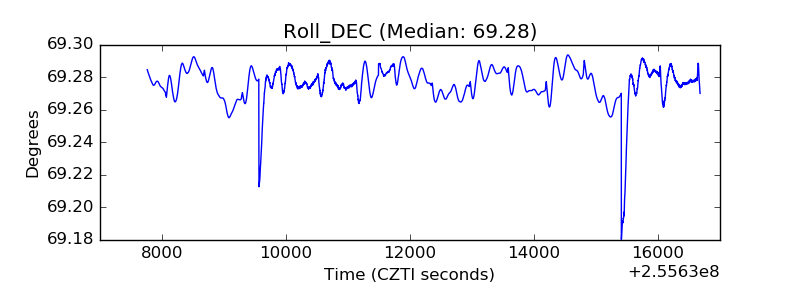 |
| _Roll_RA | 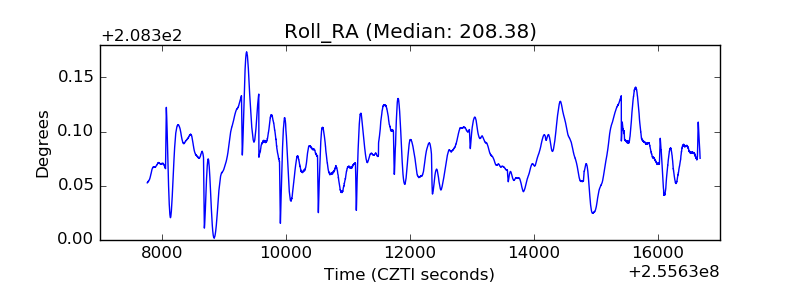 |
| Veto Counter | 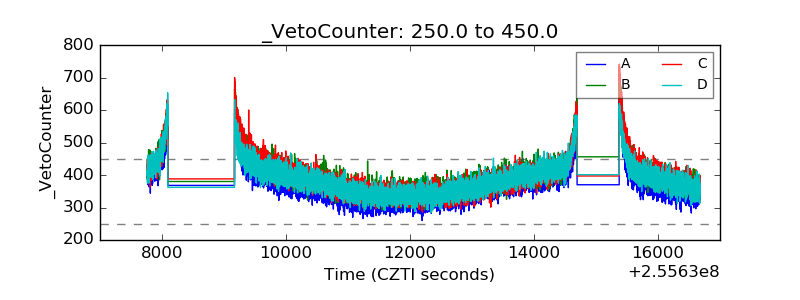 |