| Param | Original file | Final file |
|---|---|---|
| Filename | modeM0/AS1A04_110T04_9000001886_12770cztM0_level2.evt | modeM0/AS1A04_110T04_9000001886_12770cztM0_level2_quad_clean.evt |
| Size (bytes) | 577,834,560 | 134,677,440 |
| Size | 551.1 MB | 128.4 MB |
| Events in quadrant A | 3,350,174 | 908,282 |
| Events in quadrant B | 4,335,035 | 910,455 |
| Events in quadrant C | 3,332,630 | 906,123 |
| Events in quadrant D | 5,976,734 | 835,665 |
| Mode SS | |||
|---|---|---|---|
| Quadrant | BADHDUFLAG | Total packets | Discarded packets |
| A | 0 | 152 | 0 |
| B | 0 | 152 | 0 |
| C | 0 | 152 | 0 |
| D | 0 | 152 | 0 |
| Mode M0 | |||
|---|---|---|---|
| Quadrant | BADHDUFLAG | Total packets | Discarded packets |
| A | 0 | 15354 | 3 |
| B | 0 | 17979 | 2 |
| C | 0 | 15352 | 2 |
| D | 0 | 22938 | 2 |
| Mode M9 | |||
|---|---|---|---|
| Quadrant | BADHDUFLAG | Total packets | Discarded packets |
| A | 0 | 9 | 0 |
| B | 0 | 9 | 0 |
| C | 0 | 9 | 0 |
| D | 0 | 9 | 0 |
| Quadrant | Total seconds | Saturated seconds | Saturation percentage |
|---|---|---|---|
| A | 7444 | 34 | 0.456744% |
| B | 7444 | 309 | 4.150994% |
| C | 7444 | 41 | 0.550779% |
| D | 7444 | 527 | 7.079527% |
Noise dominated data is calculated using 1-second bins in cleaned event files. If a bin has >2000 counts, and if more than 50% of those come from <1% of pixels, then it is considered to be noise-dominated and hence unusable.
| Quadrant | # 1 sec bins | Bins with >0 counts | Bins with >2000 counts | High rate bins dominated by noise | Noise dominated (total time) | Noise dominated (detector-on time) | Marked lightcurve |
|---|---|---|---|---|---|---|---|
| A | 8470 | 7448 | 0 | 0 | 0.00% | 0.00% | 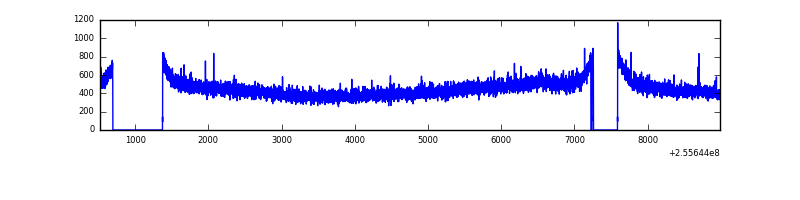 |
| B | 8470 | 7448 | 138 | 138 | 1.63% | 1.85% | 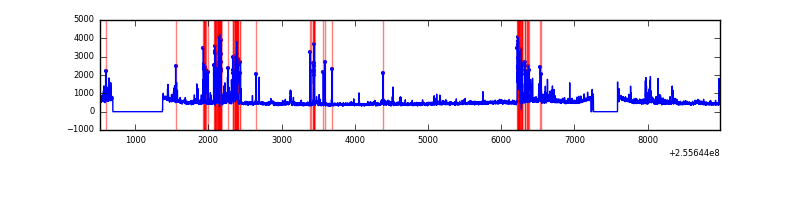 |
| C | 8470 | 7448 | 1 | 1 | 0.01% | 0.01% | 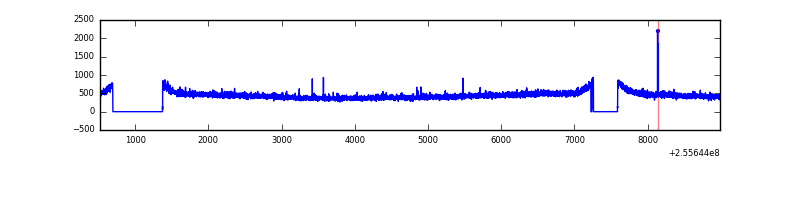 |
| D | 8470 | 7448 | 304 | 304 | 3.59% | 4.08% | 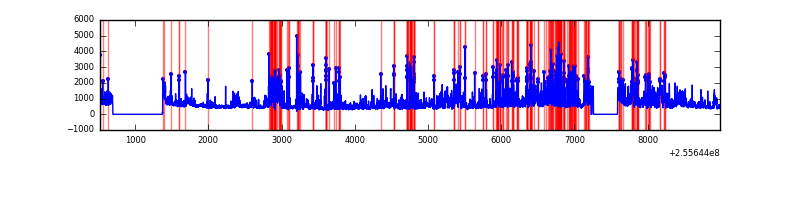 |
Top three noisy pixels from each quadrant. If the there are fewer than three noisy pixels in the level2.evt file, extra rows are filled as -1
| Pixel properties | Quadrant properties | ||||||
|---|---|---|---|---|---|---|---|
| Quadrant | DetID | PixID | Counts | Sigma | Mean | Median | Sigma |
| A | 0 | 226 | 7758 | 38.94 | 866 | 844 | 177.5 |
| A | 12 | 189 | 6861 | 33.89 | 866 | 844 | 177.5 |
| A | 12 | 194 | 6754 | 33.29 | 866 | 844 | 177.5 |
| B | 4 | 239 | 732271 | 4534.63 | 861 | 839 | 161.3 |
| B | 3 | 209 | 43310 | 263.31 | 861 | 839 | 161.3 |
| B | 15 | 32 | 33432 | 202.07 | 861 | 839 | 161.3 |
| C | 15 | 208 | 18923 | 92.04 | 850 | 853 | 196.3 |
| C | 13 | 61 | 6258 | 27.53 | 850 | 853 | 196.3 |
| C | 8 | 222 | 2476 | 8.27 | 850 | 853 | 196.3 |
| D | 1 | 52 | 2407921 | 12160.7 | 818 | 792 | 197.9 |
| D | 2 | 136 | 137462 | 690.45 | 818 | 792 | 197.9 |
| D | 10 | 253 | 88951 | 445.38 | 818 | 792 | 197.9 |
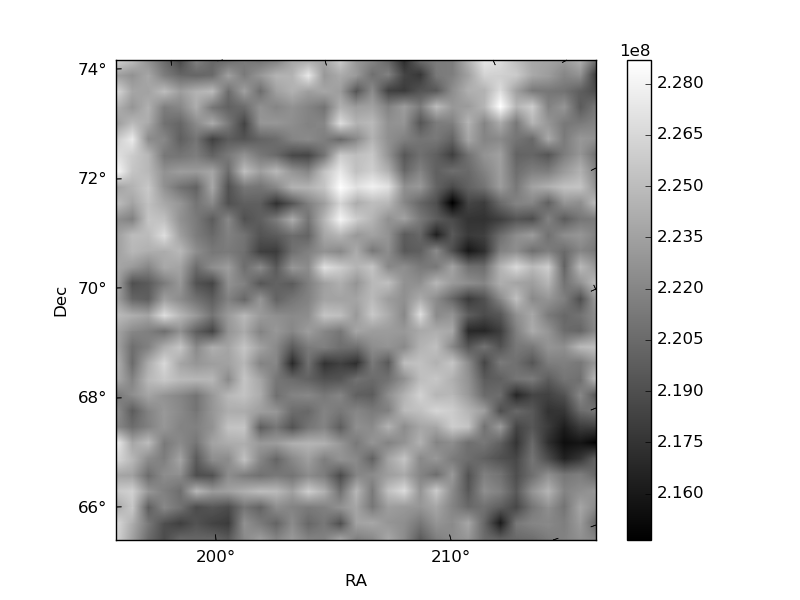
Histogram calculated using DETX and DETY for each event in the final _common_clean file
| Quadrant A | 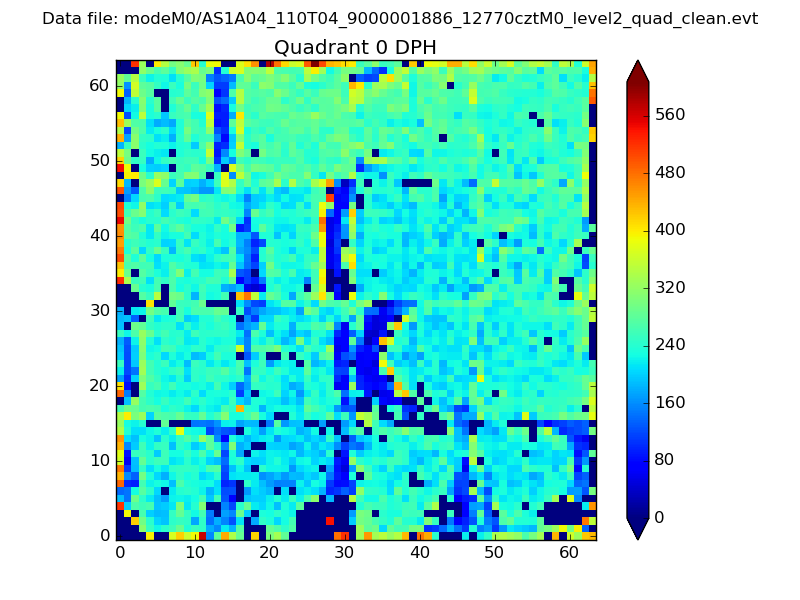 |
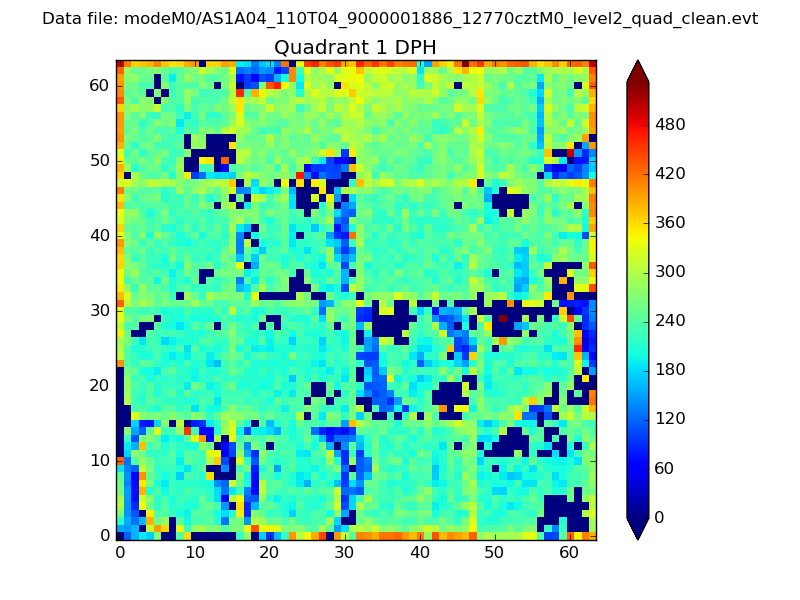 |
Quadrant B |
|---|---|---|---|
| Quadrant D | 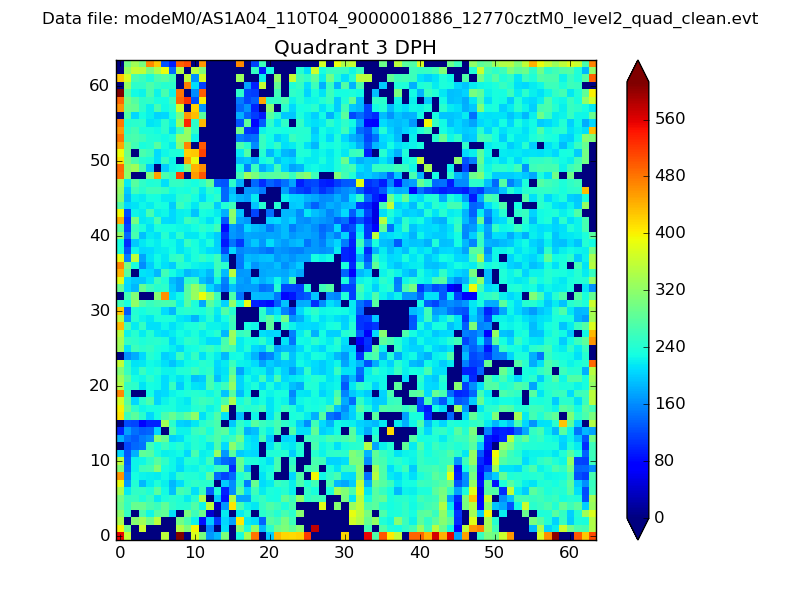 |
 |
Quadrant C |
| Plot type | Count rate plots | Images |
|---|---|---|
| Comparison with Poisson distribution Blue bars denote a histogram of data divided into 1 sec bins. Red curve is a Poisson curve with rate = median count rate of data. |
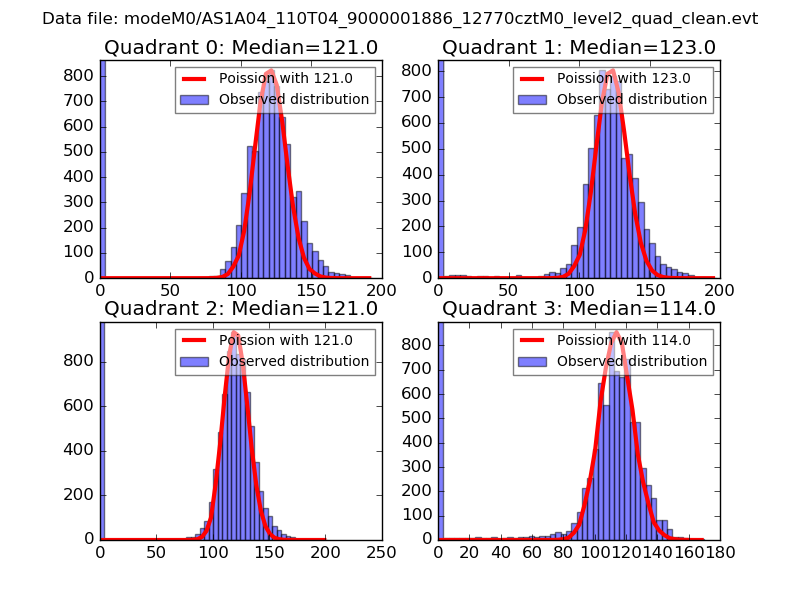 |
 |
| Quadrant-wise count rates Data is divided into 100 sec bins |
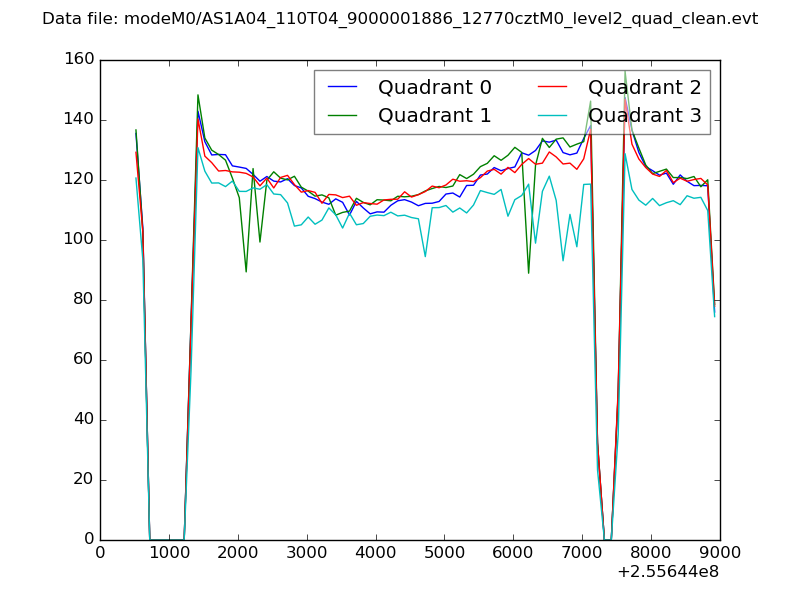 |
|
| Module-wise count rates for Quadrant A Data is divided into 100 sec bins |
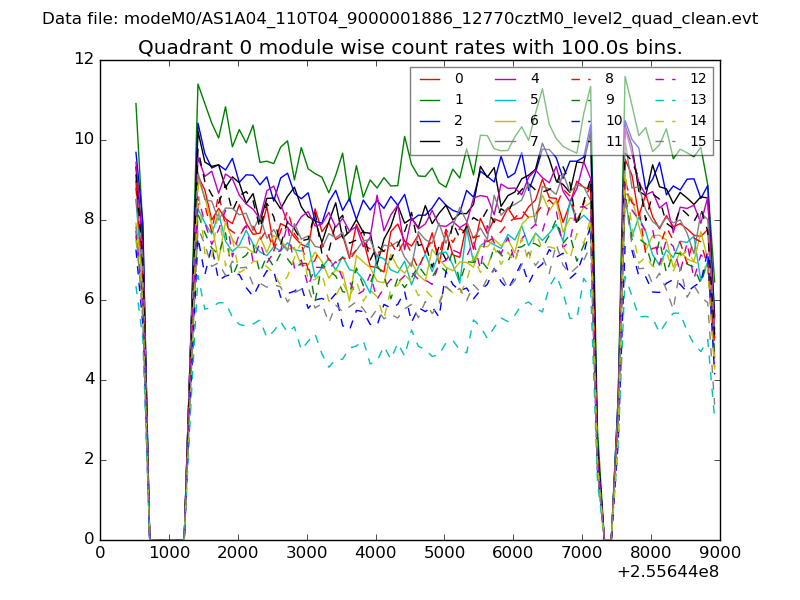 |
 |
| Module-wise count rates for Quadrant B Data is divided into 100 sec bins |
 |
 |
| Module-wise count rates for Quadrant C Data is divided into 100 sec bins |
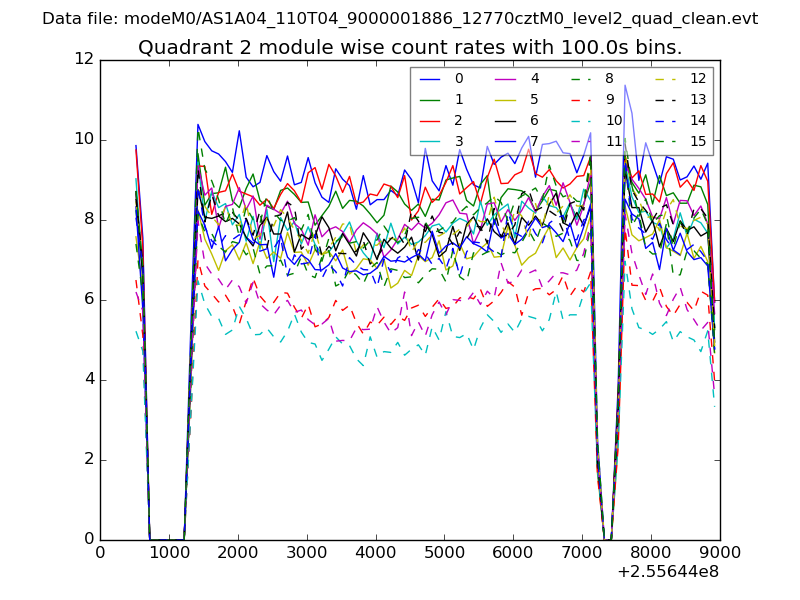 |
 |
| Module-wise count rates for Quadrant D Data is divided into 100 sec bins |
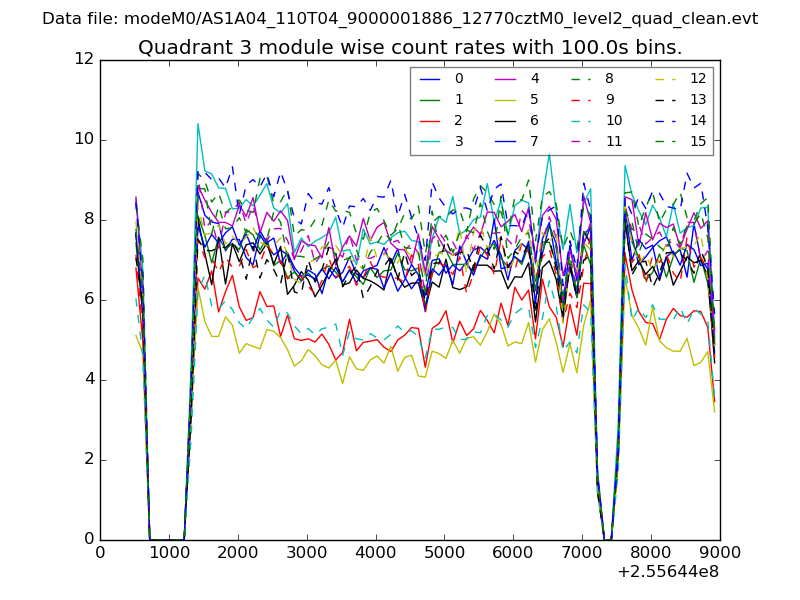 |
 |
| Parameter | Plot |
|---|---|
| CZT HV Monitor | 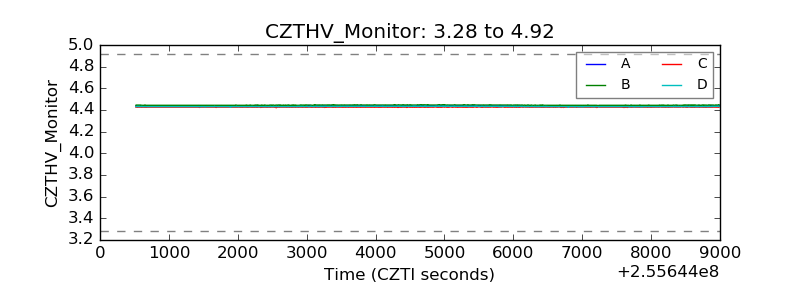 |
| D_VDD | 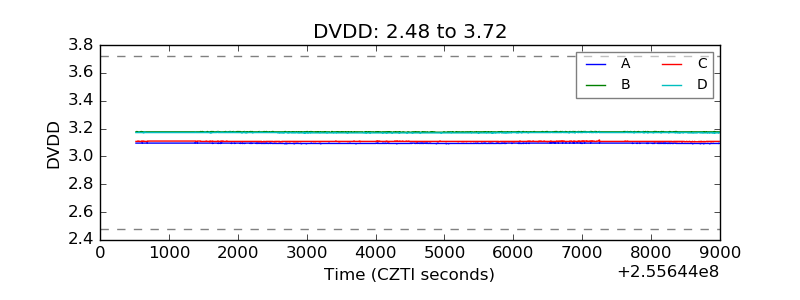 |
| Temperature 1 | 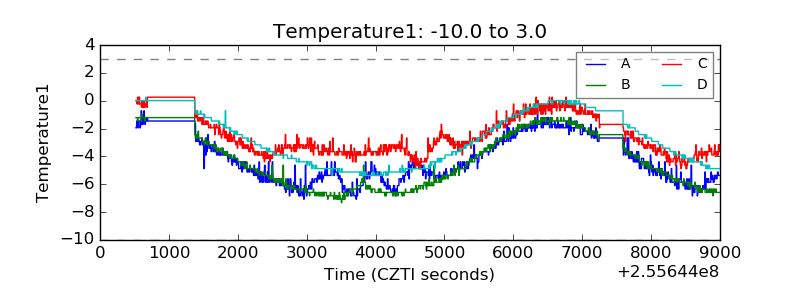 |
| Veto HV Monitor | 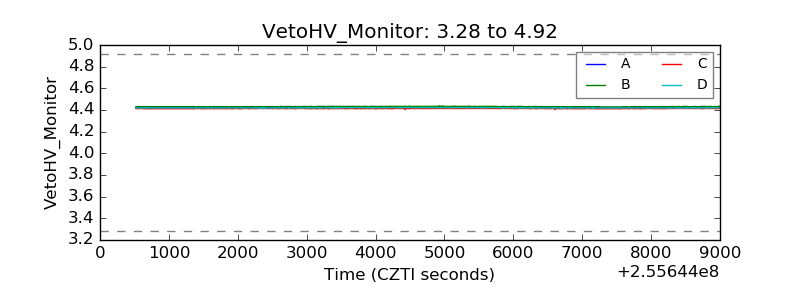 |
| Veto LLD | 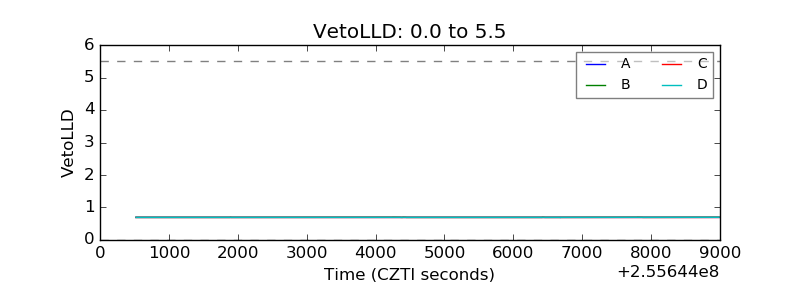 |
| Alpha Counter | 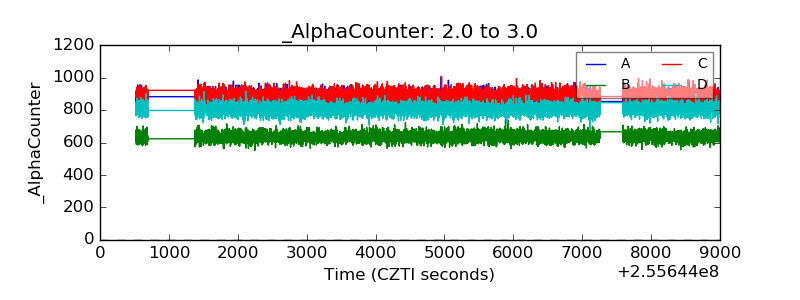 |
| _CPM_Rate | 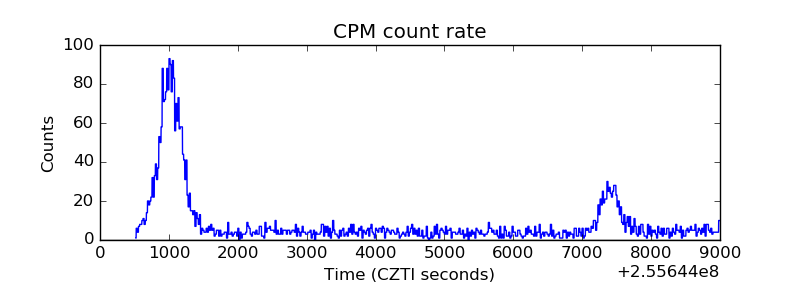 |
| CZT Counter | 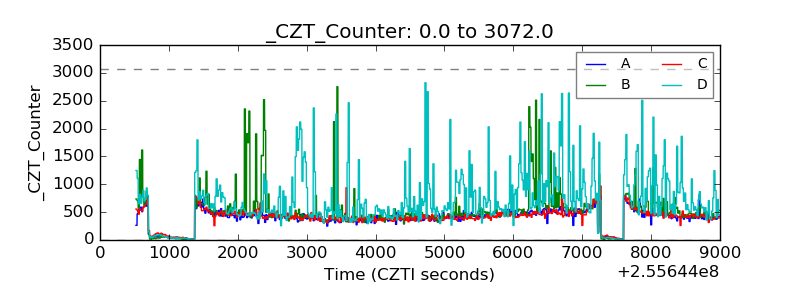 |
| +2.5 Volts monitor |  |
| +5 Volts monitor |  |
| _ROLL_ROT | 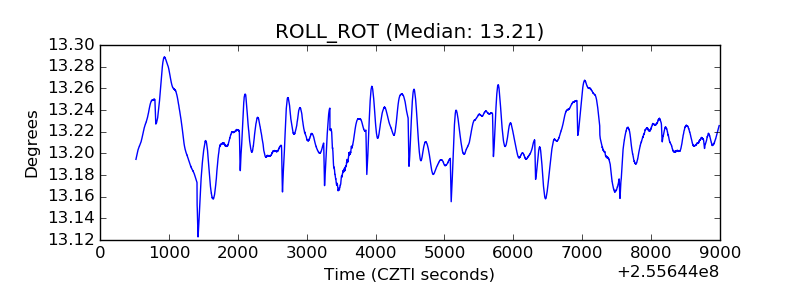 |
| _Roll_DEC | 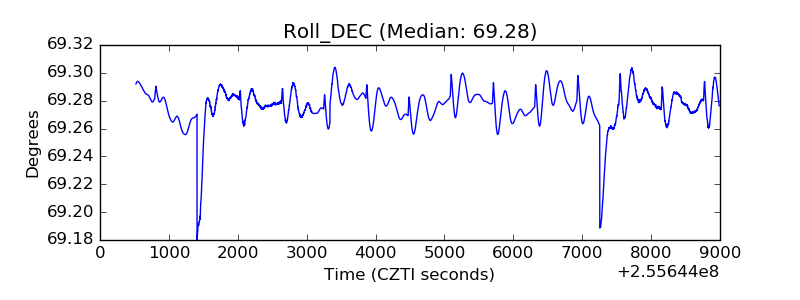 |
| _Roll_RA |  |
| Veto Counter | 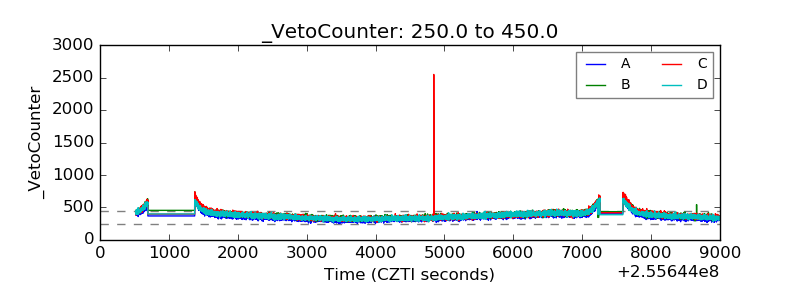 |