| Param | Original file | Final file |
|---|---|---|
| Filename | modeM0/AS1A04_110T04_9000001886_12771cztM0_level2.evt | modeM0/AS1A04_110T04_9000001886_12771cztM0_level2_quad_clean.evt |
| Size (bytes) | 592,329,600 | 146,517,120 |
| Size | 564.9 MB | 139.7 MB |
| Events in quadrant A | 3,702,842 | 986,316 |
| Events in quadrant B | 4,593,554 | 985,584 |
| Events in quadrant C | 3,655,160 | 982,484 |
| Events in quadrant D | 5,433,575 | 916,209 |
| Mode SS | |||
|---|---|---|---|
| Quadrant | BADHDUFLAG | Total packets | Discarded packets |
| A | 0 | 170 | 0 |
| B | 0 | 170 | 0 |
| C | 0 | 170 | 0 |
| D | 0 | 170 | 0 |
| Mode M0 | |||
|---|---|---|---|
| Quadrant | BADHDUFLAG | Total packets | Discarded packets |
| A | 0 | 16882 | 3 |
| B | 0 | 19263 | 2 |
| C | 0 | 16847 | 2 |
| D | 0 | 21893 | 2 |
| Mode M9 | |||
|---|---|---|---|
| Quadrant | BADHDUFLAG | Total packets | Discarded packets |
| A | 0 | 7 | 0 |
| B | 0 | 7 | 0 |
| C | 0 | 7 | 0 |
| D | 0 | 7 | 0 |
| Quadrant | Total seconds | Saturated seconds | Saturation percentage |
|---|---|---|---|
| A | 8156 | 41 | 0.502697% |
| B | 8156 | 295 | 3.616969% |
| C | 8156 | 46 | 0.564002% |
| D | 8156 | 411 | 5.039235% |
Noise dominated data is calculated using 1-second bins in cleaned event files. If a bin has >2000 counts, and if more than 50% of those come from <1% of pixels, then it is considered to be noise-dominated and hence unusable.
| Quadrant | # 1 sec bins | Bins with >0 counts | Bins with >2000 counts | High rate bins dominated by noise | Noise dominated (total time) | Noise dominated (detector-on time) | Marked lightcurve |
|---|---|---|---|---|---|---|---|
| A | 8822 | 8161 | 0 | 0 | 0.00% | 0.00% | 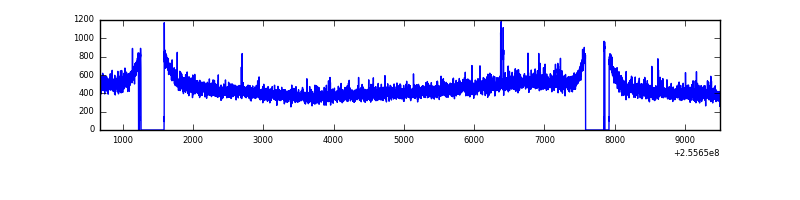 |
| B | 8822 | 8161 | 153 | 153 | 1.73% | 1.87% | 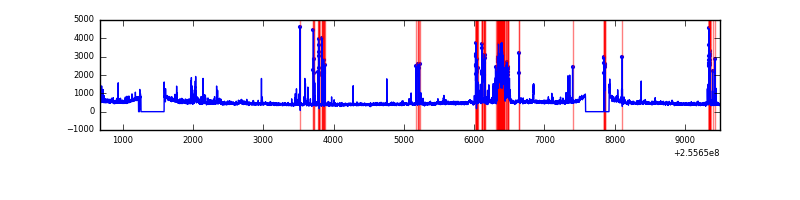 |
| C | 8822 | 8161 | 1 | 1 | 0.01% | 0.01% | 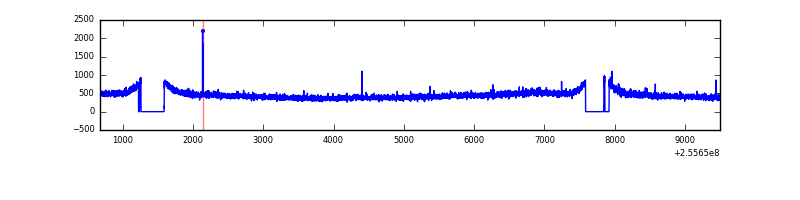 |
| D | 8822 | 8161 | 236 | 236 | 2.68% | 2.89% |  |
Top three noisy pixels from each quadrant. If the there are fewer than three noisy pixels in the level2.evt file, extra rows are filled as -1
| Pixel properties | Quadrant properties | ||||||
|---|---|---|---|---|---|---|---|
| Quadrant | DetID | PixID | Counts | Sigma | Mean | Median | Sigma |
| A | 8 | 15 | 19846 | 97.29 | 951 | 926 | 194.5 |
| A | 8 | 6 | 11158 | 52.61 | 951 | 926 | 194.5 |
| A | 0 | 226 | 8529 | 39.1 | 951 | 926 | 194.5 |
| B | 4 | 239 | 678480 | 3809.2 | 943 | 919 | 177.9 |
| B | 3 | 209 | 41833 | 230.02 | 943 | 919 | 177.9 |
| B | 0 | 219 | 34213 | 187.18 | 943 | 919 | 177.9 |
| C | 15 | 208 | 27405 | 122.67 | 930 | 931 | 215.8 |
| C | 13 | 61 | 6834 | 27.35 | 930 | 931 | 215.8 |
| C | 14 | 234 | 2620 | 7.83 | 930 | 931 | 215.8 |
| D | 1 | 52 | 1466953 | 6713.6 | 904 | 877 | 218.4 |
| D | 13 | 104 | 146157 | 665.28 | 904 | 877 | 218.4 |
| D | 8 | 195 | 100808 | 457.61 | 904 | 877 | 218.4 |
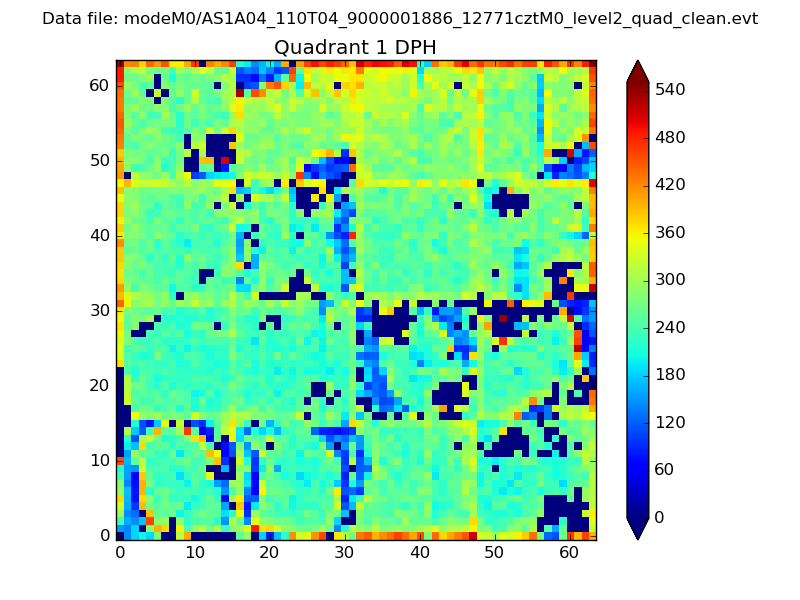
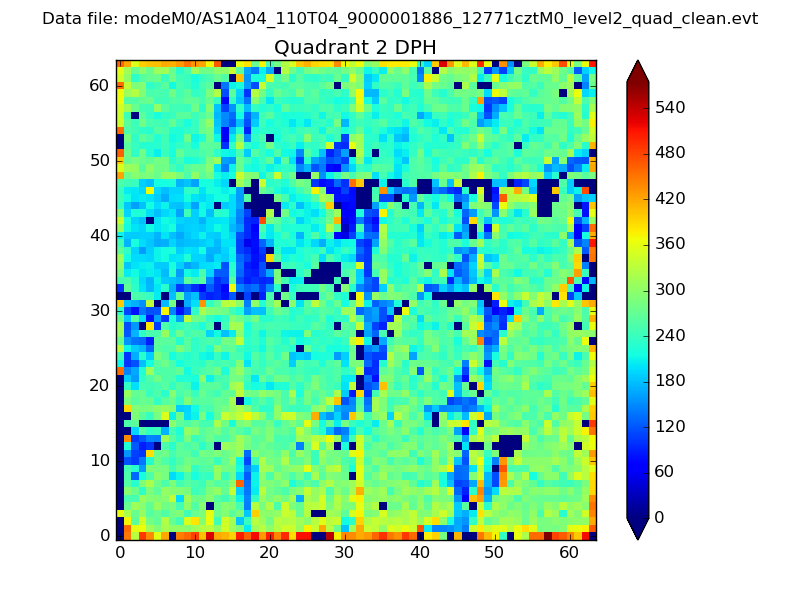
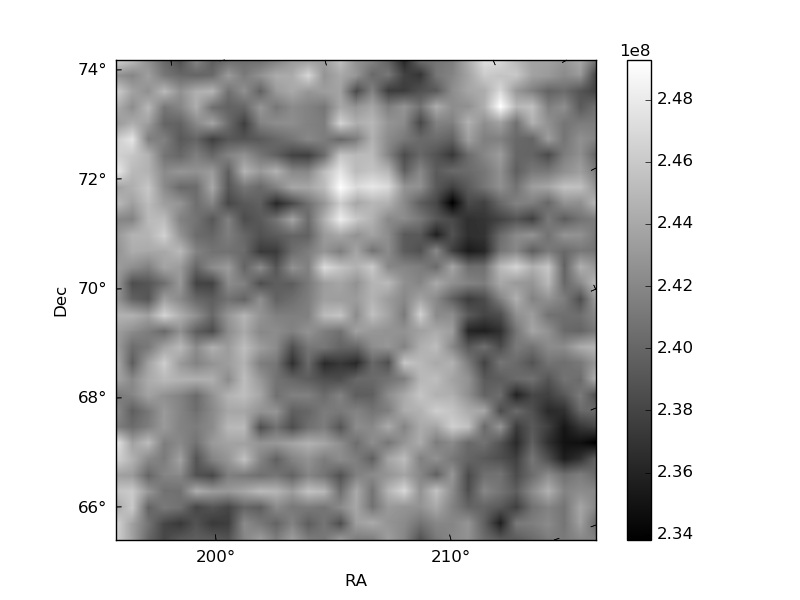
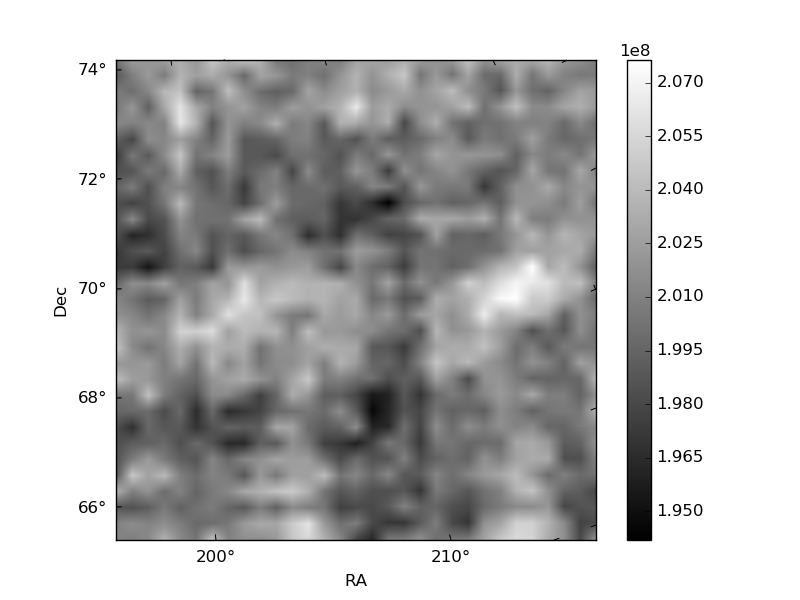
Histogram calculated using DETX and DETY for each event in the final _common_clean file
| Quadrant A | 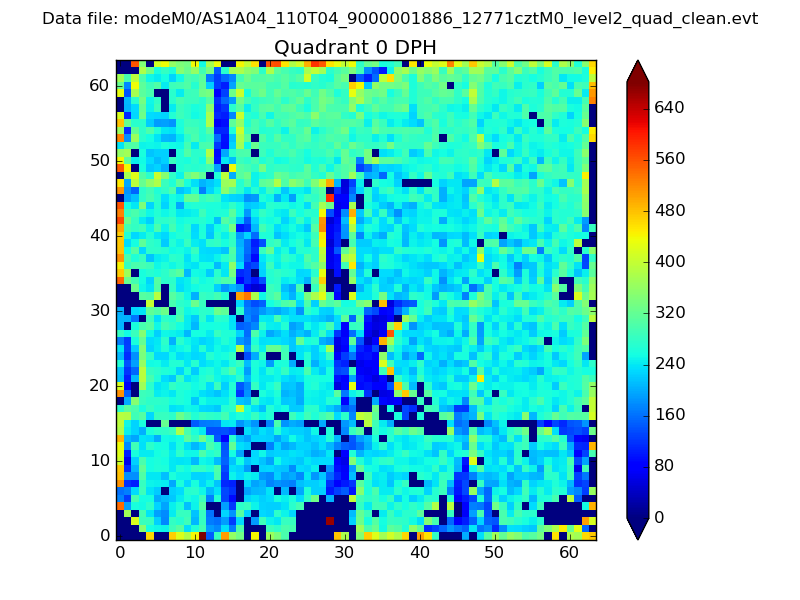 |
 |
Quadrant B |
|---|---|---|---|
| Quadrant D | 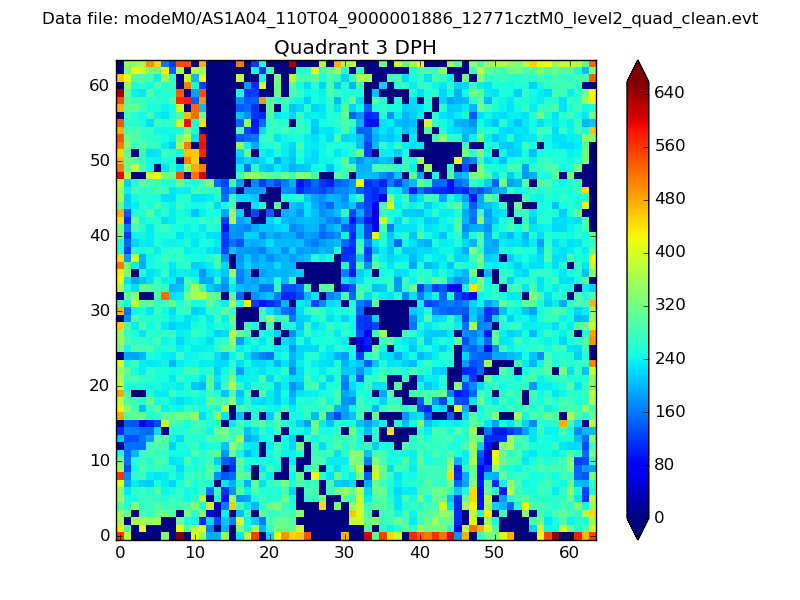 |
 |
Quadrant C |
| Plot type | Count rate plots | Images |
|---|---|---|
| Comparison with Poisson distribution Blue bars denote a histogram of data divided into 1 sec bins. Red curve is a Poisson curve with rate = median count rate of data. |
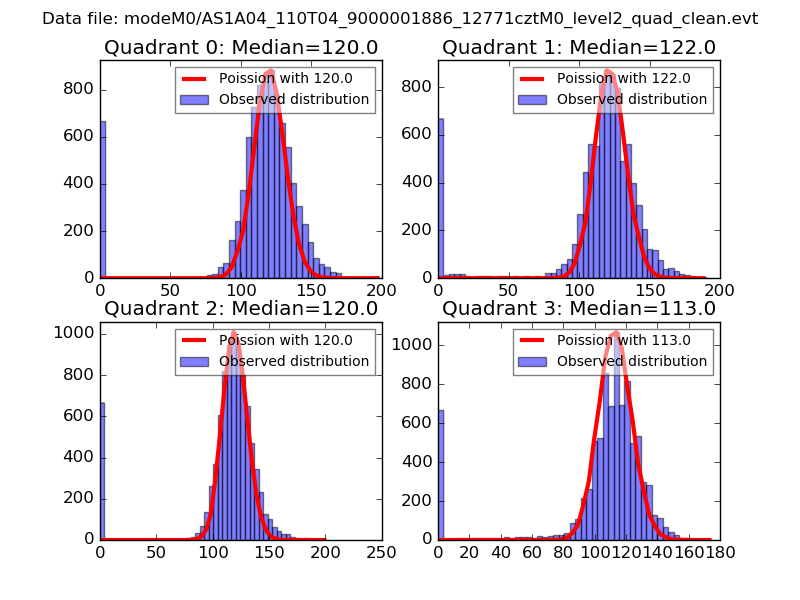 |
 |
| Quadrant-wise count rates Data is divided into 100 sec bins |
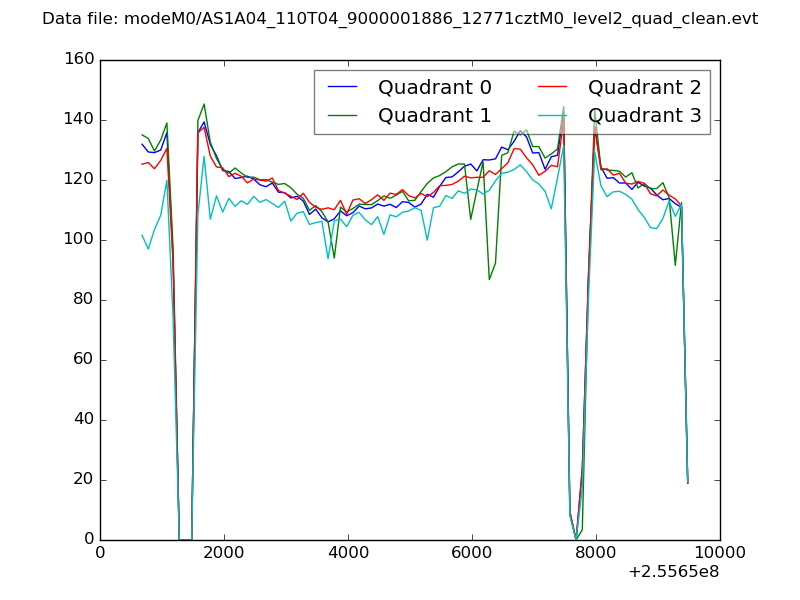 |
|
| Module-wise count rates for Quadrant A Data is divided into 100 sec bins |
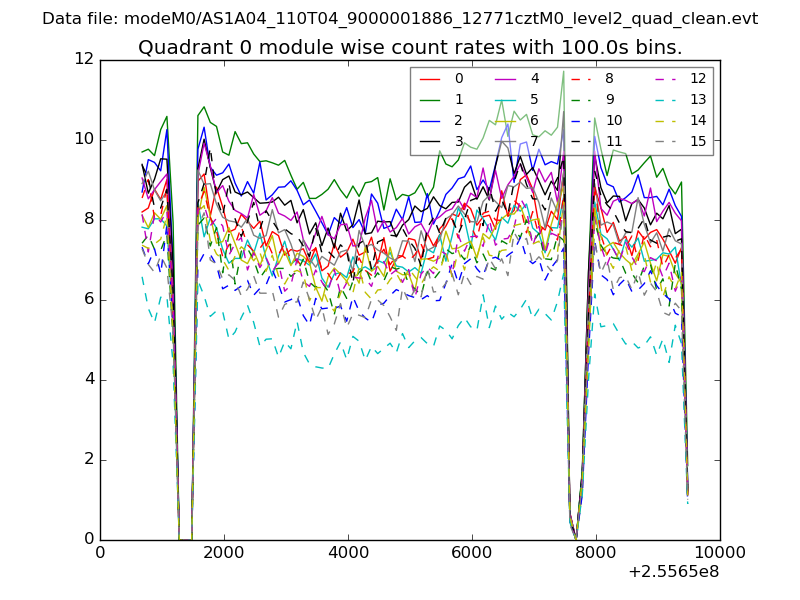 |
 |
| Module-wise count rates for Quadrant B Data is divided into 100 sec bins |
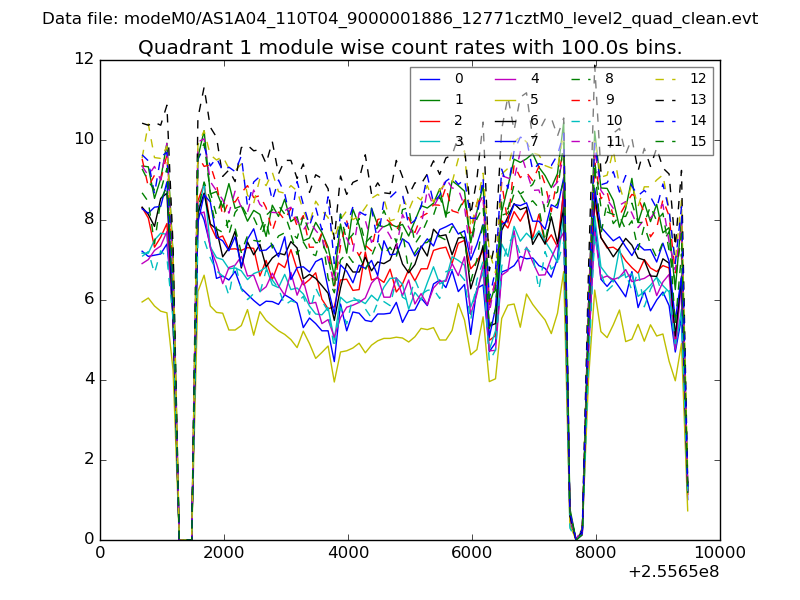 |
 |
| Module-wise count rates for Quadrant C Data is divided into 100 sec bins |
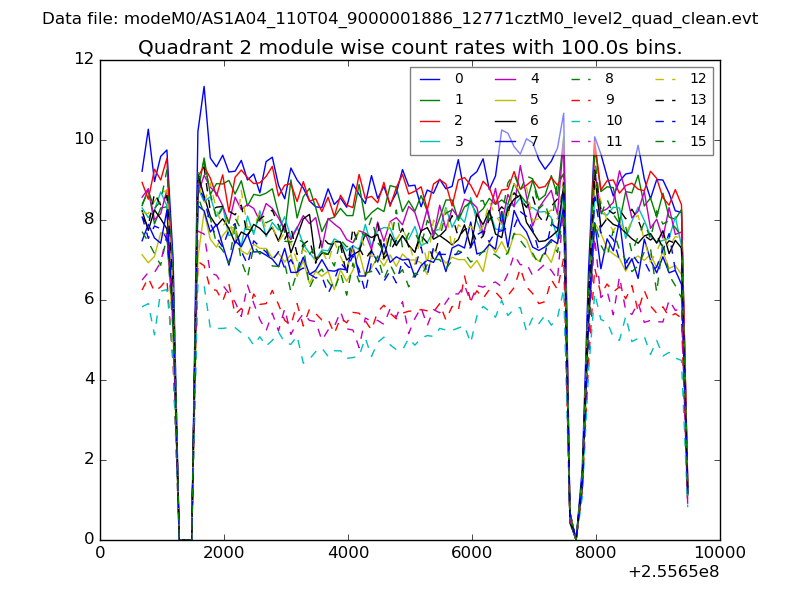 |
 |
| Module-wise count rates for Quadrant D Data is divided into 100 sec bins |
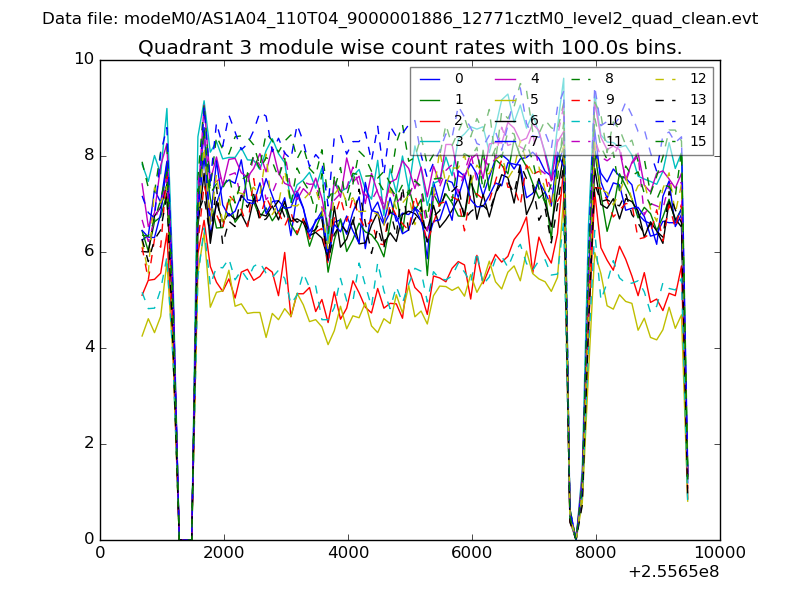 |
 |
| Parameter | Plot |
|---|---|
| CZT HV Monitor | 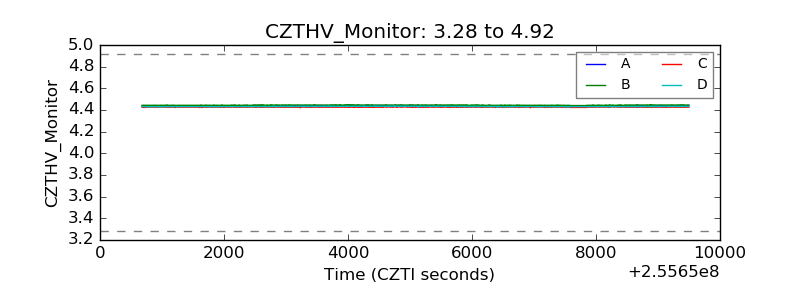 |
| D_VDD | 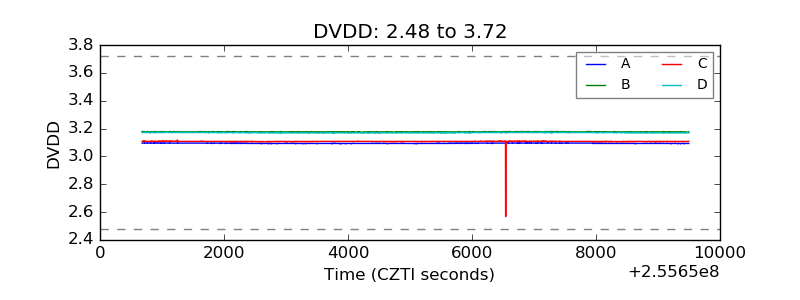 |
| Temperature 1 | 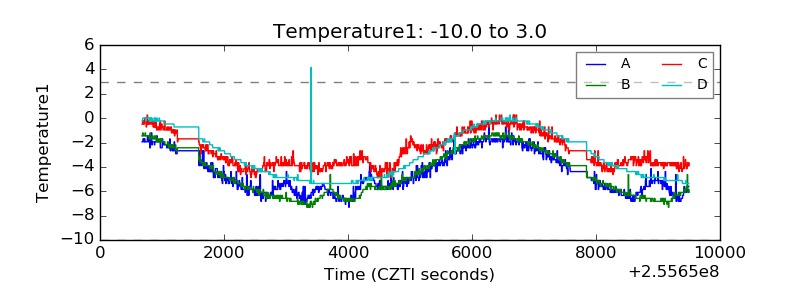 |
| Veto HV Monitor |  |
| Veto LLD | 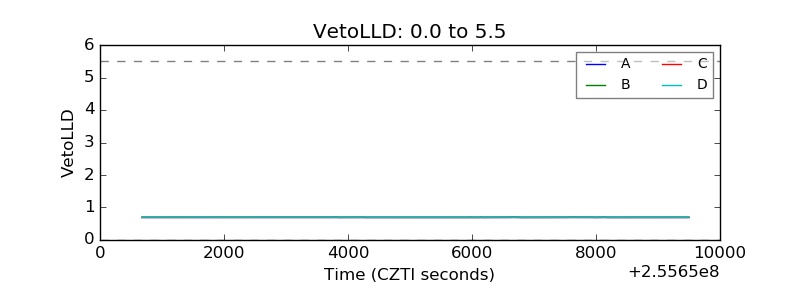 |
| Alpha Counter | 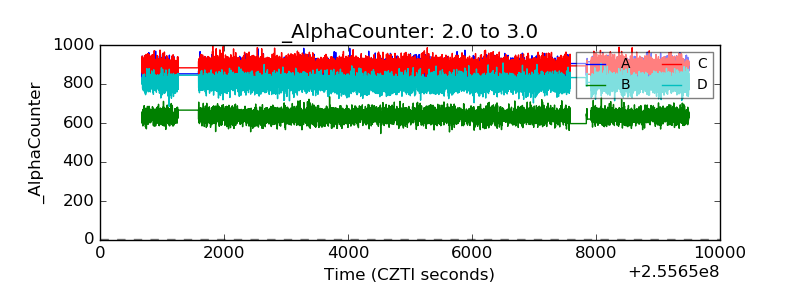 |
| _CPM_Rate | 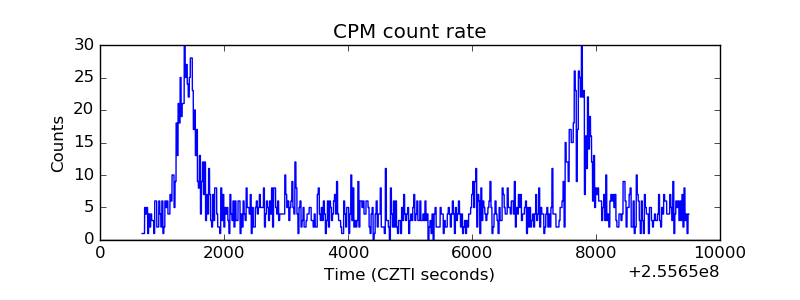 |
| CZT Counter | 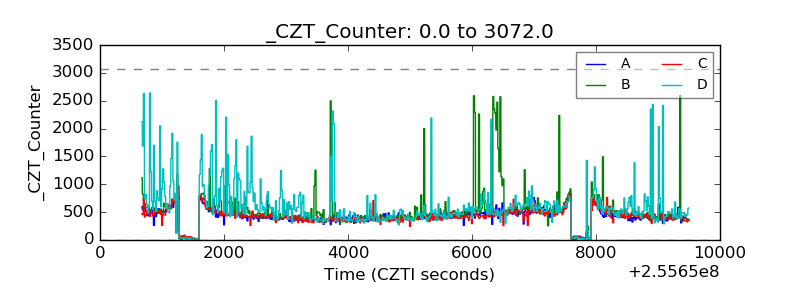 |
| +2.5 Volts monitor |  |
| +5 Volts monitor |  |
| _ROLL_ROT | 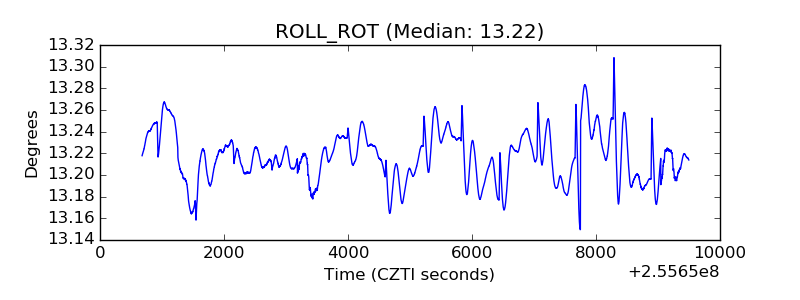 |
| _Roll_DEC | 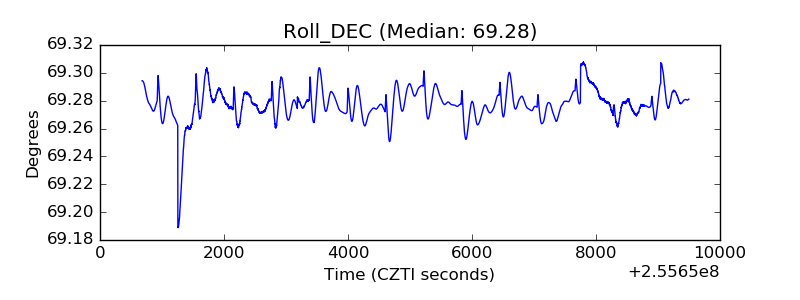 |
| _Roll_RA |  |
| Veto Counter | 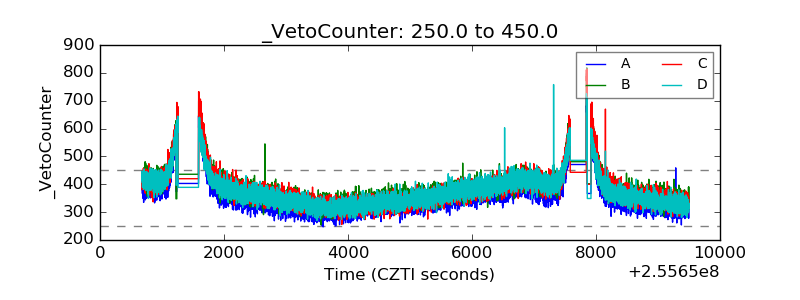 |