| Param | Original file | Final file |
|---|---|---|
| Filename | modeM0/AS1A04_110T04_9000001886_12774cztM0_level2.evt | modeM0/AS1A04_110T04_9000001886_12774cztM0_level2_quad_clean.evt |
| Size (bytes) | 1,331,343,360 | 344,200,320 |
| Size | 1.2 GB | 328.3 MB |
| Events in quadrant A | 8,914,934 | 2,302,321 |
| Events in quadrant B | 10,634,782 | 2,304,072 |
| Events in quadrant C | 8,590,520 | 2,297,765 |
| Events in quadrant D | 10,867,902 | 2,185,916 |
| Mode SS | |||
|---|---|---|---|
| Quadrant | BADHDUFLAG | Total packets | Discarded packets |
| A | 0 | 396 | 0 |
| B | 0 | 396 | 0 |
| C | 0 | 396 | 0 |
| D | 0 | 396 | 0 |
| Mode M0 | |||
|---|---|---|---|
| Quadrant | BADHDUFLAG | Total packets | Discarded packets |
| A | 0 | 39983 | 5 |
| B | 0 | 44651 | 4 |
| C | 0 | 39781 | 4 |
| D | 0 | 45981 | 4 |
| Mode M9 | |||
|---|---|---|---|
| Quadrant | BADHDUFLAG | Total packets | Discarded packets |
| A | 0 | 23 | 0 |
| B | 0 | 23 | 0 |
| C | 0 | 23 | 0 |
| D | 0 | 23 | 0 |
| Quadrant | Total seconds | Saturated seconds | Saturation percentage |
|---|---|---|---|
| A | 19403 | 82 | 0.422615% |
| B | 19403 | 679 | 3.499459% |
| C | 19403 | 63 | 0.324692% |
| D | 19403 | 465 | 2.396537% |
Noise dominated data is calculated using 1-second bins in cleaned event files. If a bin has >2000 counts, and if more than 50% of those come from <1% of pixels, then it is considered to be noise-dominated and hence unusable.
| Quadrant | # 1 sec bins | Bins with >0 counts | Bins with >2000 counts | High rate bins dominated by noise | Noise dominated (total time) | Noise dominated (detector-on time) | Marked lightcurve |
|---|---|---|---|---|---|---|---|
| A | 21579 | 19409 | 1 | 1 | 0.00% | 0.01% | 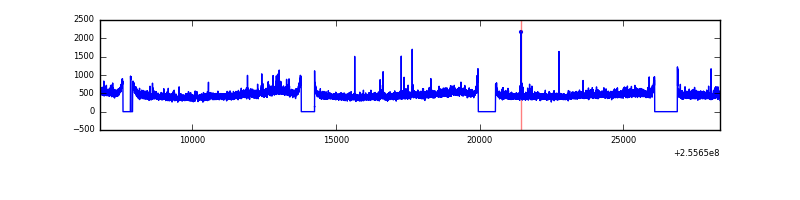 |
| B | 21579 | 19409 | 361 | 361 | 1.67% | 1.86% | 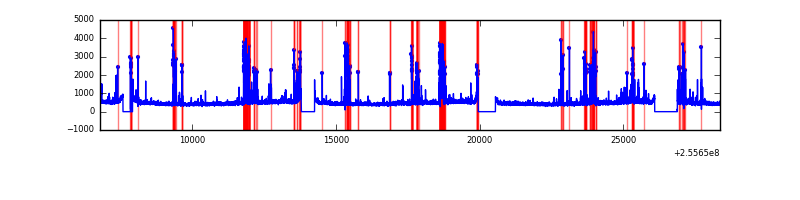 |
| C | 21579 | 19409 | 7 | 7 | 0.03% | 0.04% |  |
| D | 21579 | 19409 | 345 | 345 | 1.60% | 1.78% | 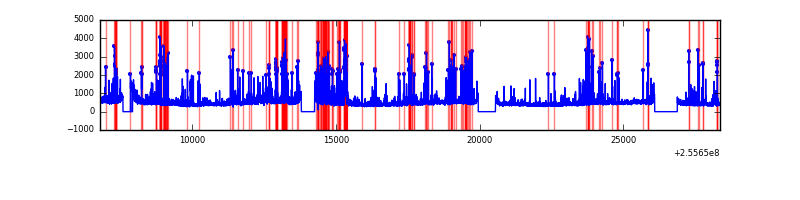 |
Top three noisy pixels from each quadrant. If the there are fewer than three noisy pixels in the level2.evt file, extra rows are filled as -1
| Pixel properties | Quadrant properties | ||||||
|---|---|---|---|---|---|---|---|
| Quadrant | DetID | PixID | Counts | Sigma | Mean | Median | Sigma |
| A | 12 | 189 | 147062 | 323.23 | 2222 | 2172 | 448.3 |
| A | 8 | 15 | 136444 | 299.55 | 2222 | 2172 | 448.3 |
| A | 8 | 6 | 52222 | 111.66 | 2222 | 2172 | 448.3 |
| B | 4 | 239 | 1626615 | 3923.1 | 2196 | 2138 | 414.1 |
| B | 3 | 64 | 95507 | 225.49 | 2196 | 2138 | 414.1 |
| B | 0 | 219 | 92551 | 218.35 | 2196 | 2138 | 414.1 |
| C | 15 | 208 | 179595 | 358.24 | 2156 | 2161 | 495.3 |
| C | 13 | 61 | 15885 | 27.71 | 2156 | 2161 | 495.3 |
| C | 8 | 222 | 6228 | 8.21 | 2156 | 2161 | 495.3 |
| D | 1 | 52 | 1680866 | 3293.82 | 2132 | 2066 | 509.7 |
| D | 8 | 195 | 435555 | 850.51 | 2132 | 2066 | 509.7 |
| D | 13 | 104 | 219398 | 426.41 | 2132 | 2066 | 509.7 |
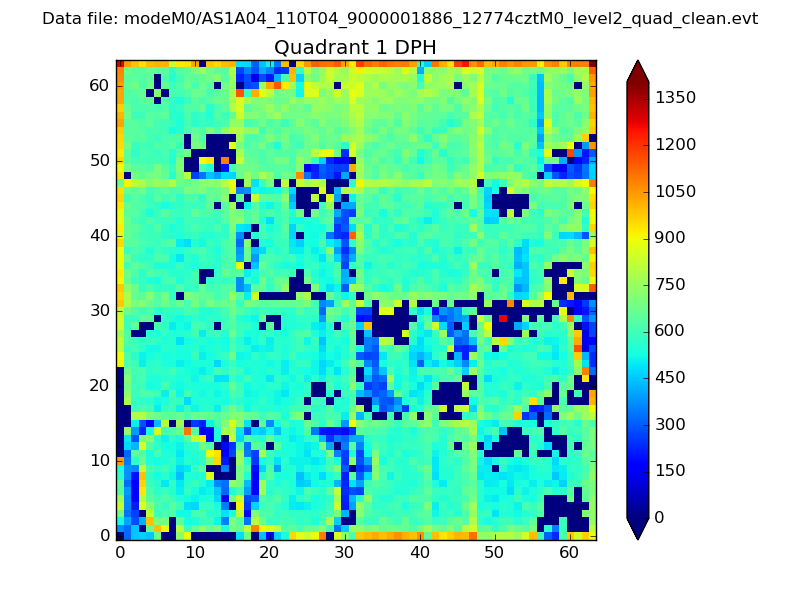
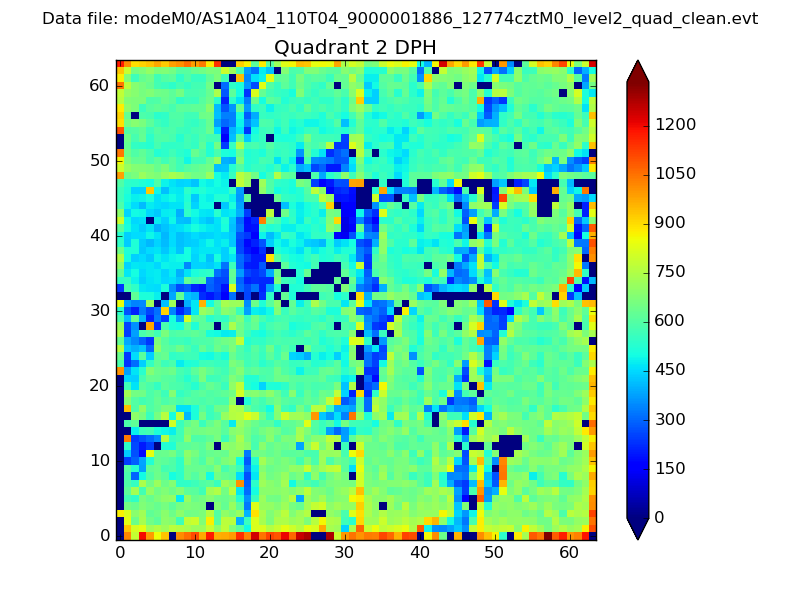
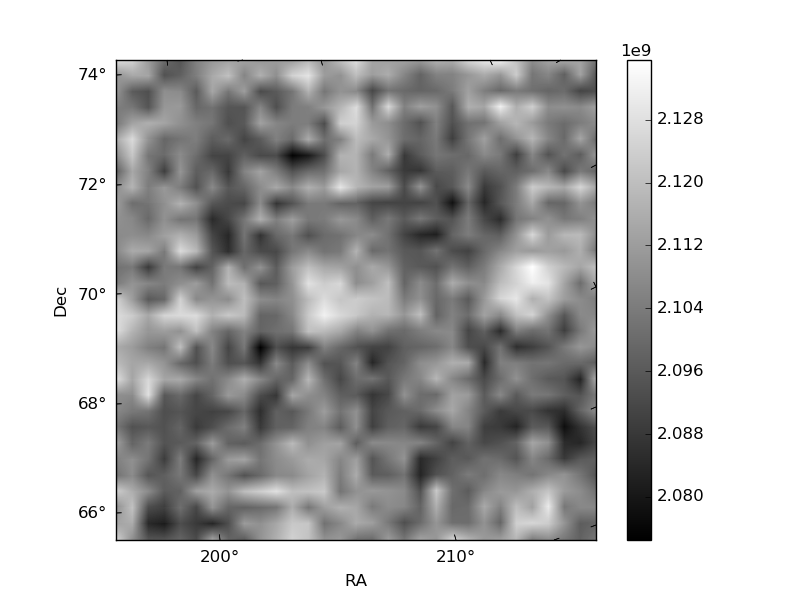
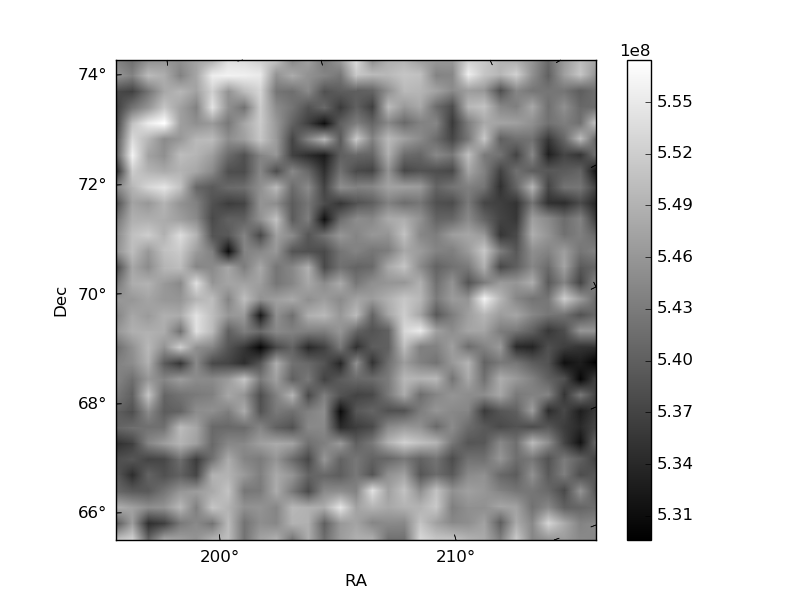
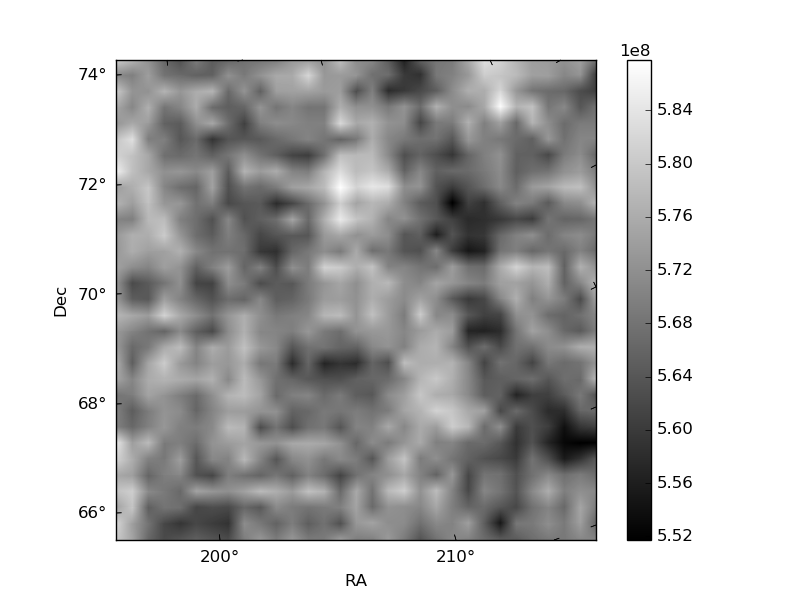
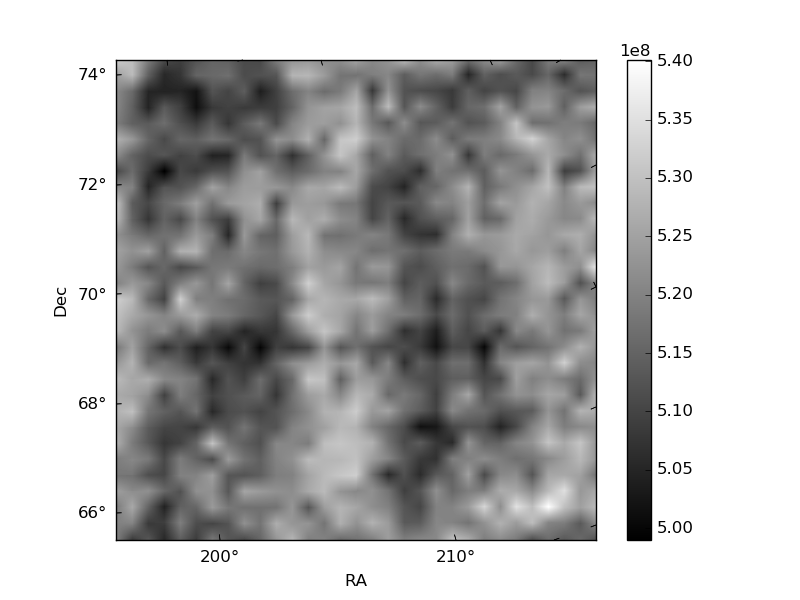
Histogram calculated using DETX and DETY for each event in the final _common_clean file
| Quadrant A | 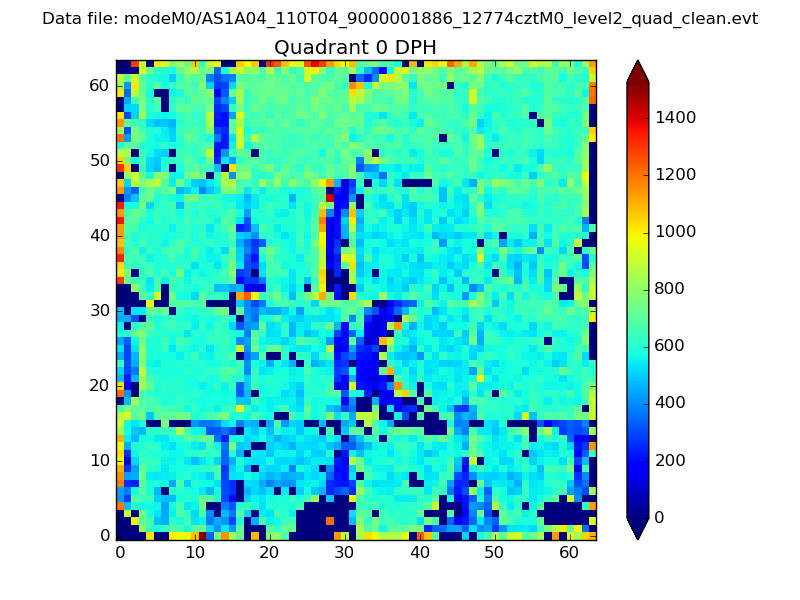 |
 |
Quadrant B |
|---|---|---|---|
| Quadrant D | 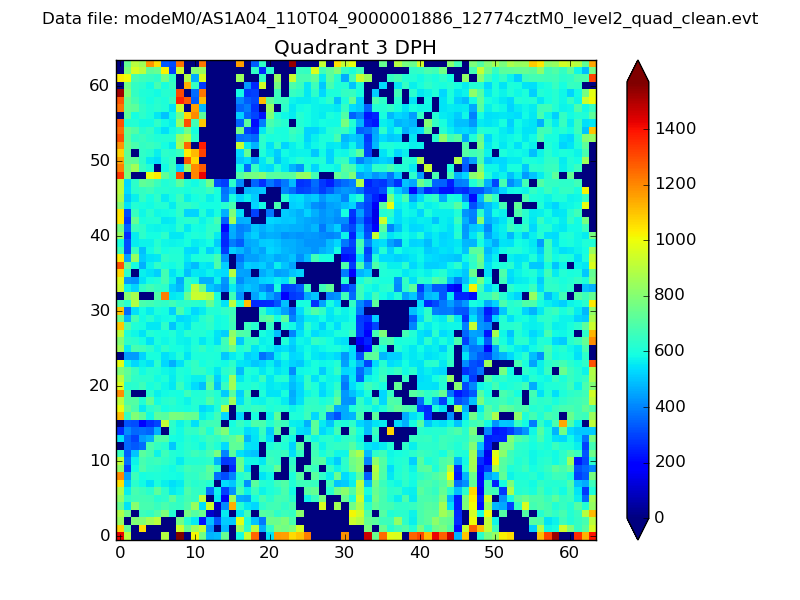 |
 |
Quadrant C |
| Plot type | Count rate plots | Images |
|---|---|---|
| Comparison with Poisson distribution Blue bars denote a histogram of data divided into 1 sec bins. Red curve is a Poisson curve with rate = median count rate of data. |
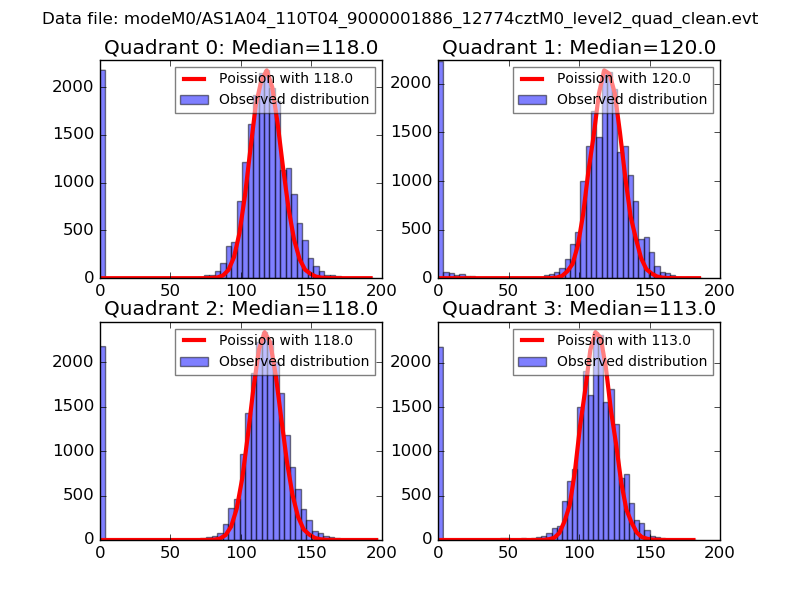 |
 |
| Quadrant-wise count rates Data is divided into 100 sec bins |
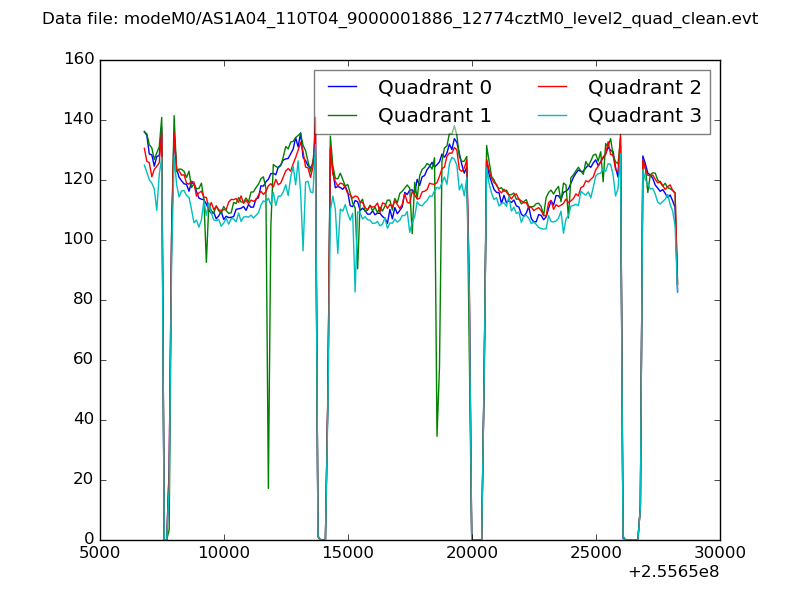 |
|
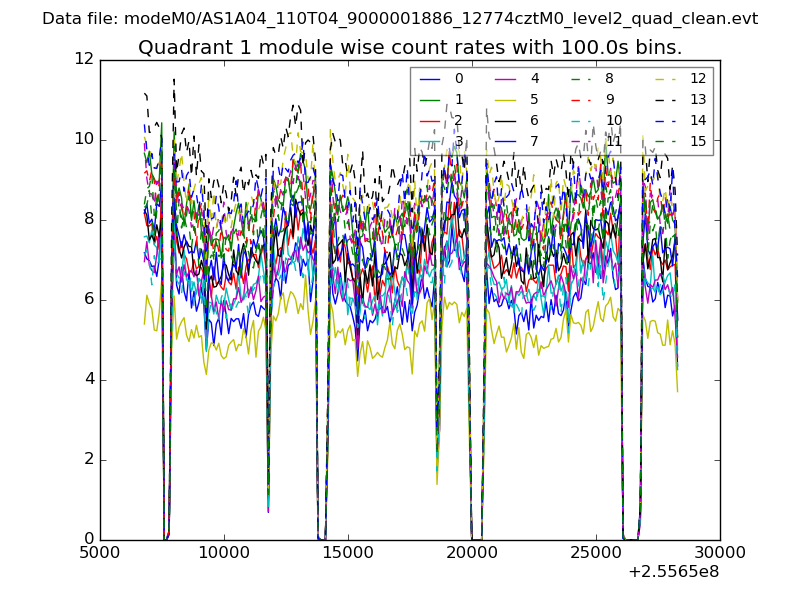
| Module-wise count rates for Quadrant A Data is divided into 100 sec bins |
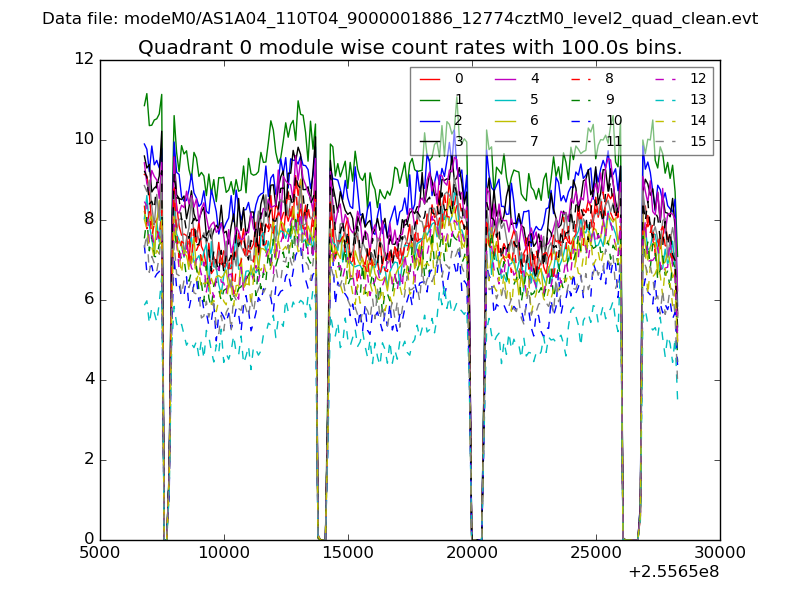 |
 |
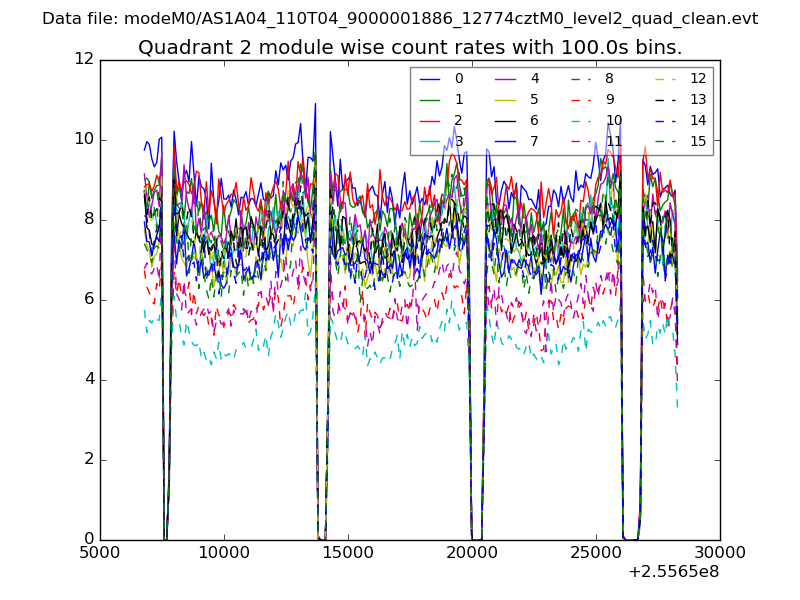
| Module-wise count rates for Quadrant B Data is divided into 100 sec bins |
 |
 |
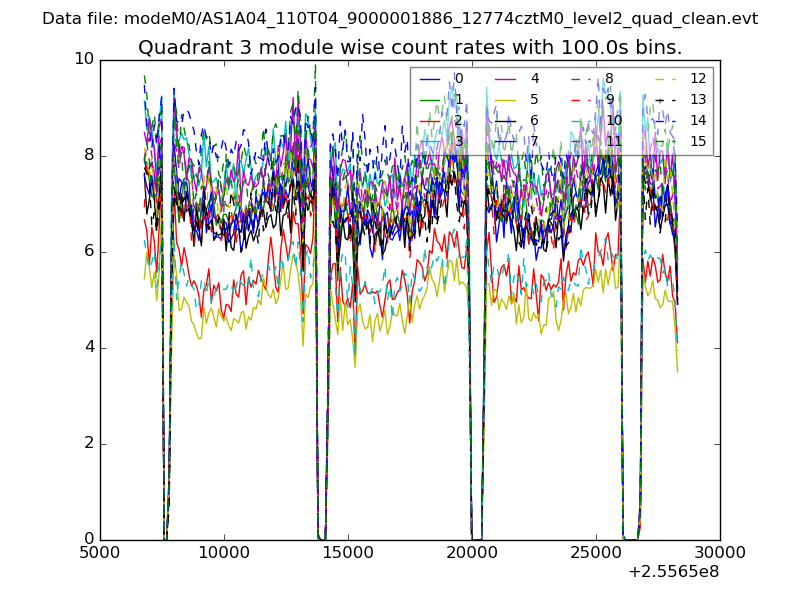
| Module-wise count rates for Quadrant C Data is divided into 100 sec bins |
 |
 |
| Module-wise count rates for Quadrant D Data is divided into 100 sec bins |
 |
 |
| Parameter | Plot |
|---|---|
| CZT HV Monitor | 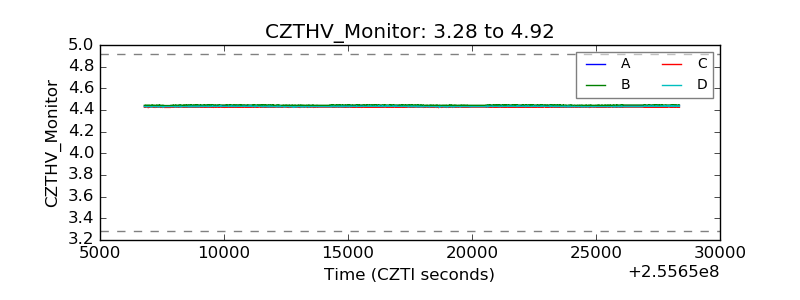 |
| D_VDD | 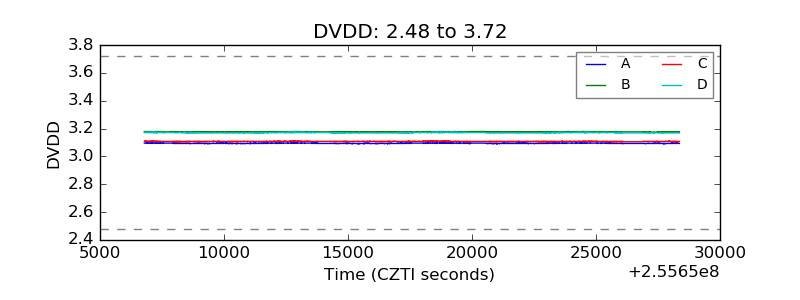 |
| Temperature 1 | 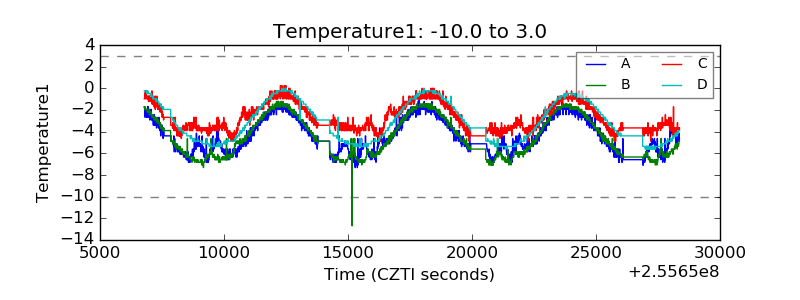 |
| Veto HV Monitor | 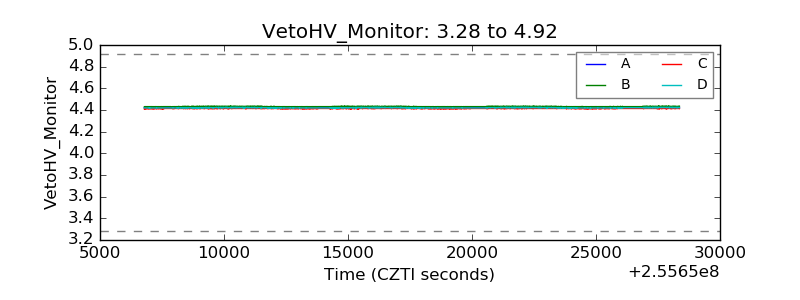 |
| Veto LLD | 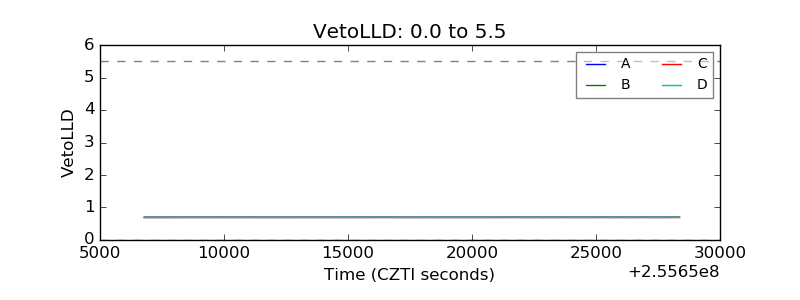 |
| Alpha Counter | 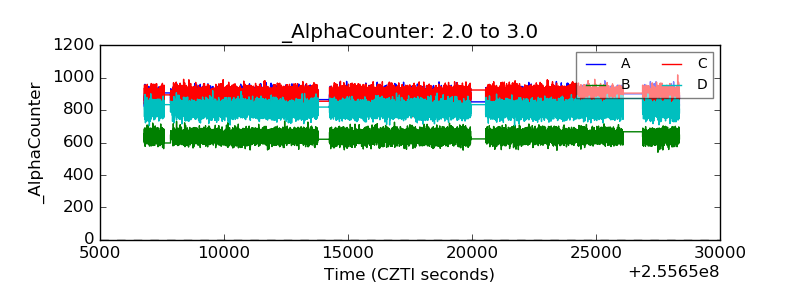 |
| _CPM_Rate | 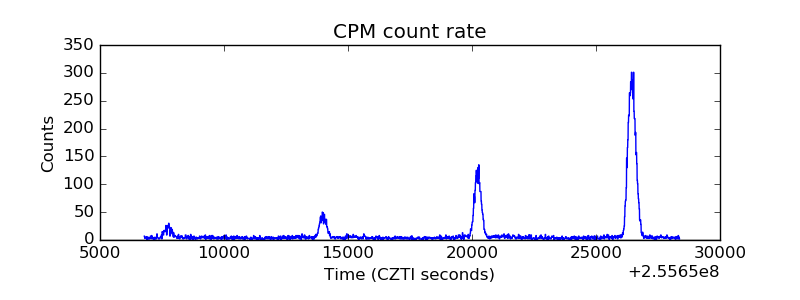 |
| CZT Counter | 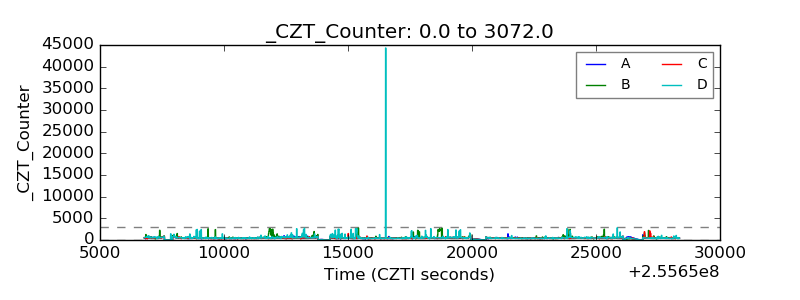 |
| +2.5 Volts monitor |  |
| +5 Volts monitor |  |
| _ROLL_ROT | 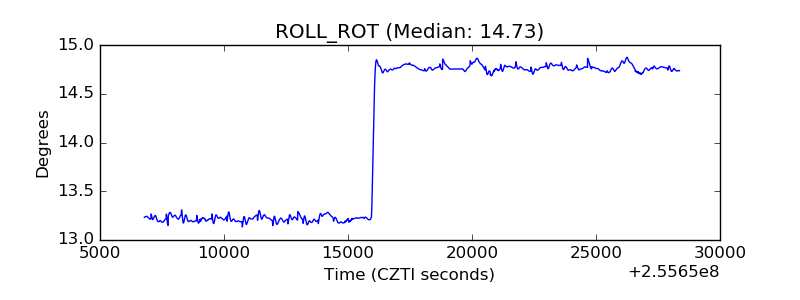 |
| _Roll_DEC | 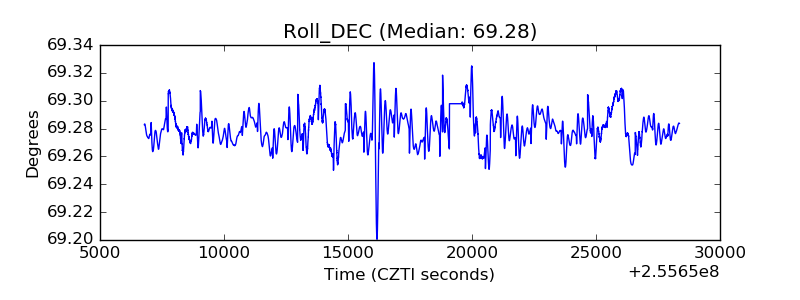 |
| _Roll_RA | 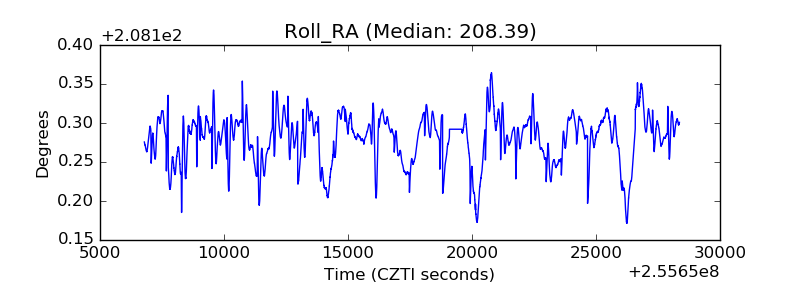 |
| Veto Counter | 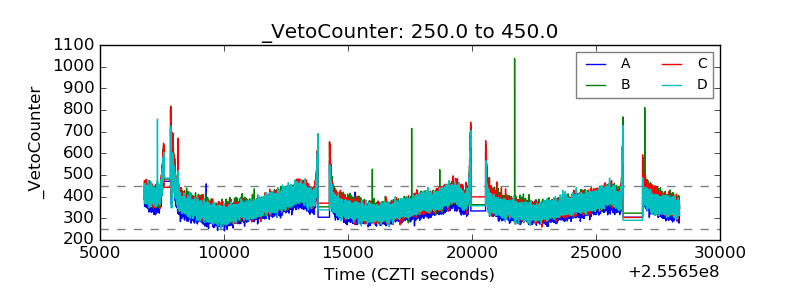 |