| Param | Original file | Final file |
|---|---|---|
| Filename | modeM0/AS1A04_110T04_9000001886_12775cztM0_level2.evt | modeM0/AS1A04_110T04_9000001886_12775cztM0_level2_quad_clean.evt |
| Size (bytes) | 496,405,440 | 107,444,160 |
| Size | 473.4 MB | 102.5 MB |
| Events in quadrant A | 3,211,727 | 725,131 |
| Events in quadrant B | 3,267,105 | 736,064 |
| Events in quadrant C | 2,820,739 | 722,236 |
| Events in quadrant D | 5,322,064 | 646,432 |
| Mode SS | |||
|---|---|---|---|
| Quadrant | BADHDUFLAG | Total packets | Discarded packets |
| A | 0 | 124 | 0 |
| B | 0 | 124 | 0 |
| C | 0 | 124 | 0 |
| D | 0 | 124 | 0 |
| Mode M0 | |||
|---|---|---|---|
| Quadrant | BADHDUFLAG | Total packets | Discarded packets |
| A | 0 | 13575 | 2 |
| B | 0 | 13630 | 1 |
| C | 0 | 12754 | 1 |
| D | 0 | 19980 | 1 |
| Mode M9 | |||
|---|---|---|---|
| Quadrant | BADHDUFLAG | Total packets | Discarded packets |
| A | 0 | 9 | 0 |
| B | 0 | 9 | 0 |
| C | 0 | 9 | 0 |
| D | 0 | 9 | 0 |
| Quadrant | Total seconds | Saturated seconds | Saturation percentage |
|---|---|---|---|
| A | 6067 | 54 | 0.890061% |
| B | 6067 | 166 | 2.736113% |
| C | 6067 | 28 | 0.461513% |
| D | 6067 | 732 | 12.065271% |
Noise dominated data is calculated using 1-second bins in cleaned event files. If a bin has >2000 counts, and if more than 50% of those come from <1% of pixels, then it is considered to be noise-dominated and hence unusable.
| Quadrant | # 1 sec bins | Bins with >0 counts | Bins with >2000 counts | High rate bins dominated by noise | Noise dominated (total time) | Noise dominated (detector-on time) | Marked lightcurve |
|---|---|---|---|---|---|---|---|
| A | 6998 | 6069 | 34 | 34 | 0.49% | 0.56% | 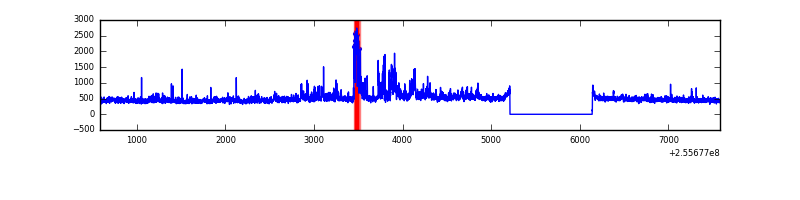 |
| B | 6998 | 6069 | 96 | 96 | 1.37% | 1.58% | 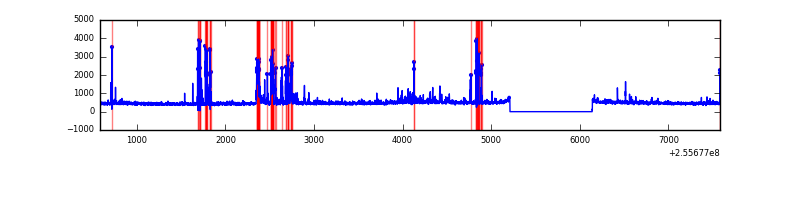 |
| C | 6998 | 6069 | 16 | 16 | 0.23% | 0.26% | 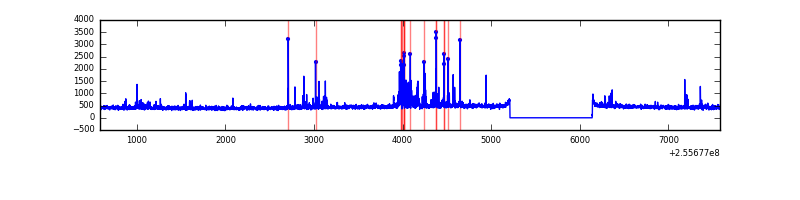 |
| D | 6998 | 6069 | 692 | 692 | 9.89% | 11.40% | 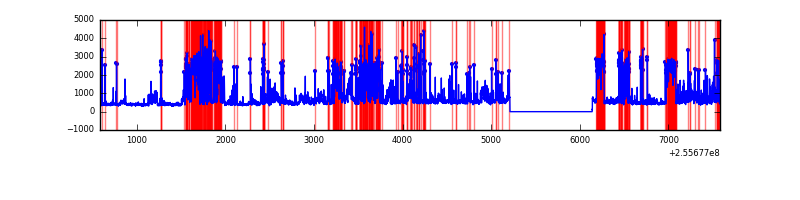 |
Top three noisy pixels from each quadrant. If the there are fewer than three noisy pixels in the level2.evt file, extra rows are filled as -1
| Pixel properties | Quadrant properties | ||||||
|---|---|---|---|---|---|---|---|
| Quadrant | DetID | PixID | Counts | Sigma | Mean | Median | Sigma |
| A | 8 | 15 | 375022 | 2668.82 | 693 | 678 | 140.3 |
| A | 12 | 189 | 126093 | 894.12 | 693 | 678 | 140.3 |
| A | 8 | 6 | 27478 | 191.07 | 693 | 678 | 140.3 |
| B | 4 | 239 | 408988 | 3117.12 | 688 | 669 | 131.0 |
| B | 3 | 64 | 77405 | 585.81 | 688 | 669 | 131.0 |
| B | 0 | 219 | 23696 | 175.79 | 688 | 669 | 131.0 |
| C | 15 | 208 | 221070 | 1437.99 | 666 | 668 | 153.3 |
| C | 13 | 61 | 4813 | 27.04 | 666 | 668 | 153.3 |
| C | 14 | 234 | 3251 | 16.85 | 666 | 668 | 153.3 |
| D | 1 | 52 | 2443284 | 16131.77 | 631 | 612 | 151.4 |
| D | 8 | 195 | 408793 | 2695.69 | 631 | 612 | 151.4 |
| D | 13 | 104 | 31238 | 202.26 | 631 | 612 | 151.4 |
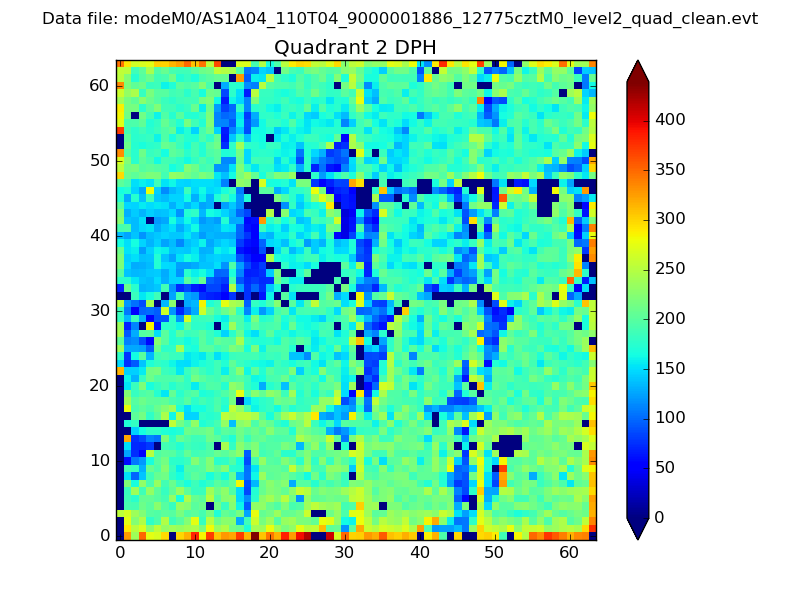
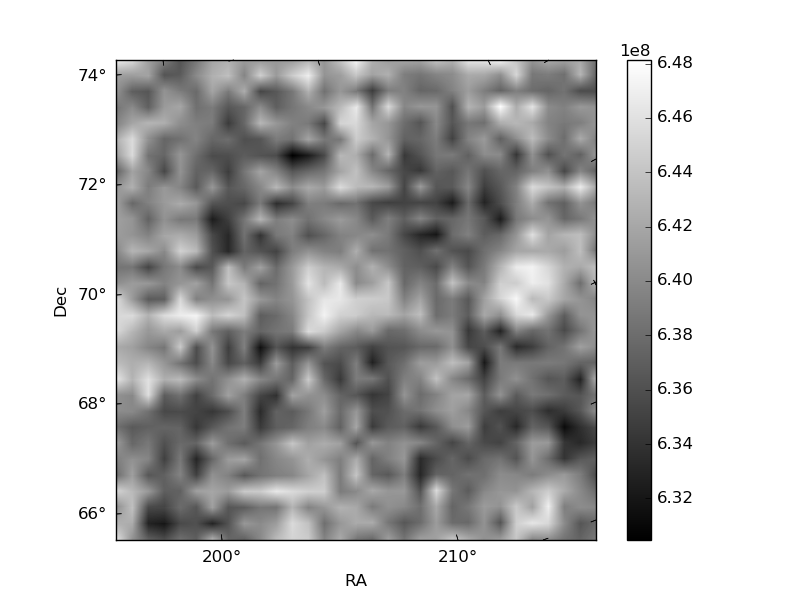
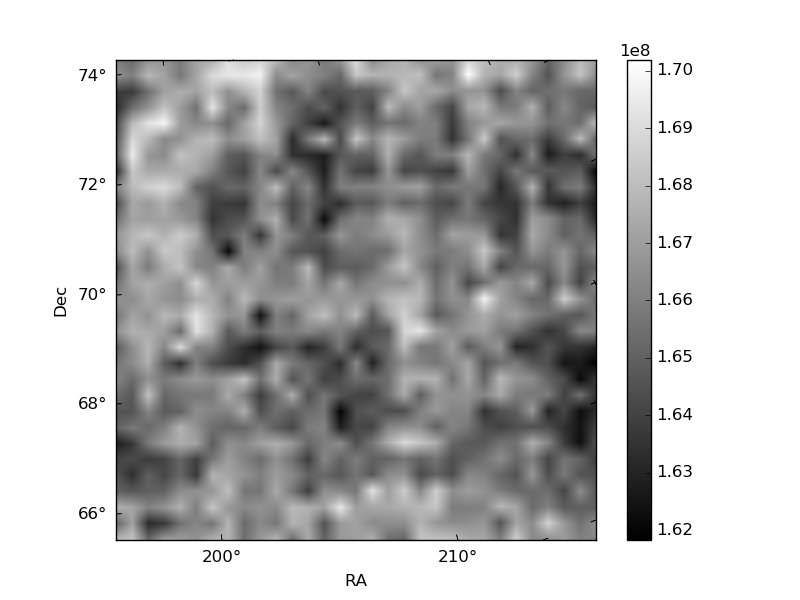
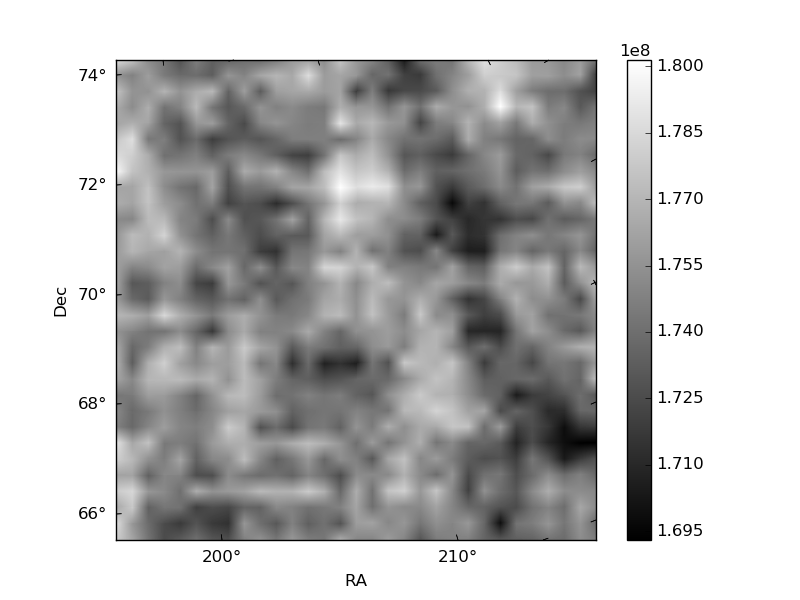
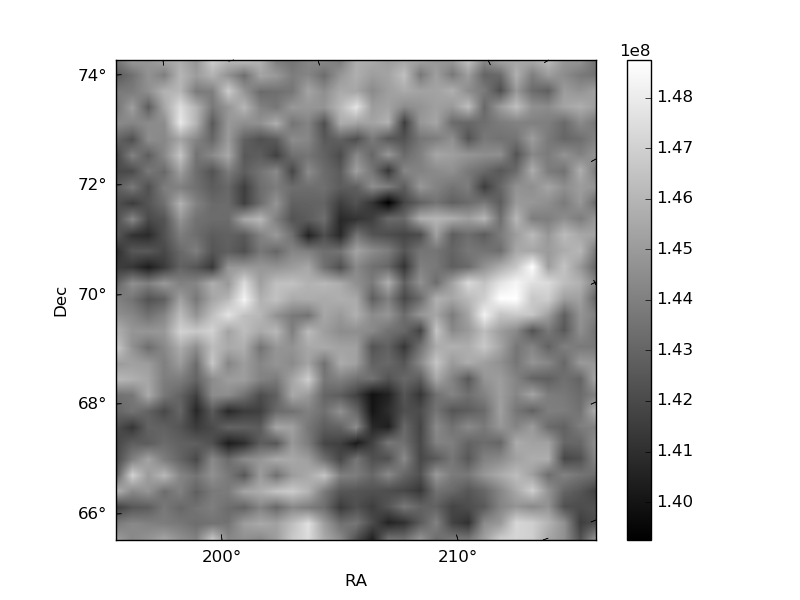
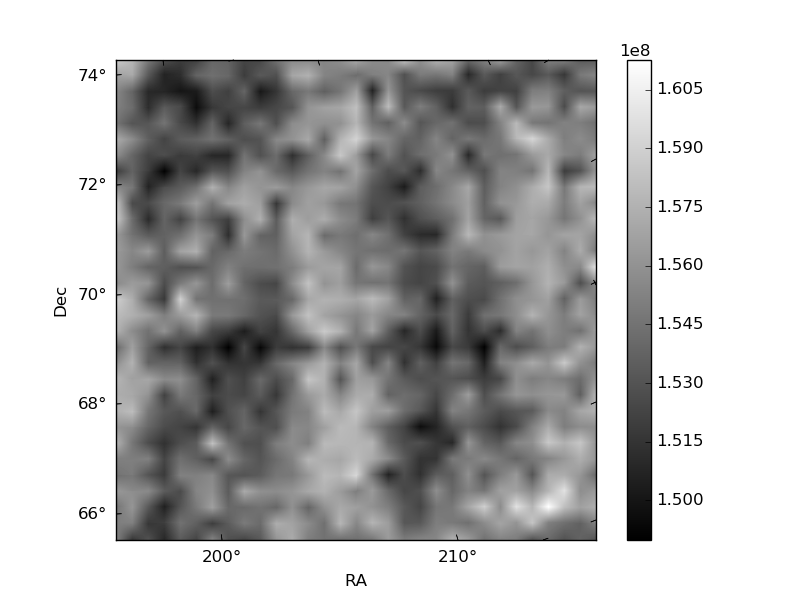
Histogram calculated using DETX and DETY for each event in the final _common_clean file
| Quadrant A | 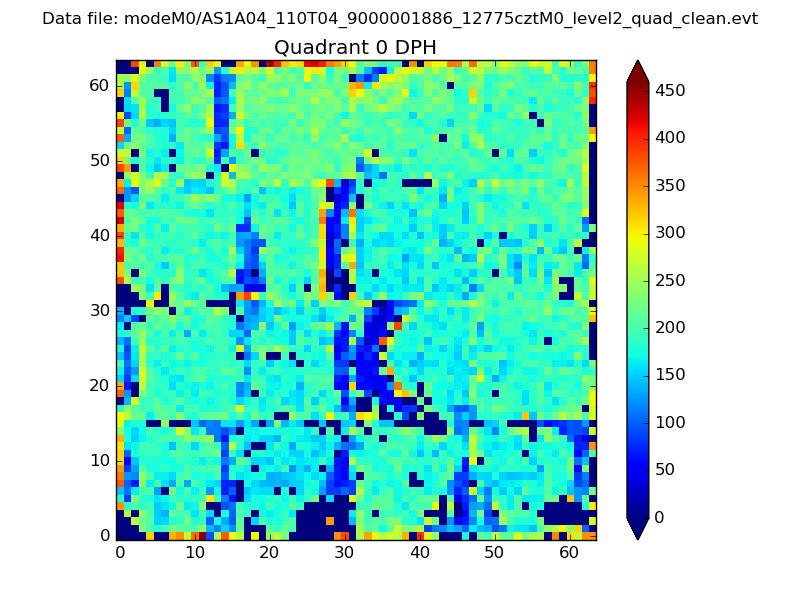 |
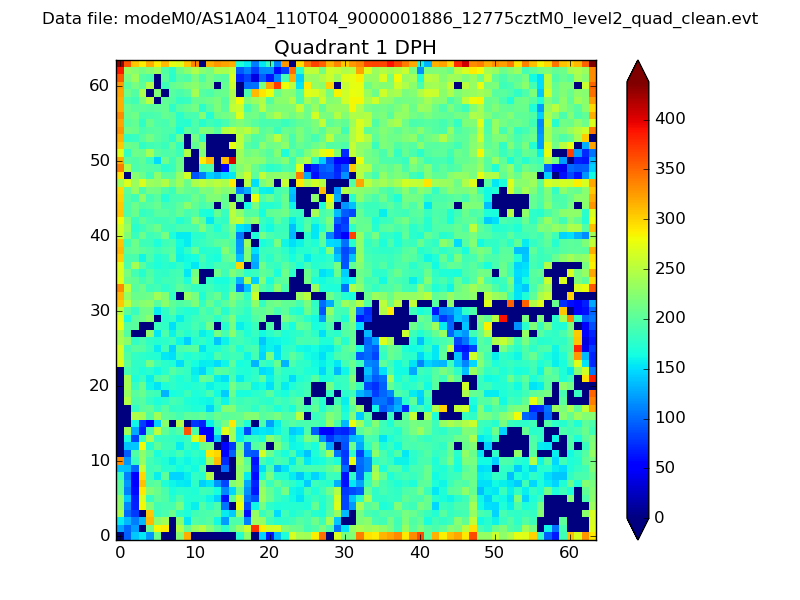 |
Quadrant B |
|---|---|---|---|
| Quadrant D | 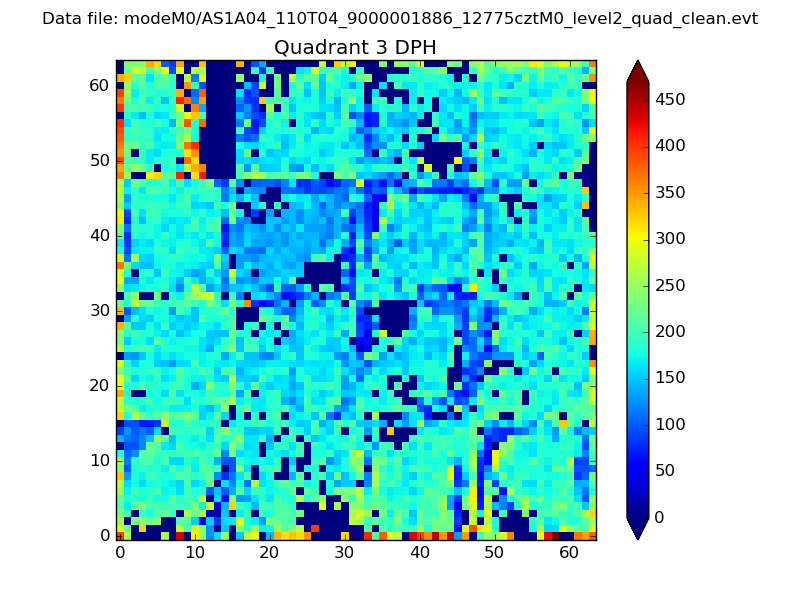 |
 |
Quadrant C |
| Plot type | Count rate plots | Images |
|---|---|---|
| Comparison with Poisson distribution Blue bars denote a histogram of data divided into 1 sec bins. Red curve is a Poisson curve with rate = median count rate of data. |
 |
 |
| Quadrant-wise count rates Data is divided into 100 sec bins |
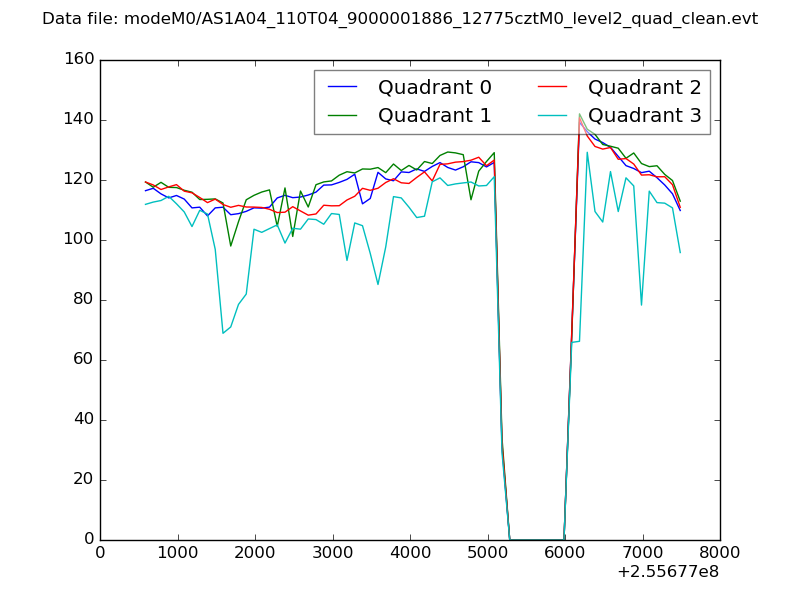 |
|
| Module-wise count rates for Quadrant A Data is divided into 100 sec bins |
 |
 |
| Module-wise count rates for Quadrant B Data is divided into 100 sec bins |
 |
 |
| Module-wise count rates for Quadrant C Data is divided into 100 sec bins |
 |
 |
| Module-wise count rates for Quadrant D Data is divided into 100 sec bins |
 |
 |
| Parameter | Plot |
|---|---|
| CZT HV Monitor | 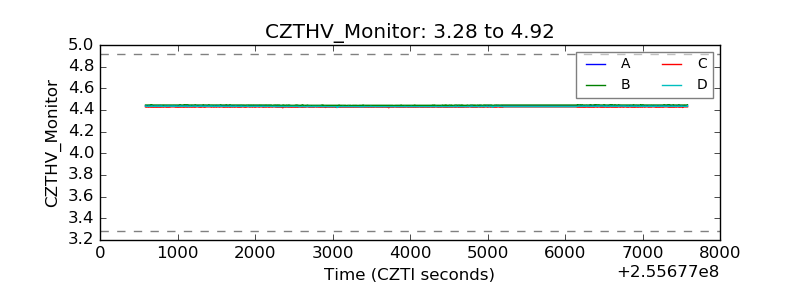 |
| D_VDD | 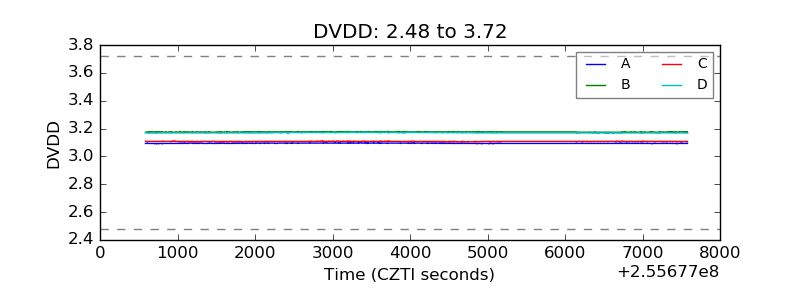 |
| Temperature 1 |  |
| Veto HV Monitor | 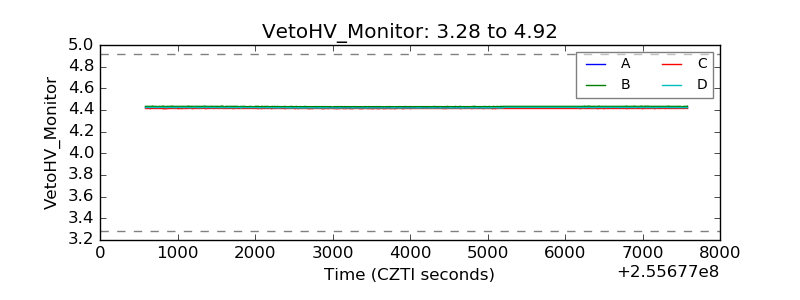 |
| Veto LLD | 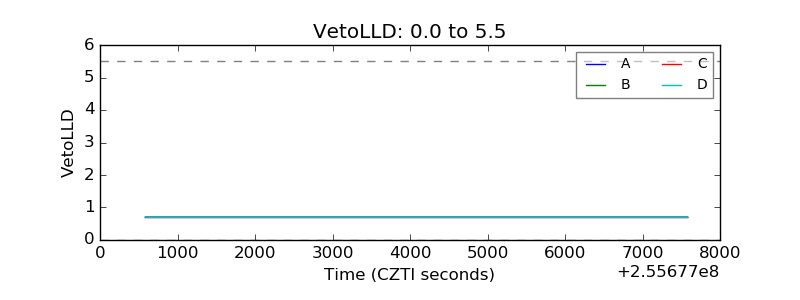 |
| Alpha Counter | 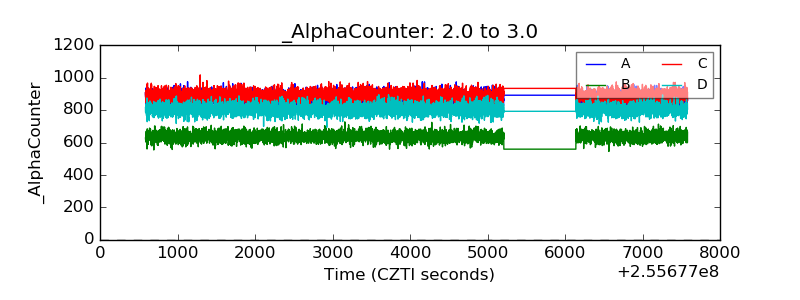 |
| _CPM_Rate | 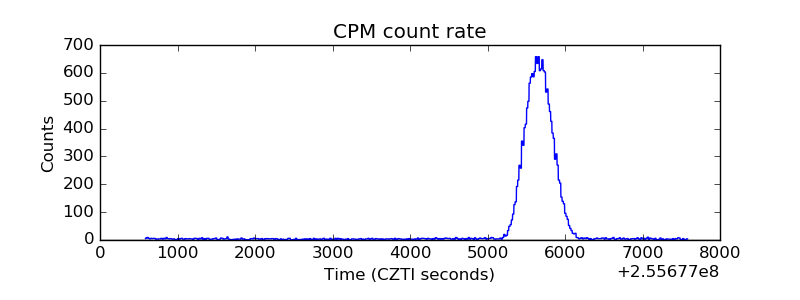 |
| CZT Counter | 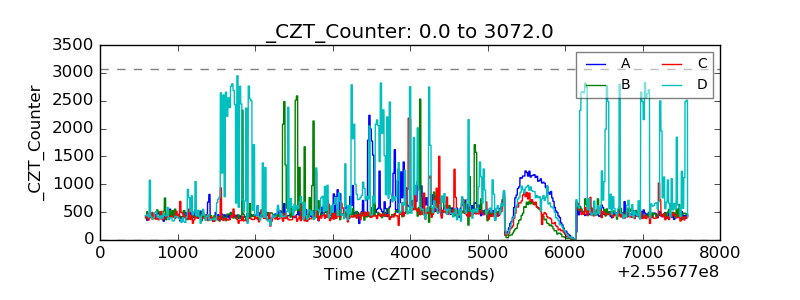 |
| +2.5 Volts monitor |  |
| +5 Volts monitor |  |
| _ROLL_ROT |  |
| _Roll_DEC |  |
| _Roll_RA | 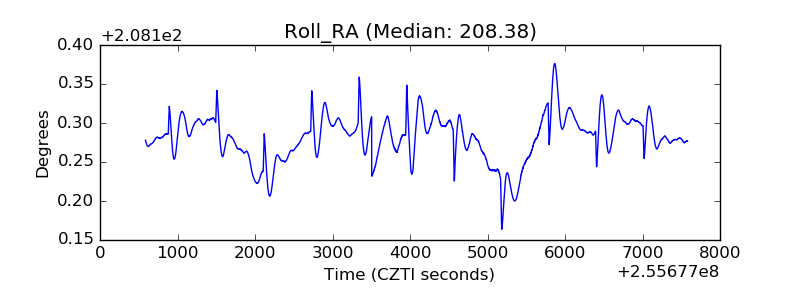 |
| Veto Counter | 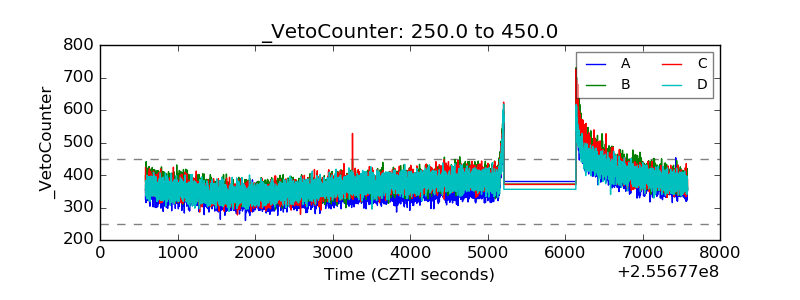 |