| Param | Original file | Final file |
|---|---|---|
| Filename | modeM0/AS1A04_110T04_9000001886_12779cztM0_level2.evt | modeM0/AS1A04_110T04_9000001886_12779cztM0_level2_quad_clean.evt |
| Size (bytes) | 859,734,720 | 211,400,640 |
| Size | 819.9 MB | 201.6 MB |
| Events in quadrant A | 5,977,336 | 1,453,763 |
| Events in quadrant B | 7,612,452 | 1,412,176 |
| Events in quadrant C | 5,144,208 | 1,427,474 |
| Events in quadrant D | 6,575,122 | 1,364,400 |
| Mode SS | |||
|---|---|---|---|
| Quadrant | BADHDUFLAG | Total packets | Discarded packets |
| A | 0 | 220 | 0 |
| B | 0 | 220 | 0 |
| C | 0 | 220 | 0 |
| D | 0 | 220 | 0 |
| Mode M0 | |||
|---|---|---|---|
| Quadrant | BADHDUFLAG | Total packets | Discarded packets |
| A | 0 | 24620 | 3 |
| B | 0 | 29490 | 2 |
| C | 0 | 22571 | 2 |
| D | 0 | 26523 | 2 |
| Mode M9 | |||
|---|---|---|---|
| Quadrant | BADHDUFLAG | Total packets | Discarded packets |
| A | 0 | 23 | 0 |
| B | 0 | 23 | 0 |
| C | 0 | 23 | 0 |
| D | 0 | 23 | 0 |
| Quadrant | Total seconds | Saturated seconds | Saturation percentage |
|---|---|---|---|
| A | 10761 | 191 | 1.774928% |
| B | 10761 | 881 | 8.186971% |
| C | 10761 | 88 | 0.817768% |
| D | 10761 | 228 | 2.118762% |
Noise dominated data is calculated using 1-second bins in cleaned event files. If a bin has >2000 counts, and if more than 50% of those come from <1% of pixels, then it is considered to be noise-dominated and hence unusable.
| Quadrant | # 1 sec bins | Bins with >0 counts | Bins with >2000 counts | High rate bins dominated by noise | Noise dominated (total time) | Noise dominated (detector-on time) | Marked lightcurve |
|---|---|---|---|---|---|---|---|
| A | 13171 | 10763 | 77 | 77 | 0.58% | 0.72% | 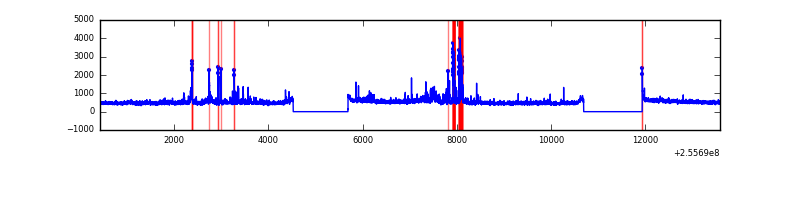 |
| B | 13171 | 10763 | 637 | 637 | 4.84% | 5.92% | 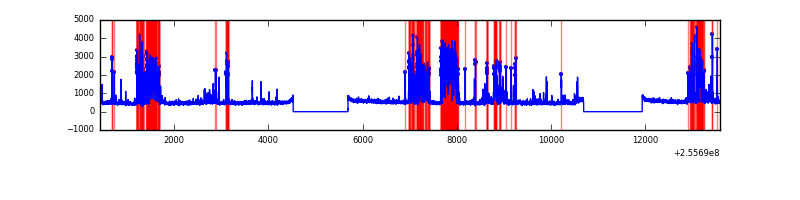 |
| C | 13171 | 10763 | 26 | 26 | 0.20% | 0.24% | 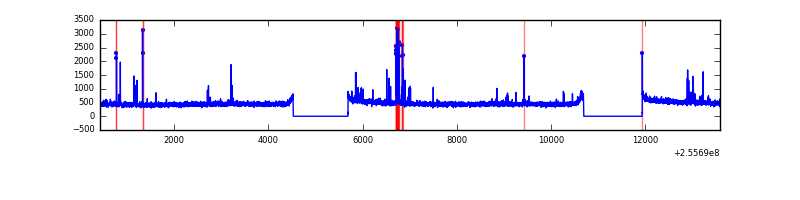 |
| D | 13171 | 10763 | 149 | 149 | 1.13% | 1.38% | 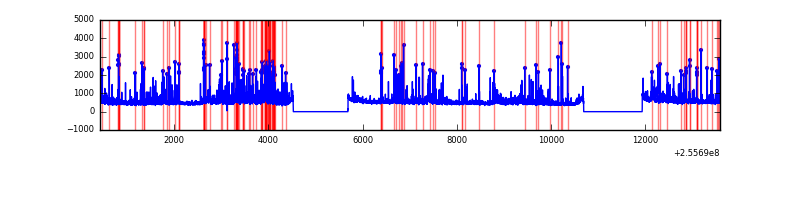 |
Top three noisy pixels from each quadrant. If the there are fewer than three noisy pixels in the level2.evt file, extra rows are filled as -1
| Pixel properties | Quadrant properties | ||||||
|---|---|---|---|---|---|---|---|
| Quadrant | DetID | PixID | Counts | Sigma | Mean | Median | Sigma |
| A | 8 | 15 | 519523 | 1985.25 | 1312 | 1285 | 261.0 |
| A | 15 | 222 | 200446 | 762.94 | 1312 | 1285 | 261.0 |
| A | 12 | 189 | 194909 | 741.73 | 1312 | 1285 | 261.0 |
| B | 4 | 239 | 2368810 | 10196.14 | 1261 | 1231 | 232.2 |
| B | 0 | 219 | 90676 | 385.2 | 1261 | 1231 | 232.2 |
| B | 3 | 64 | 71529 | 302.74 | 1261 | 1231 | 232.2 |
| C | 15 | 208 | 188533 | 653.89 | 1264 | 1272 | 286.4 |
| C | 14 | 234 | 25410 | 84.29 | 1264 | 1272 | 286.4 |
| C | 13 | 61 | 9247 | 27.85 | 1264 | 1272 | 286.4 |
| D | 1 | 52 | 1225901 | 4052.5 | 1267 | 1231 | 302.2 |
| D | 8 | 195 | 304659 | 1004.06 | 1267 | 1231 | 302.2 |
| D | 2 | 136 | 170975 | 561.69 | 1267 | 1231 | 302.2 |
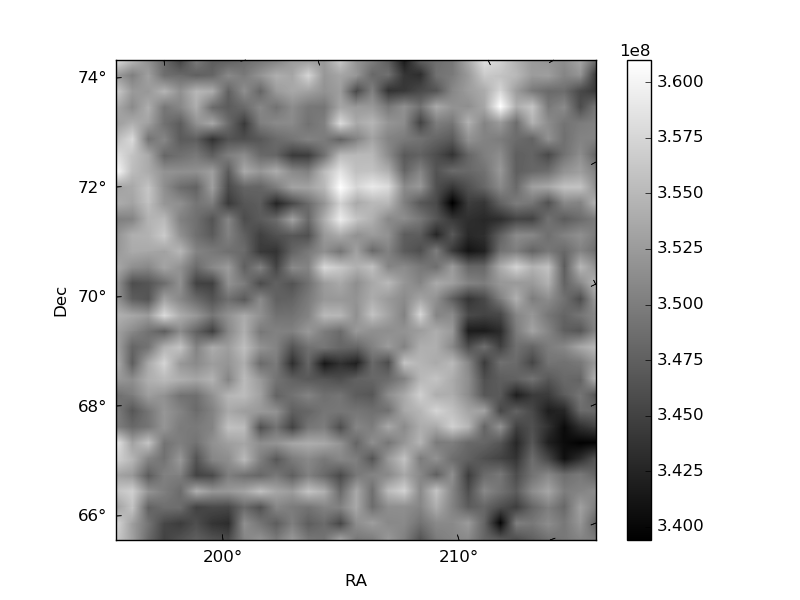
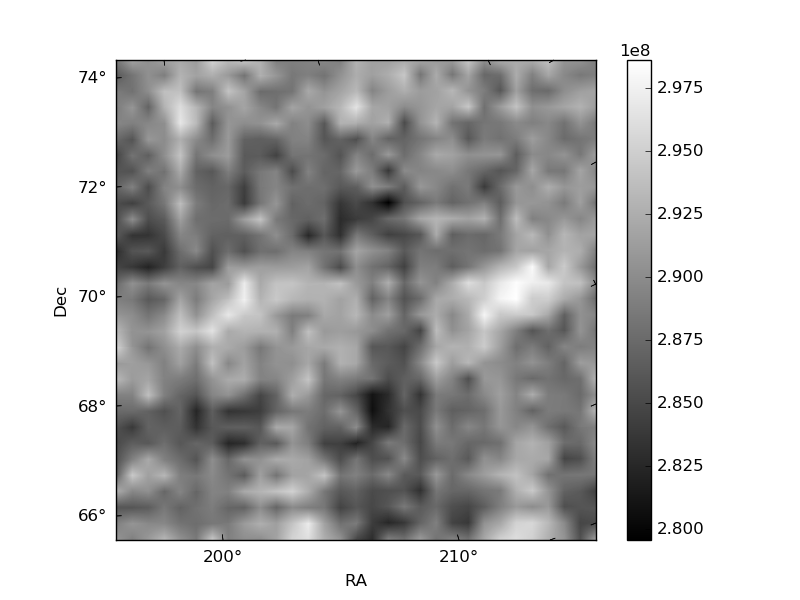
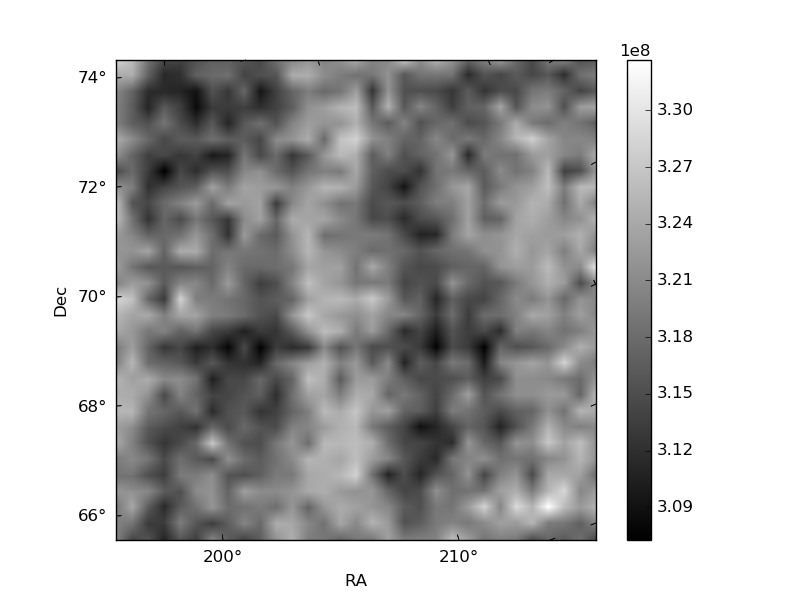
Histogram calculated using DETX and DETY for each event in the final _common_clean file
| Quadrant A | 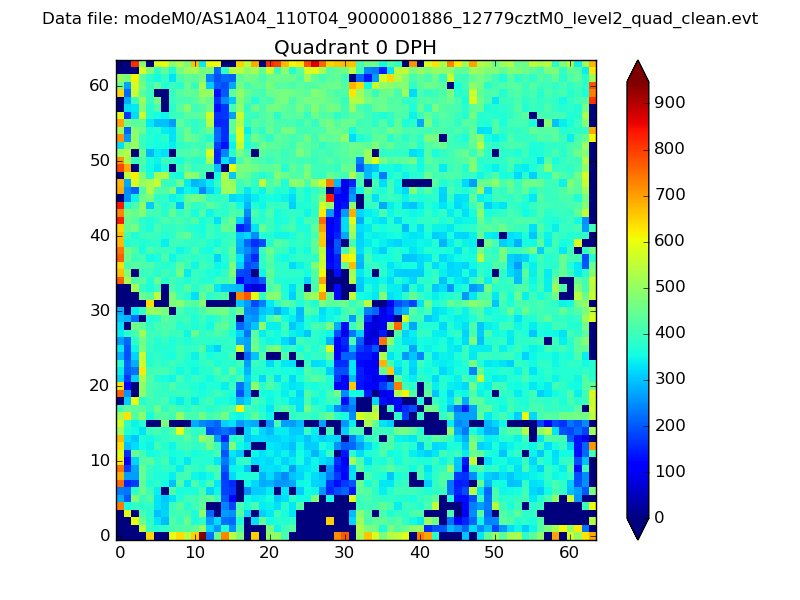 |
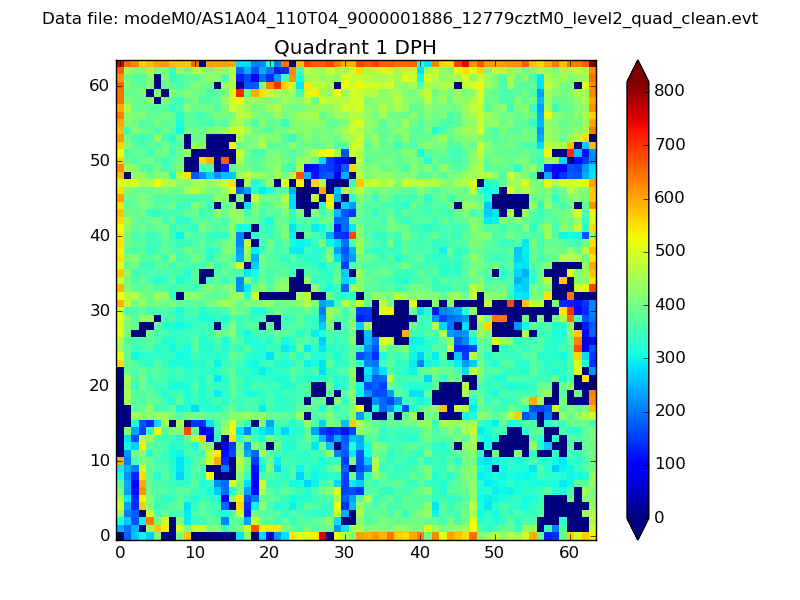 |
Quadrant B |
|---|---|---|---|
| Quadrant D | 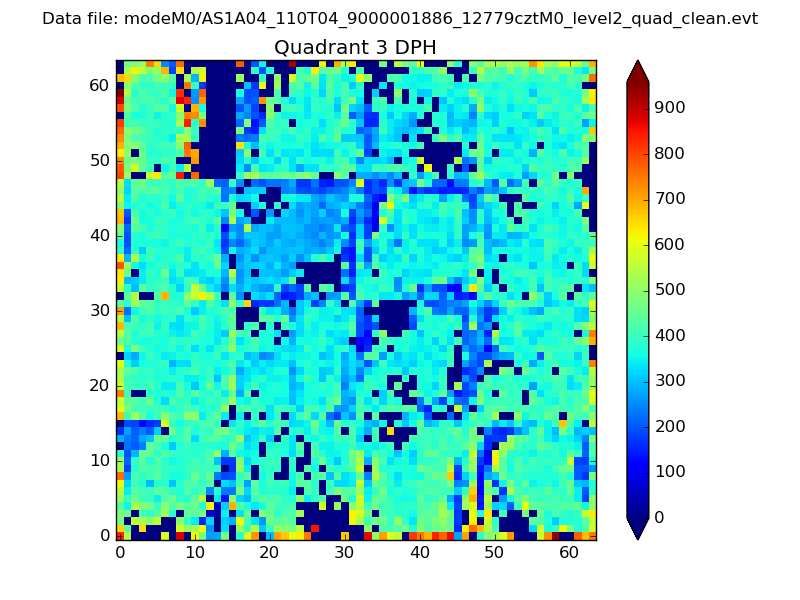 |
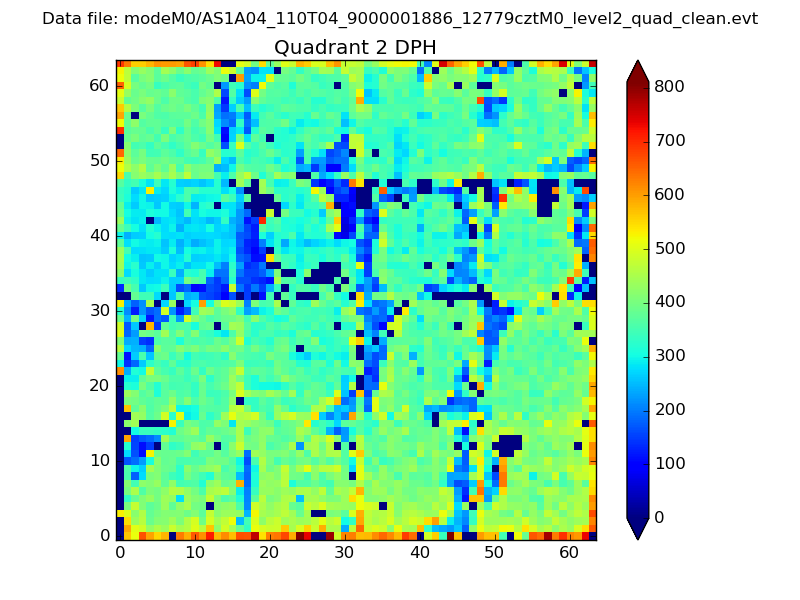 |
Quadrant C |
| Plot type | Count rate plots | Images |
|---|---|---|
| Comparison with Poisson distribution Blue bars denote a histogram of data divided into 1 sec bins. Red curve is a Poisson curve with rate = median count rate of data. |
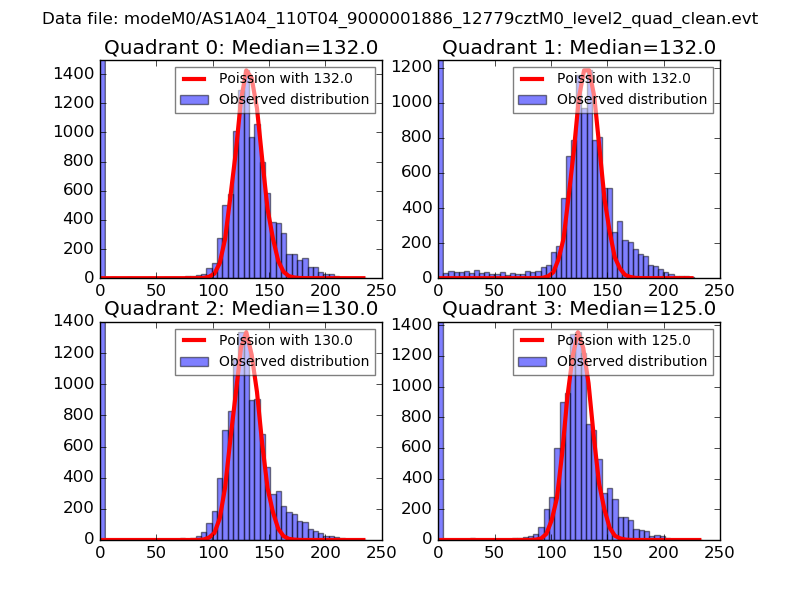 |
 |
| Quadrant-wise count rates Data is divided into 100 sec bins |
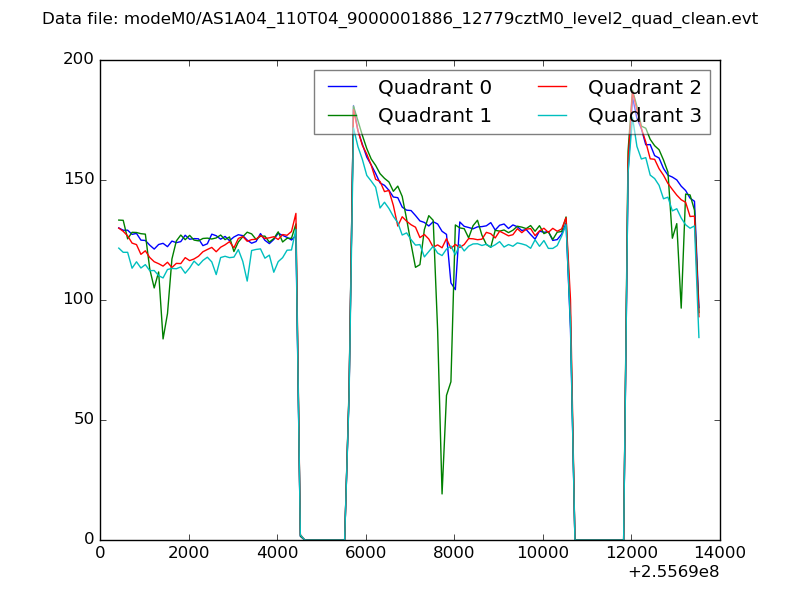 |
|
| Module-wise count rates for Quadrant A Data is divided into 100 sec bins |
 |
 |
| Module-wise count rates for Quadrant B Data is divided into 100 sec bins |
 |
 |
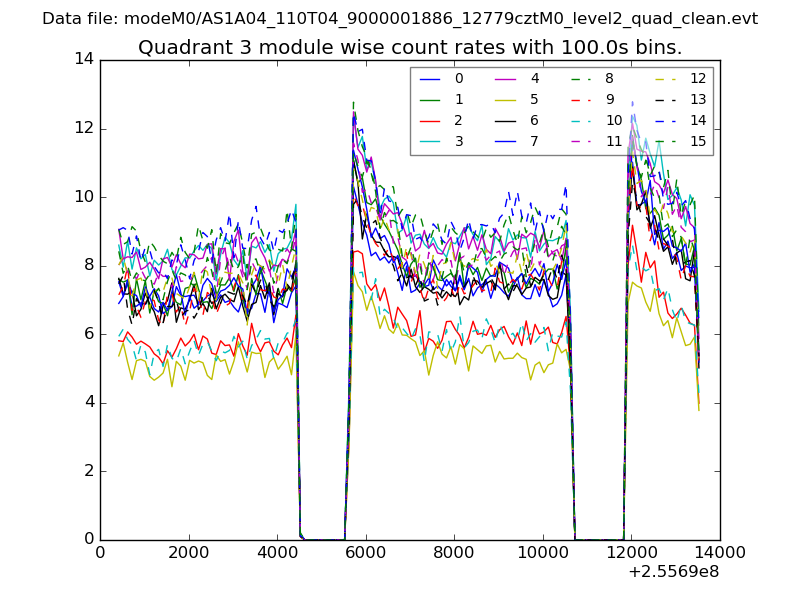
| Module-wise count rates for Quadrant C Data is divided into 100 sec bins |
 |
 |
| Module-wise count rates for Quadrant D Data is divided into 100 sec bins |
 |
 |
| Parameter | Plot |
|---|---|
| CZT HV Monitor |  |
| D_VDD | 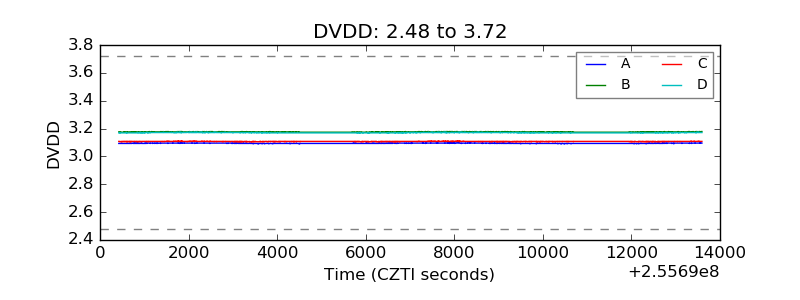 |
| Temperature 1 | 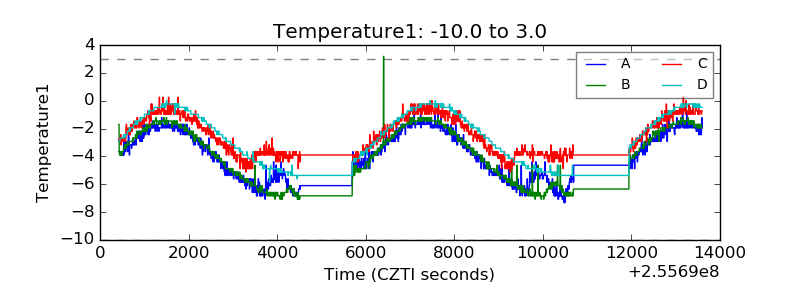 |
| Veto HV Monitor | 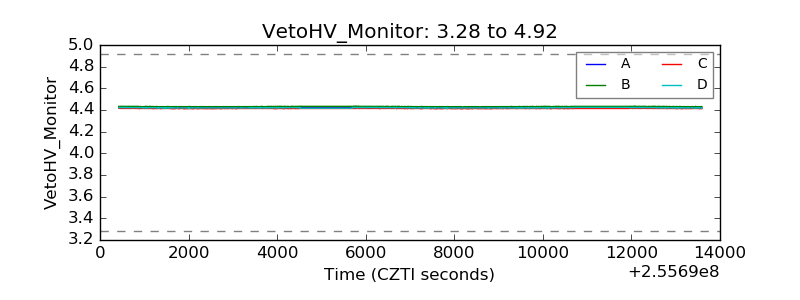 |
| Veto LLD | 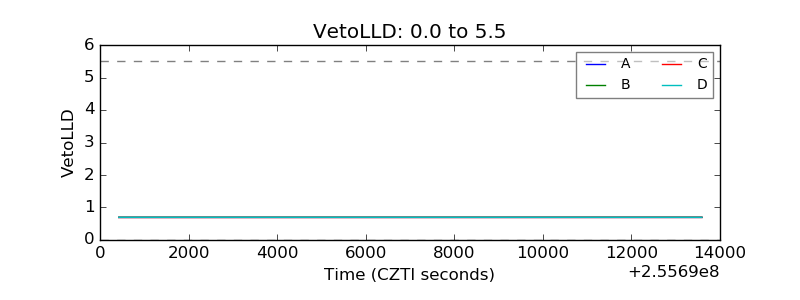 |
| Alpha Counter | 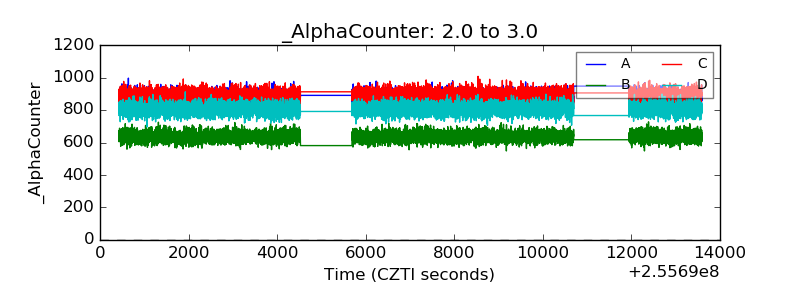 |
| _CPM_Rate | 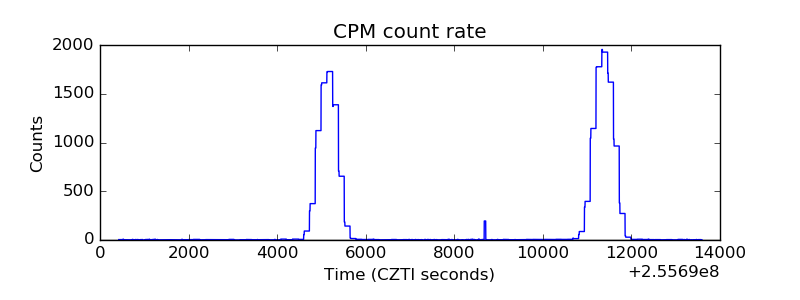 |
| CZT Counter | 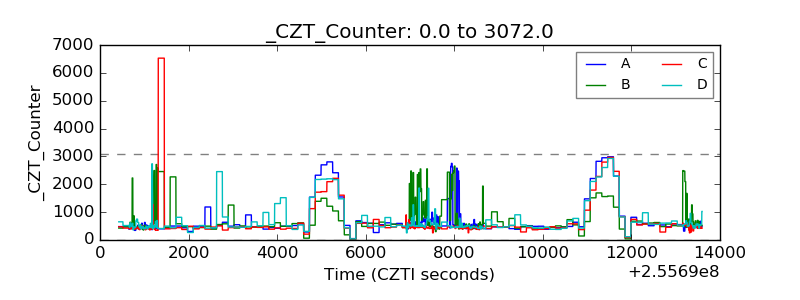 |
| +2.5 Volts monitor |  |
| +5 Volts monitor |  |
| _ROLL_ROT | 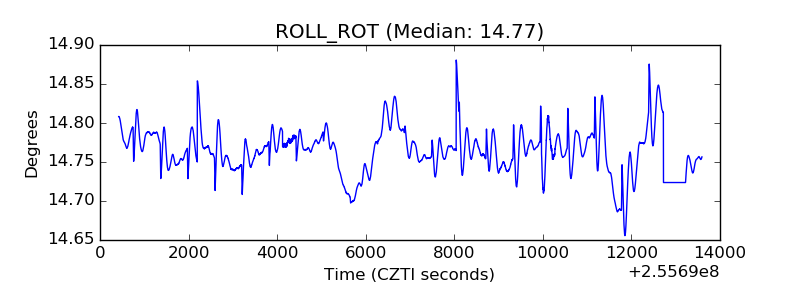 |
| _Roll_DEC | 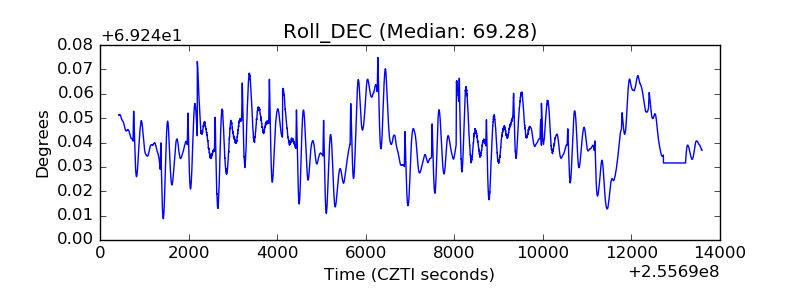 |
| _Roll_RA | 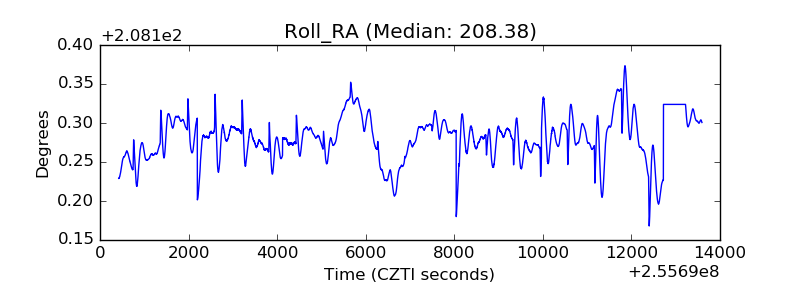 |
| Veto Counter |  |