| Param | Original file | Final file |
|---|---|---|
| Filename | modeM0/AS1A04_110T04_9000001886_12780cztM0_level2.evt | modeM0/AS1A04_110T04_9000001886_12780cztM0_level2_quad_clean.evt |
| Size (bytes) | 501,215,040 | 131,532,480 |
| Size | 478.0 MB | 125.4 MB |
| Events in quadrant A | 3,227,648 | 906,609 |
| Events in quadrant B | 4,436,359 | 892,148 |
| Events in quadrant C | 3,094,673 | 895,293 |
| Events in quadrant D | 3,991,568 | 848,514 |
| Mode SS | |||
|---|---|---|---|
| Quadrant | BADHDUFLAG | Total packets | Discarded packets |
| A | 0 | 130 | 0 |
| B | 0 | 130 | 0 |
| C | 0 | 130 | 0 |
| D | 0 | 130 | 0 |
| Mode M0 | |||
|---|---|---|---|
| Quadrant | BADHDUFLAG | Total packets | Discarded packets |
| A | 0 | 13460 | 2 |
| B | 0 | 17248 | 1 |
| C | 0 | 13153 | 1 |
| D | 0 | 16005 | 1 |
| Mode M9 | |||
|---|---|---|---|
| Quadrant | BADHDUFLAG | Total packets | Discarded packets |
| A | 0 | 12 | 0 |
| B | 0 | 12 | 0 |
| C | 0 | 12 | 0 |
| D | 0 | 12 | 0 |
| Quadrant | Total seconds | Saturated seconds | Saturation percentage |
|---|---|---|---|
| A | 6317 | 111 | 1.757163% |
| B | 6317 | 476 | 7.535222% |
| C | 6317 | 76 | 1.203103% |
| D | 6317 | 158 | 2.501187% |
Noise dominated data is calculated using 1-second bins in cleaned event files. If a bin has >2000 counts, and if more than 50% of those come from <1% of pixels, then it is considered to be noise-dominated and hence unusable.
| Quadrant | # 1 sec bins | Bins with >0 counts | Bins with >2000 counts | High rate bins dominated by noise | Noise dominated (total time) | Noise dominated (detector-on time) | Marked lightcurve |
|---|---|---|---|---|---|---|---|
| A | 7598 | 6319 | 0 | 0 | 0.00% | 0.00% |  |
| B | 7598 | 6319 | 274 | 274 | 3.61% | 4.34% |  |
| C | 7598 | 6319 | 0 | 0 | 0.00% | 0.00% |  |
| D | 7598 | 6319 | 84 | 84 | 1.11% | 1.33% |  |
Top three noisy pixels from each quadrant. If the there are fewer than three noisy pixels in the level2.evt file, extra rows are filled as -1
| Pixel properties | Quadrant properties | ||||||
|---|---|---|---|---|---|---|---|
| Quadrant | DetID | PixID | Counts | Sigma | Mean | Median | Sigma |
| A | 12 | 189 | 78975 | 487.1 | 804 | 787 | 160.5 |
| A | 8 | 15 | 21387 | 128.34 | 804 | 787 | 160.5 |
| A | 15 | 222 | 18044 | 107.51 | 804 | 787 | 160.5 |
| B | 4 | 239 | 1050796 | 7327.24 | 779 | 761 | 143.3 |
| B | 0 | 219 | 145275 | 1008.43 | 779 | 761 | 143.3 |
| B | 3 | 64 | 139256 | 966.43 | 779 | 761 | 143.3 |
| C | 15 | 208 | 50641 | 283.84 | 780 | 784 | 175.7 |
| C | 13 | 61 | 5595 | 27.39 | 780 | 784 | 175.7 |
| C | 3 | 202 | 1959 | 6.69 | 780 | 784 | 175.7 |
| D | 1 | 52 | 627918 | 3403.28 | 780 | 758 | 184.3 |
| D | 8 | 195 | 298547 | 1615.95 | 780 | 758 | 184.3 |
| D | 2 | 136 | 29268 | 154.71 | 780 | 758 | 184.3 |
Histogram calculated using DETX and DETY for each event in the final _common_clean file
| Quadrant A | 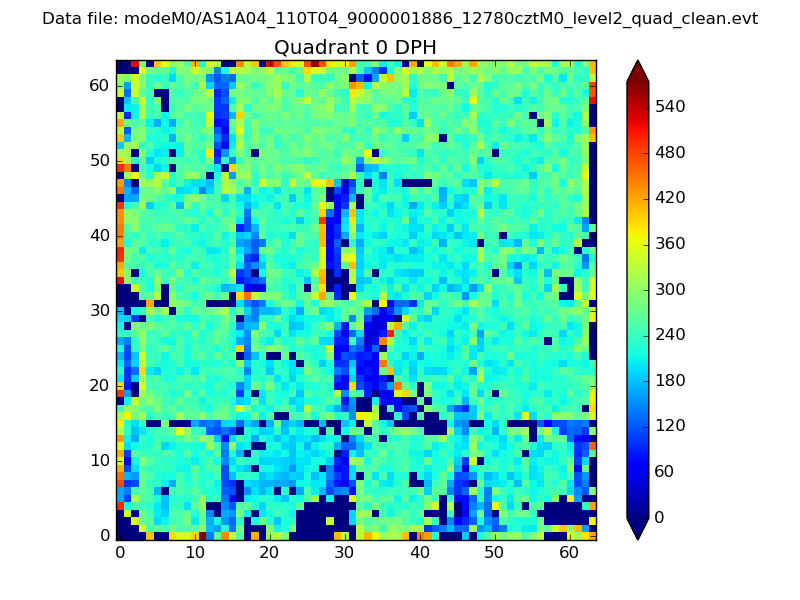 |
 |
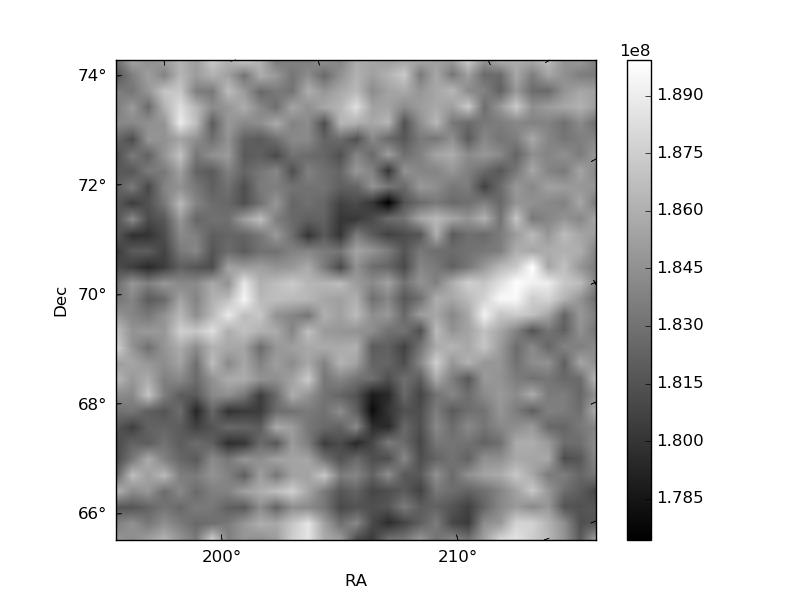
Quadrant B |
|---|---|---|---|
| Quadrant D |  |
 |
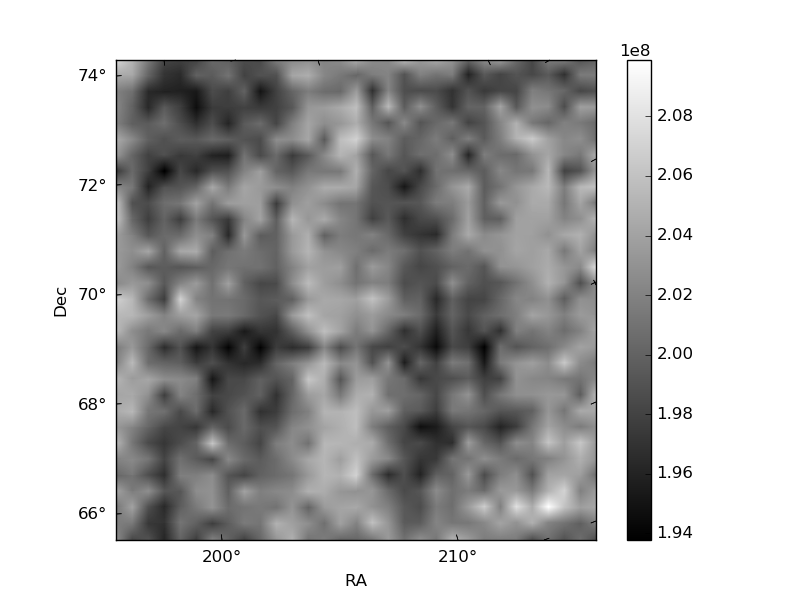
Quadrant C |
| Plot type | Count rate plots | Images |
|---|---|---|
| Comparison with Poisson distribution Blue bars denote a histogram of data divided into 1 sec bins. Red curve is a Poisson curve with rate = median count rate of data. |
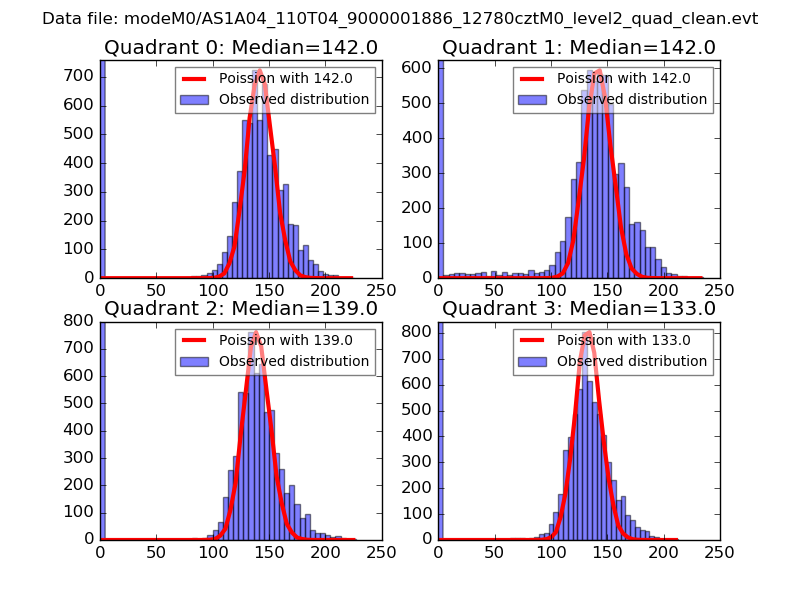 |
 |
| Quadrant-wise count rates Data is divided into 100 sec bins |
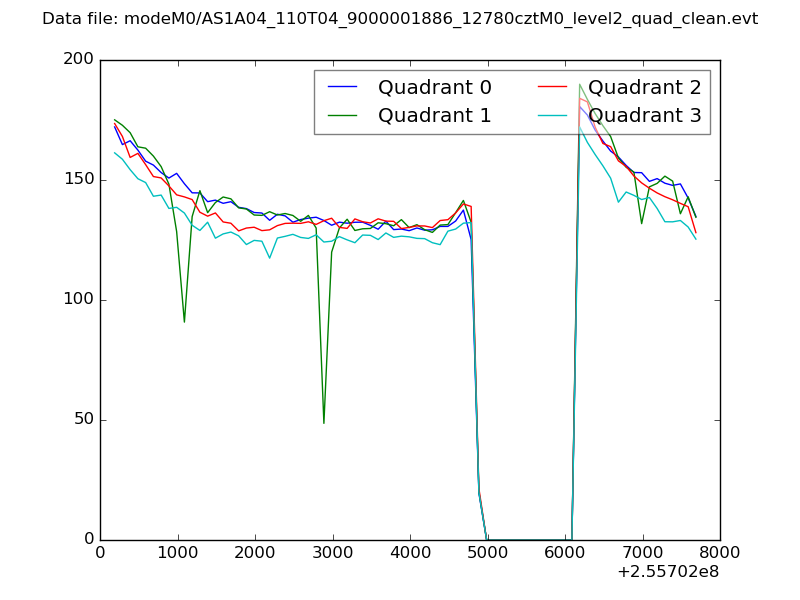 |
|
| Module-wise count rates for Quadrant A Data is divided into 100 sec bins |
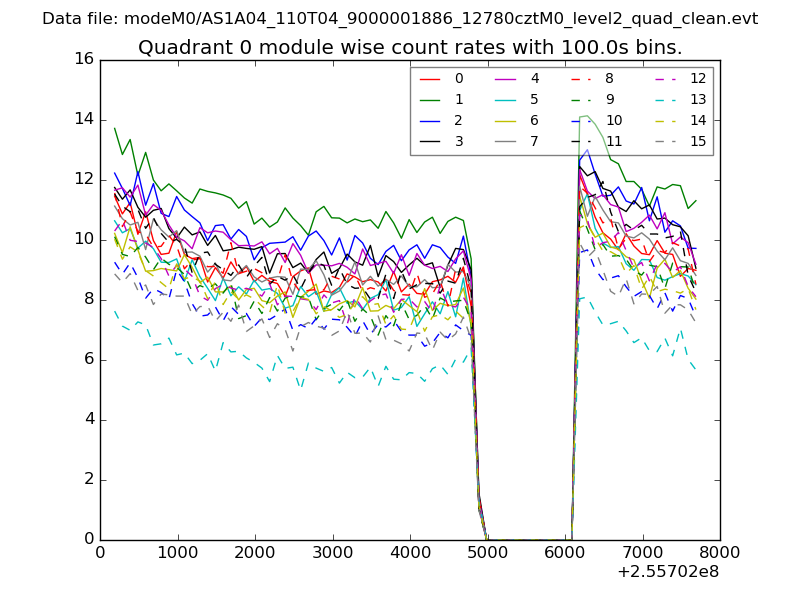 |
 |
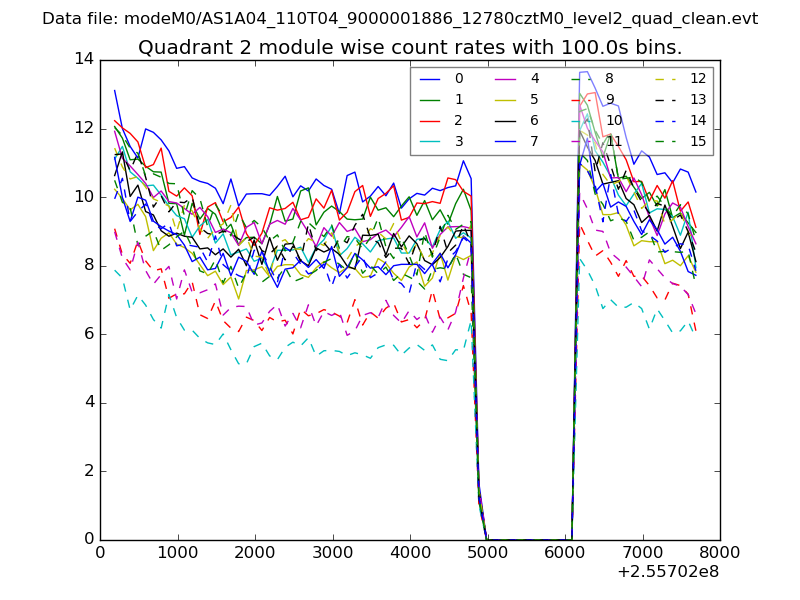
| Module-wise count rates for Quadrant B Data is divided into 100 sec bins |
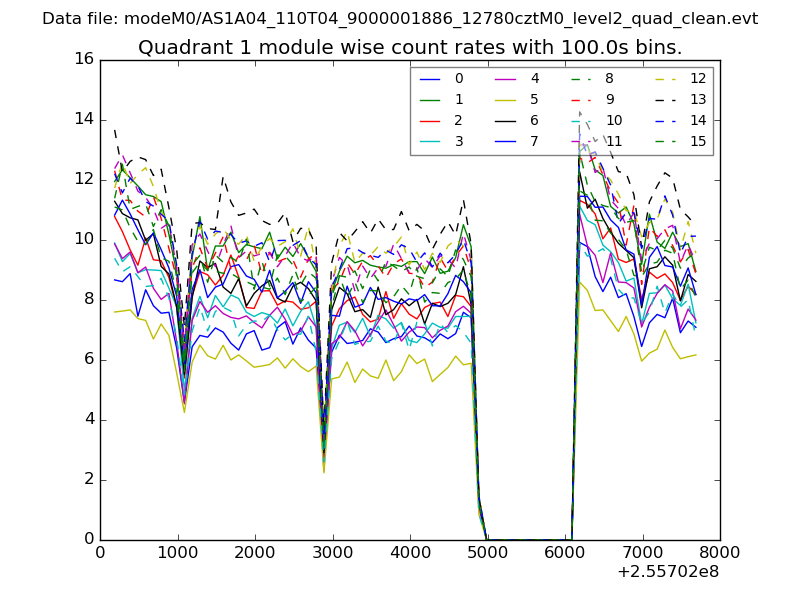 |
 |
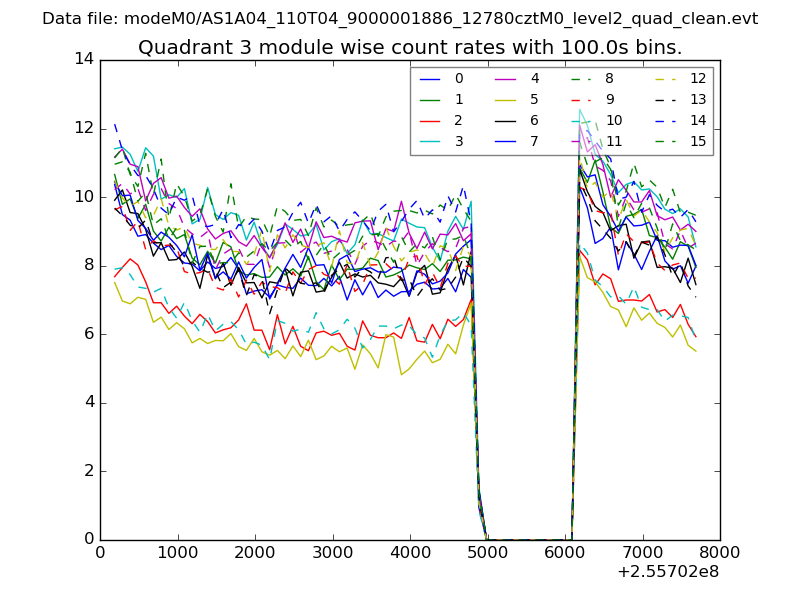
| Module-wise count rates for Quadrant C Data is divided into 100 sec bins |
 |
 |
| Module-wise count rates for Quadrant D Data is divided into 100 sec bins |
 |
 |
| Parameter | Plot |
|---|---|
| CZT HV Monitor | 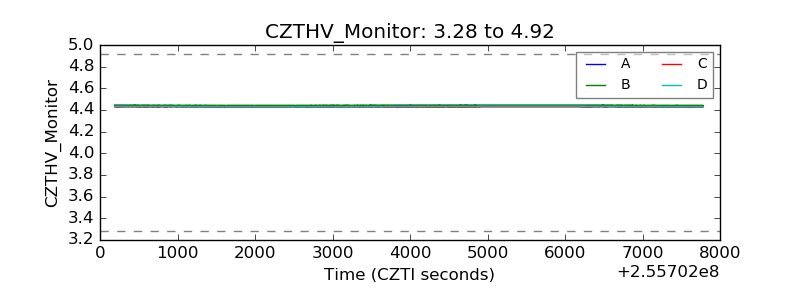 |
| D_VDD | 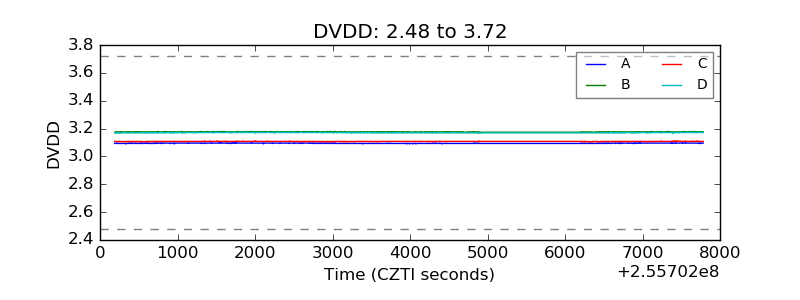 |
| Temperature 1 | 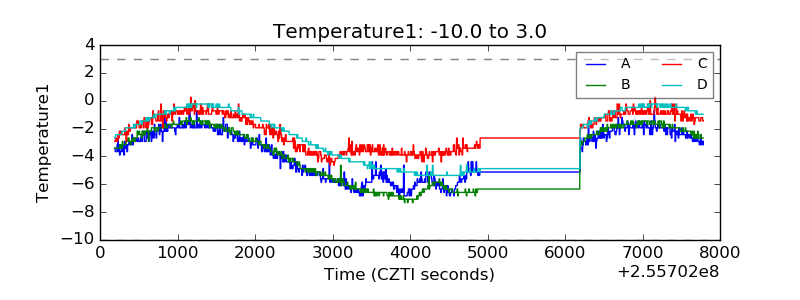 |
| Veto HV Monitor | 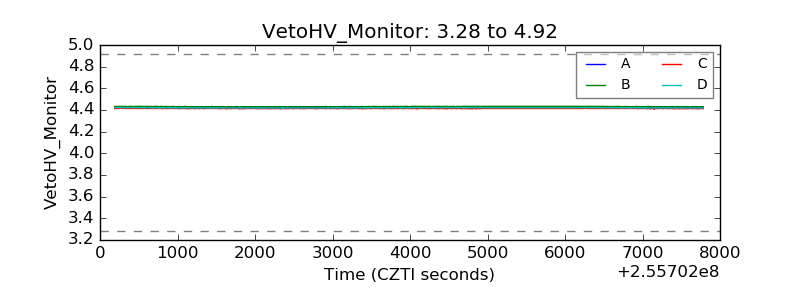 |
| Veto LLD | 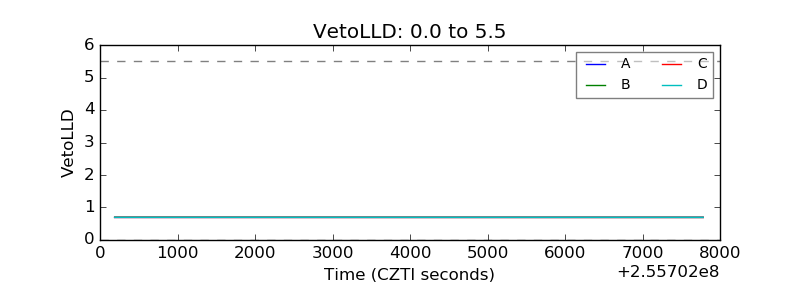 |
| Alpha Counter | 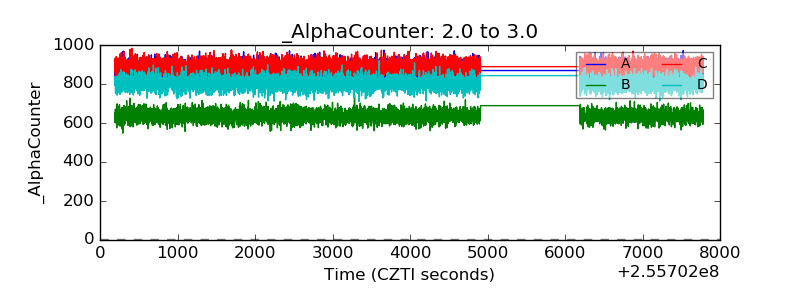 |
| _CPM_Rate | 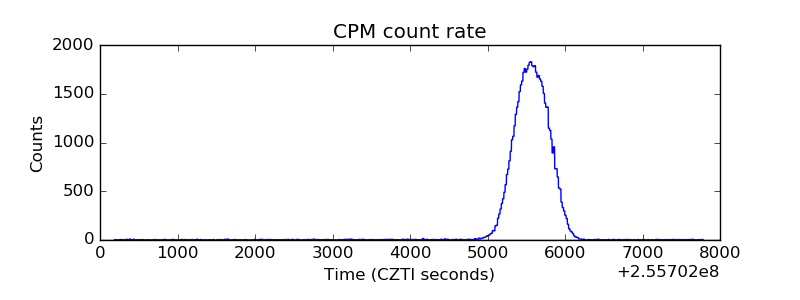 |
| CZT Counter | 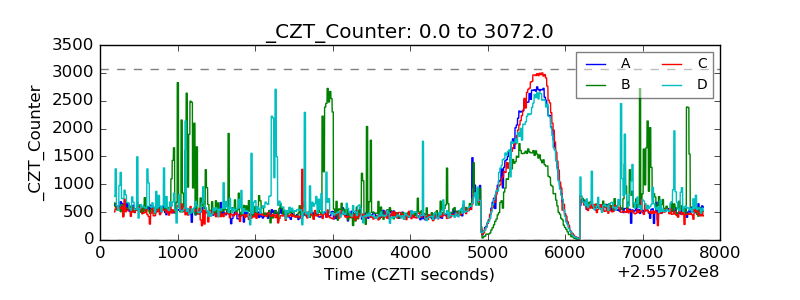 |
| +2.5 Volts monitor |  |
| +5 Volts monitor | 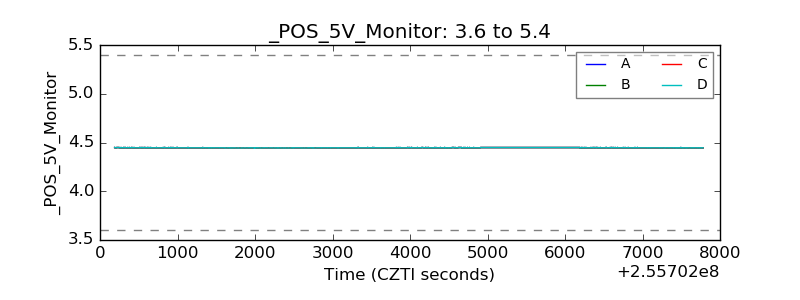 |
| _ROLL_ROT | 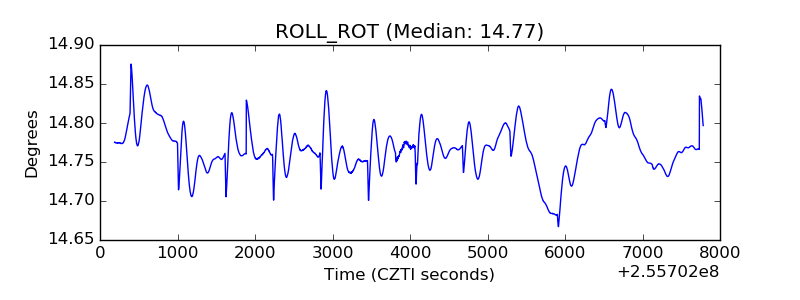 |
| _Roll_DEC | 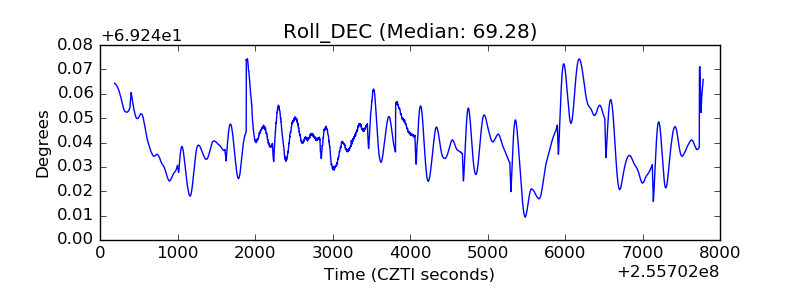 |
| _Roll_RA | 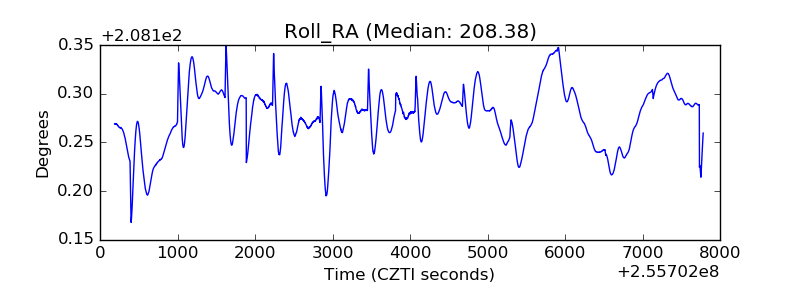 |
| Veto Counter | 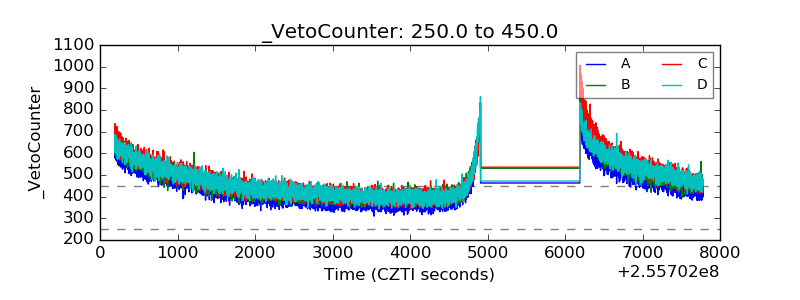 |