| Param | Original file | Final file |
|---|---|---|
| Filename | modeM0/AS1A04_110T04_9000001886_12782cztM0_level2.evt | modeM0/AS1A04_110T04_9000001886_12782cztM0_level2_quad_clean.evt |
| Size (bytes) | 479,125,440 | 115,729,920 |
| Size | 456.9 MB | 110.4 MB |
| Events in quadrant A | 2,897,459 | 793,328 |
| Events in quadrant B | 4,038,883 | 758,011 |
| Events in quadrant C | 2,916,774 | 790,936 |
| Events in quadrant D | 4,251,089 | 744,901 |
| Mode SS | |||
|---|---|---|---|
| Quadrant | BADHDUFLAG | Total packets | Discarded packets |
| A | 0 | 122 | 0 |
| B | 0 | 122 | 0 |
| C | 0 | 122 | 0 |
| D | 0 | 122 | 0 |
| Mode M0 | |||
|---|---|---|---|
| Quadrant | BADHDUFLAG | Total packets | Discarded packets |
| A | 0 | 12459 | 2 |
| B | 0 | 15859 | 1 |
| C | 0 | 12673 | 1 |
| D | 0 | 16584 | 1 |
| Mode M9 | |||
|---|---|---|---|
| Quadrant | BADHDUFLAG | Total packets | Discarded packets |
| A | 0 | 11 | 0 |
| B | 0 | 11 | 0 |
| C | 0 | 11 | 0 |
| D | 0 | 11 | 0 |
| Quadrant | Total seconds | Saturated seconds | Saturation percentage |
|---|---|---|---|
| A | 5978 | 92 | 1.538976% |
| B | 5978 | 560 | 9.367681% |
| C | 5978 | 96 | 1.605888% |
| D | 5978 | 242 | 4.048177% |
Noise dominated data is calculated using 1-second bins in cleaned event files. If a bin has >2000 counts, and if more than 50% of those come from <1% of pixels, then it is considered to be noise-dominated and hence unusable.
| Quadrant | # 1 sec bins | Bins with >0 counts | Bins with >2000 counts | High rate bins dominated by noise | Noise dominated (total time) | Noise dominated (detector-on time) | Marked lightcurve |
|---|---|---|---|---|---|---|---|
| A | 7129 | 5980 | 0 | 0 | 0.00% | 0.00% | 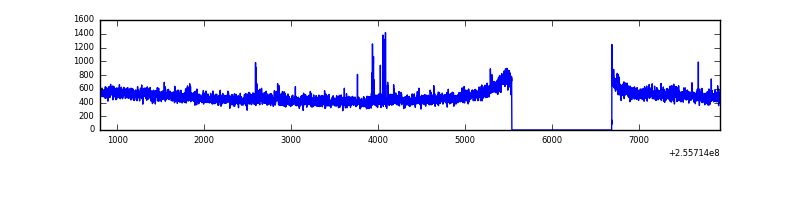 |
| B | 7129 | 5980 | 313 | 313 | 4.39% | 5.23% | 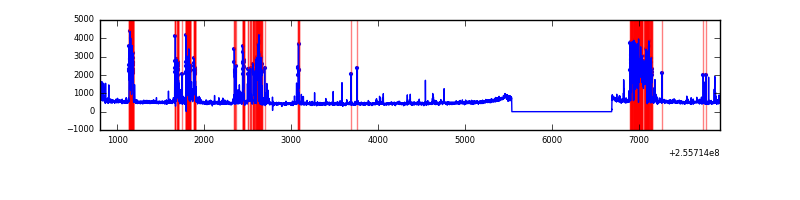 |
| C | 7129 | 5980 | 12 | 12 | 0.17% | 0.20% | 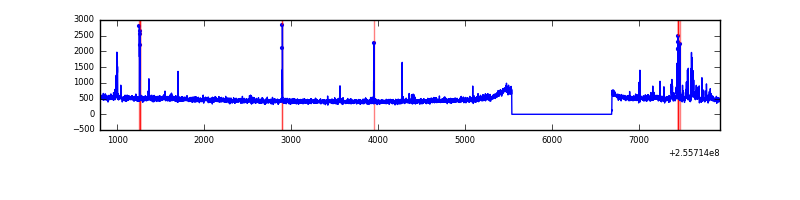 |
| D | 7129 | 5980 | 143 | 143 | 2.01% | 2.39% | 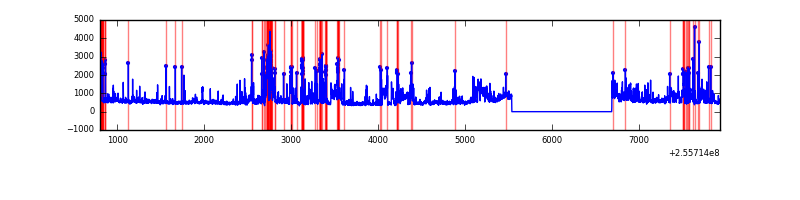 |
Top three noisy pixels from each quadrant. If the there are fewer than three noisy pixels in the level2.evt file, extra rows are filled as -1
| Pixel properties | Quadrant properties | ||||||
|---|---|---|---|---|---|---|---|
| Quadrant | DetID | PixID | Counts | Sigma | Mean | Median | Sigma |
| A | 12 | 189 | 85551 | 582.3 | 722 | 706 | 145.7 |
| A | 15 | 174 | 22239 | 147.78 | 722 | 706 | 145.7 |
| A | 8 | 15 | 12083 | 78.08 | 722 | 706 | 145.7 |
| B | 4 | 239 | 1217706 | 9577.58 | 684 | 668 | 127.1 |
| B | 0 | 219 | 75581 | 589.53 | 684 | 668 | 127.1 |
| B | 3 | 64 | 42910 | 332.43 | 684 | 668 | 127.1 |
| C | 15 | 208 | 136658 | 835.88 | 709 | 712 | 162.6 |
| C | 14 | 234 | 12148 | 70.32 | 709 | 712 | 162.6 |
| C | 13 | 61 | 5264 | 27.99 | 709 | 712 | 162.6 |
| D | 1 | 52 | 1029224 | 6121.69 | 699 | 678 | 168.0 |
| D | 8 | 195 | 333353 | 1980.01 | 699 | 678 | 168.0 |
| D | 10 | 157 | 178984 | 1061.24 | 699 | 678 | 168.0 |
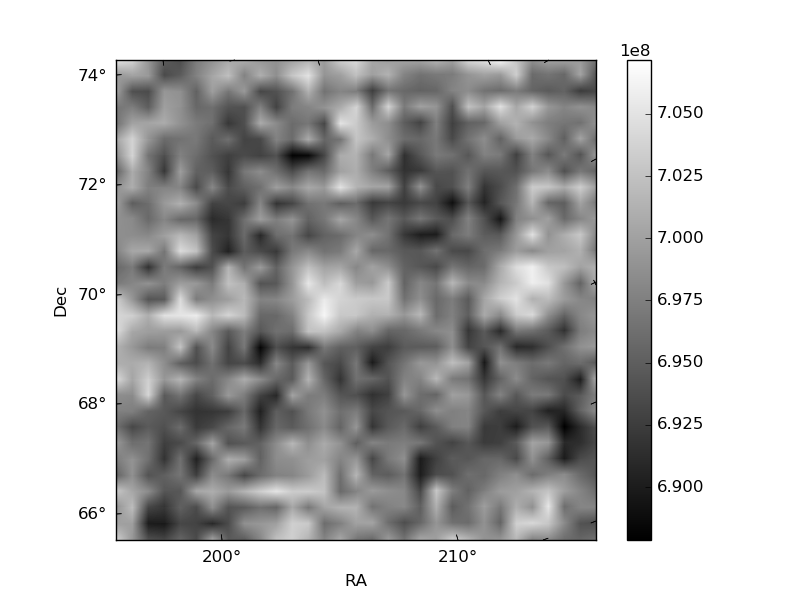
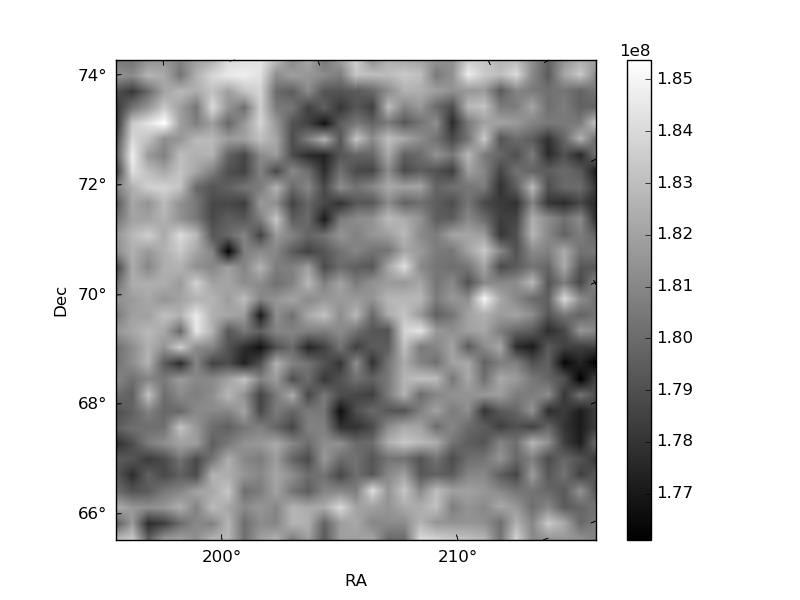
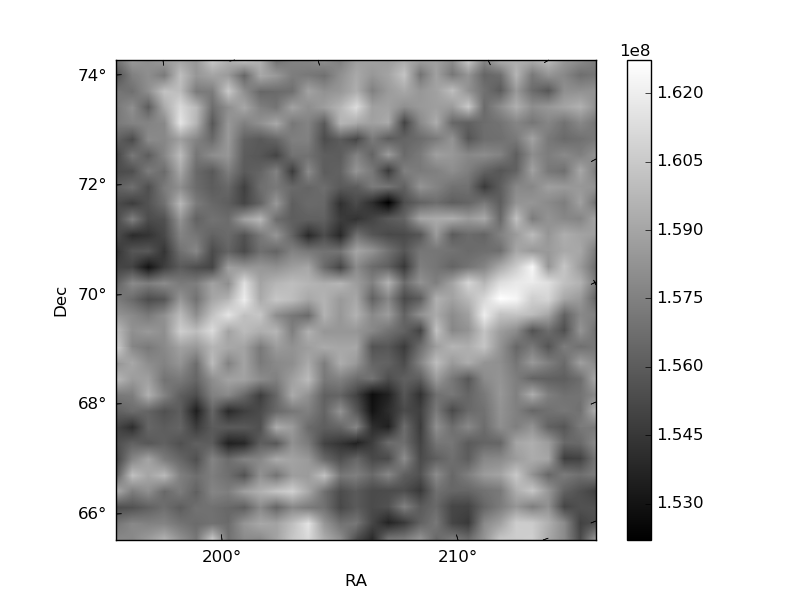
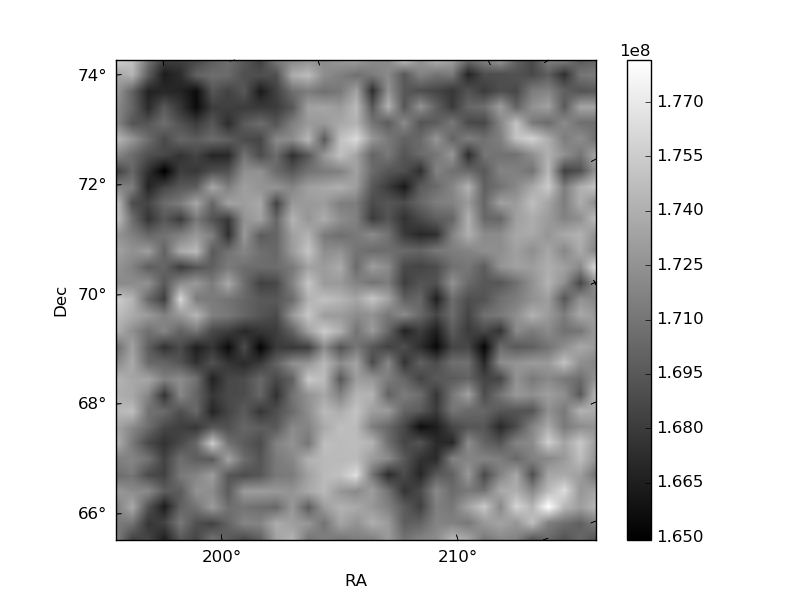
Histogram calculated using DETX and DETY for each event in the final _common_clean file
| Quadrant A | 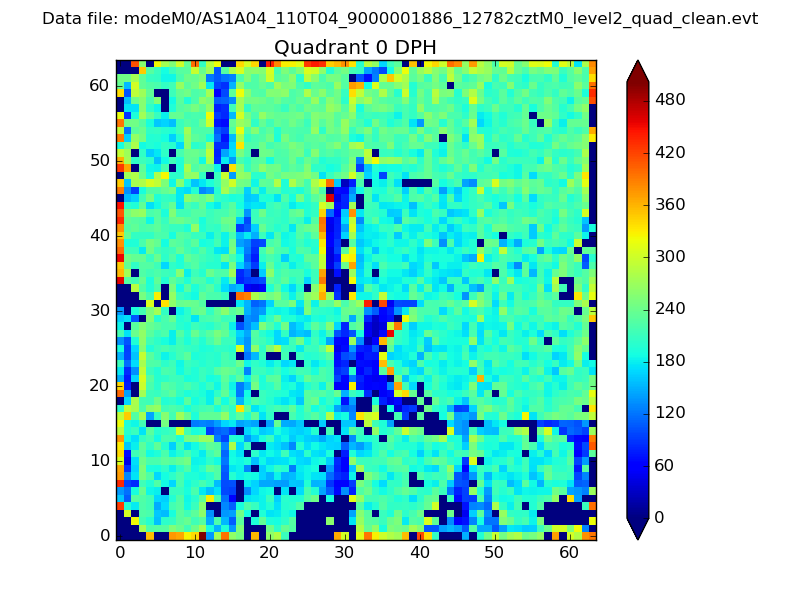 |
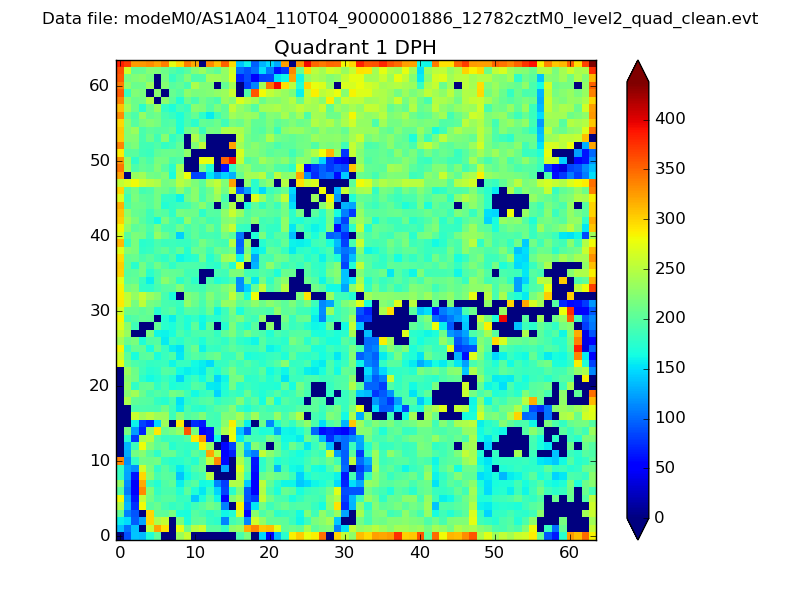 |
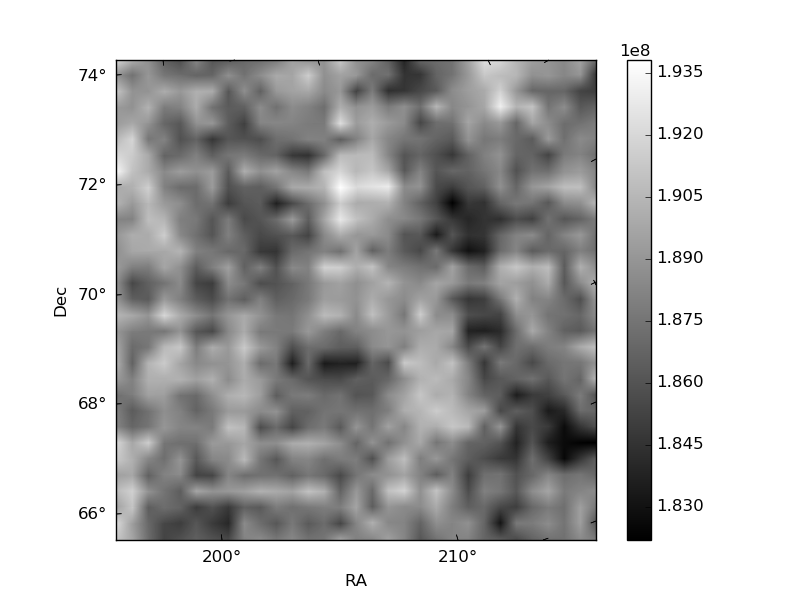
Quadrant B |
|---|---|---|---|
| Quadrant D | 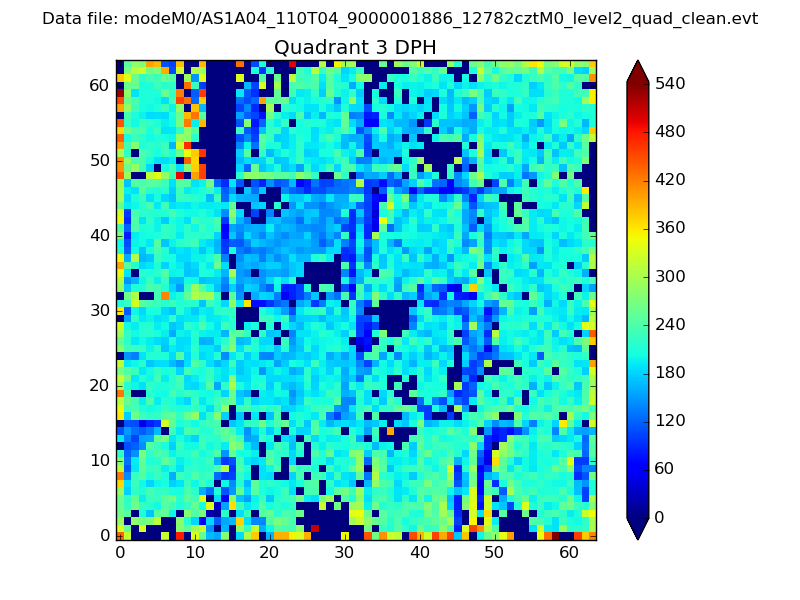 |
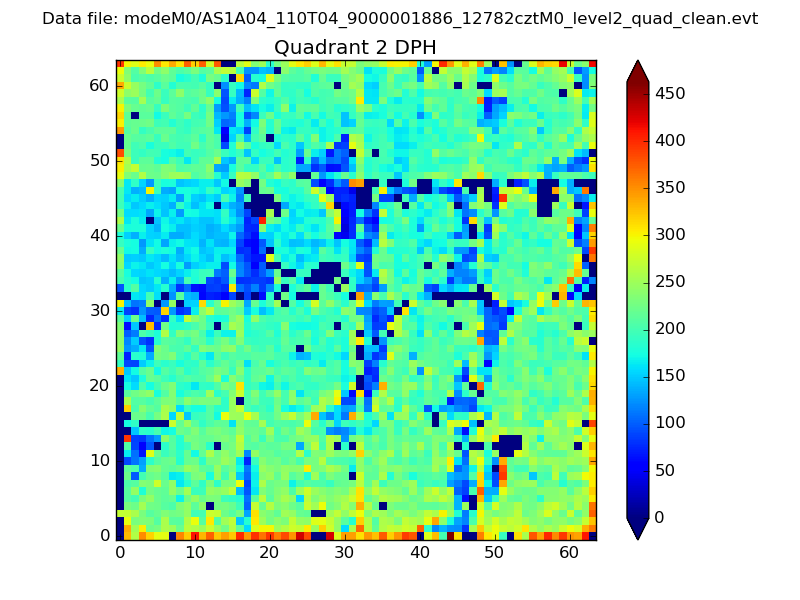 |
Quadrant C |
| Plot type | Count rate plots | Images |
|---|---|---|
| Comparison with Poisson distribution Blue bars denote a histogram of data divided into 1 sec bins. Red curve is a Poisson curve with rate = median count rate of data. |
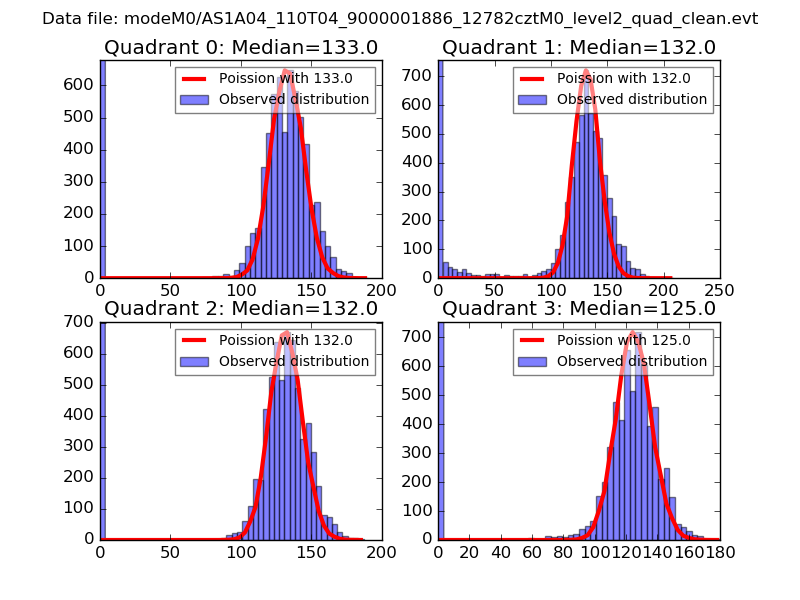 |
 |
| Quadrant-wise count rates Data is divided into 100 sec bins |
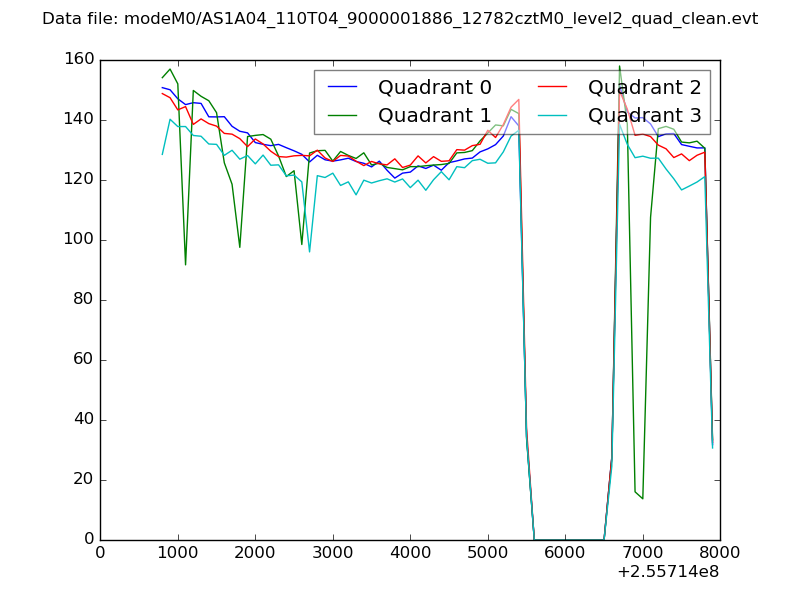 |
|
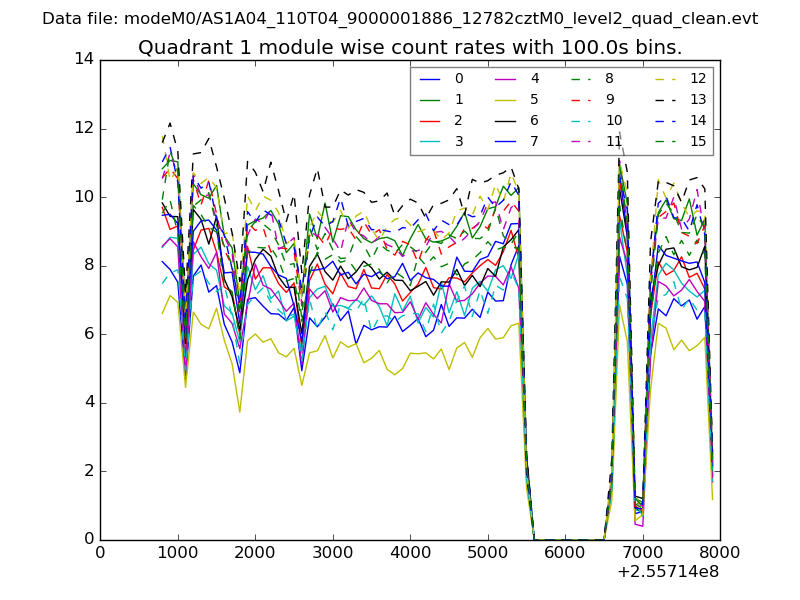
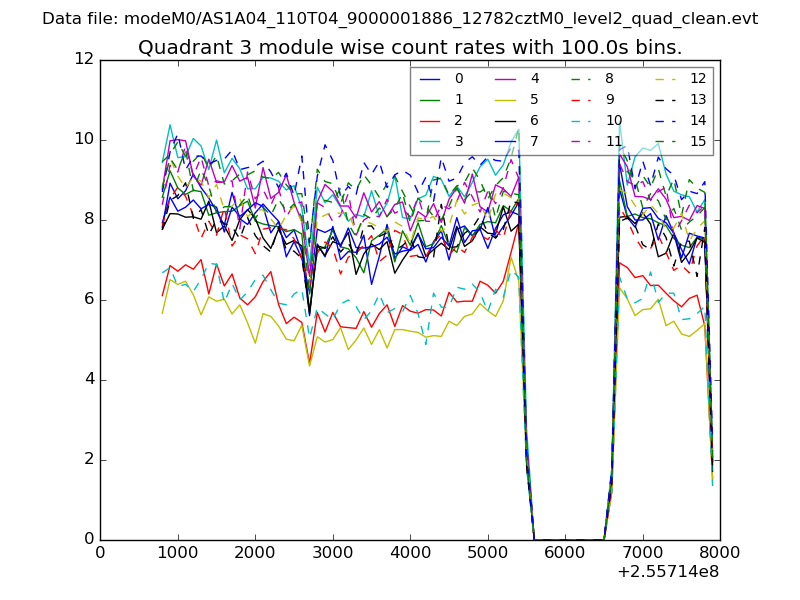
| Module-wise count rates for Quadrant A Data is divided into 100 sec bins |
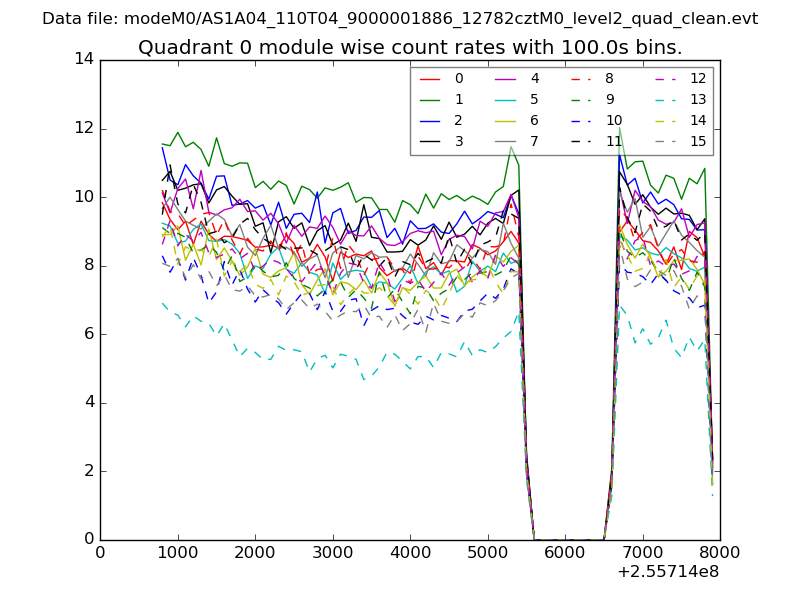 |
 |
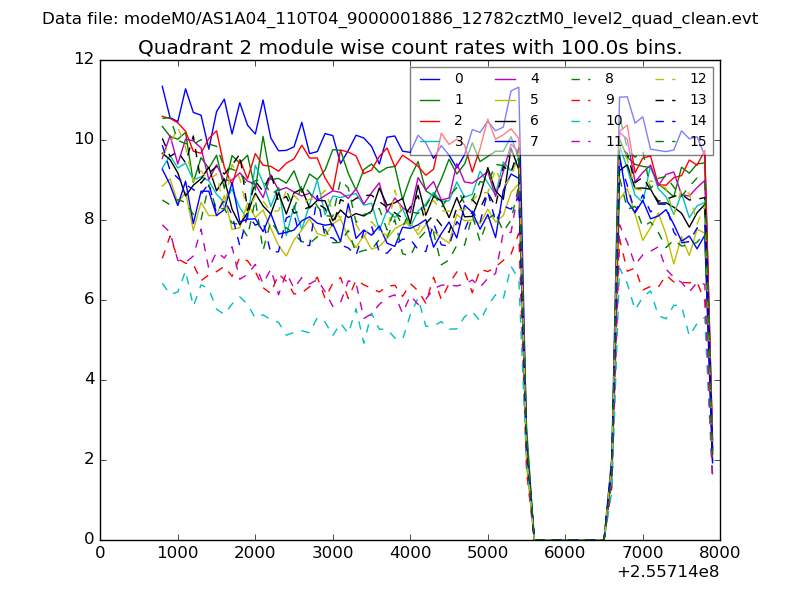
| Module-wise count rates for Quadrant B Data is divided into 100 sec bins |
 |
 |
| Module-wise count rates for Quadrant C Data is divided into 100 sec bins |
 |
 |
| Module-wise count rates for Quadrant D Data is divided into 100 sec bins |
 |
 |
| Parameter | Plot |
|---|---|
| CZT HV Monitor | 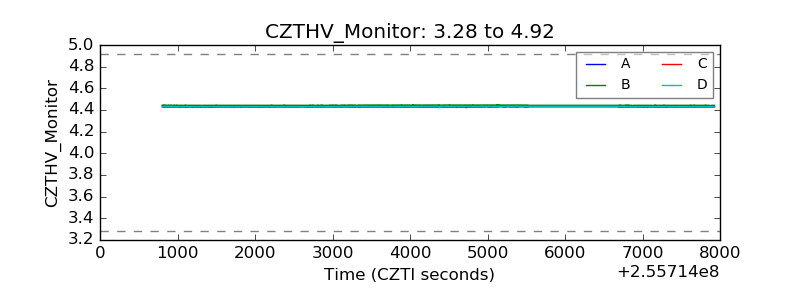 |
| D_VDD | 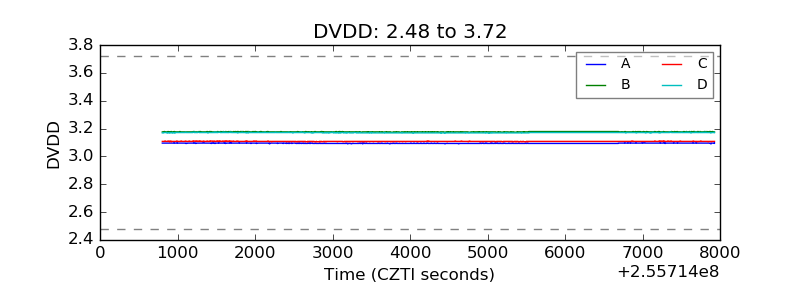 |
| Temperature 1 | 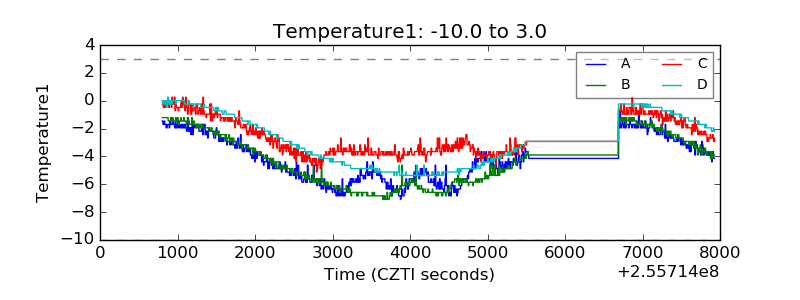 |
| Veto HV Monitor | 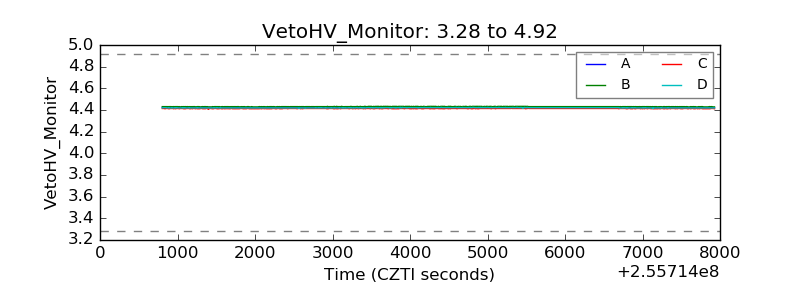 |
| Veto LLD | 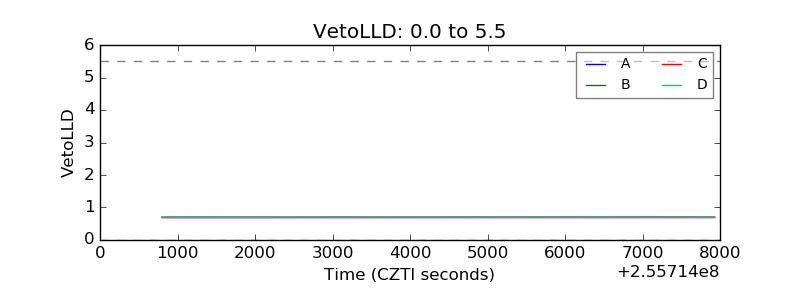 |
| Alpha Counter | 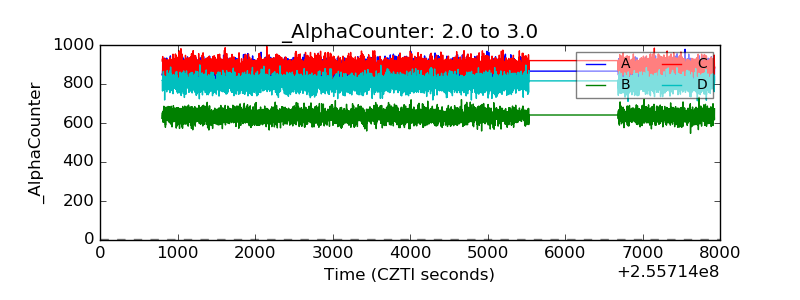 |
| _CPM_Rate | 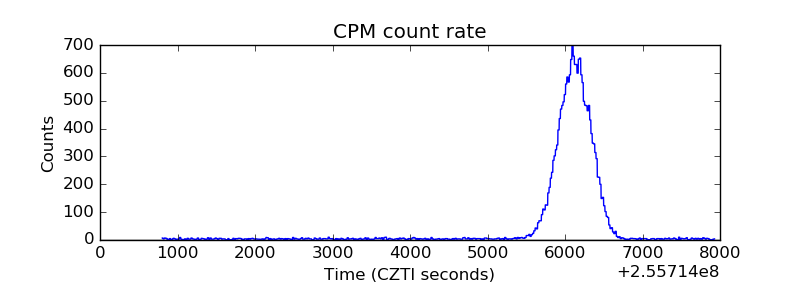 |
| CZT Counter | 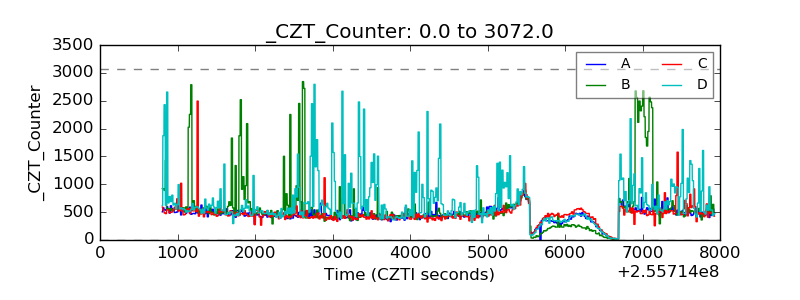 |
| +2.5 Volts monitor |  |
| +5 Volts monitor |  |
| _ROLL_ROT | 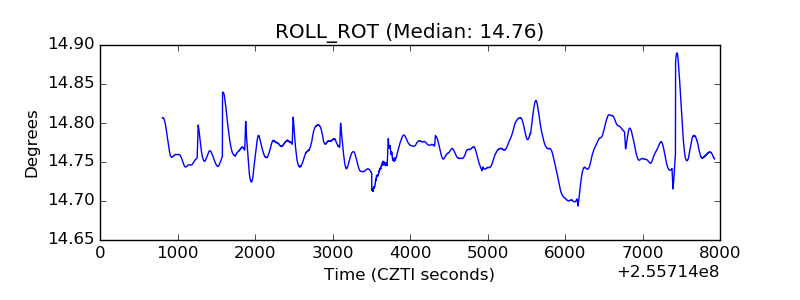 |
| _Roll_DEC | 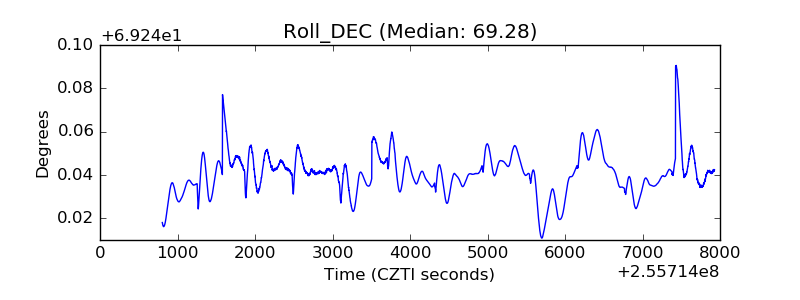 |
| _Roll_RA | 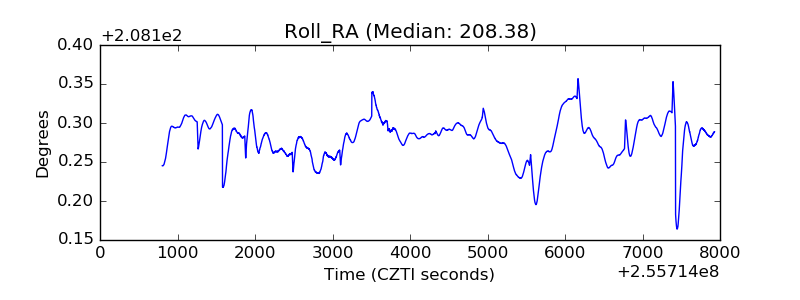 |
| Veto Counter | 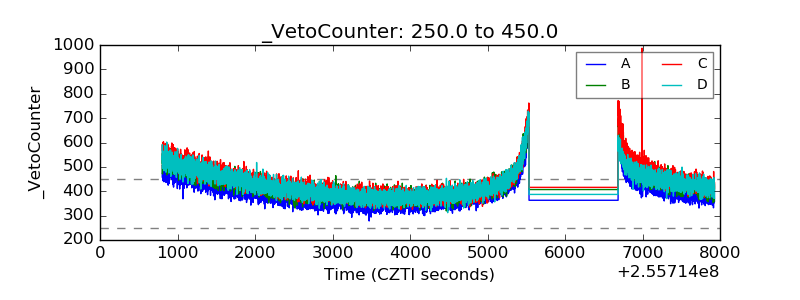 |