| Param | Original file | Final file |
|---|---|---|
| Filename | modeM0/AS1A04_110T04_9000001886_12784cztM0_level2.evt | modeM0/AS1A04_110T04_9000001886_12784cztM0_level2_quad_clean.evt |
| Size (bytes) | 619,640,640 | 126,420,480 |
| Size | 590.9 MB | 120.6 MB |
| Events in quadrant A | 3,377,181 | 871,953 |
| Events in quadrant B | 4,720,873 | 860,213 |
| Events in quadrant C | 3,294,746 | 876,109 |
| Events in quadrant D | 6,890,509 | 724,438 |
| Mode SS | |||
|---|---|---|---|
| Quadrant | BADHDUFLAG | Total packets | Discarded packets |
| A | 0 | 144 | 0 |
| B | 0 | 144 | 0 |
| C | 0 | 144 | 0 |
| D | 0 | 144 | 0 |
| Mode M0 | |||
|---|---|---|---|
| Quadrant | BADHDUFLAG | Total packets | Discarded packets |
| A | 0 | 15003 | 3 |
| B | 0 | 18940 | 2 |
| C | 0 | 14932 | 2 |
| D | 0 | 25352 | 2 |
| Mode M9 | |||
|---|---|---|---|
| Quadrant | BADHDUFLAG | Total packets | Discarded packets |
| A | 0 | 9 | 0 |
| B | 0 | 9 | 0 |
| C | 0 | 9 | 0 |
| D | 0 | 10 | 0 |
| Quadrant | Total seconds | Saturated seconds | Saturation percentage |
|---|---|---|---|
| A | 7118 | 64 | 0.899129% |
| B | 7118 | 508 | 7.136836% |
| C | 7118 | 63 | 0.885080% |
| D | 7118 | 1355 | 19.036246% |
Noise dominated data is calculated using 1-second bins in cleaned event files. If a bin has >2000 counts, and if more than 50% of those come from <1% of pixels, then it is considered to be noise-dominated and hence unusable.
| Quadrant | # 1 sec bins | Bins with >0 counts | Bins with >2000 counts | High rate bins dominated by noise | Noise dominated (total time) | Noise dominated (detector-on time) | Marked lightcurve |
|---|---|---|---|---|---|---|---|
| A | 7579 | 7120 | 10 | 10 | 0.13% | 0.14% | 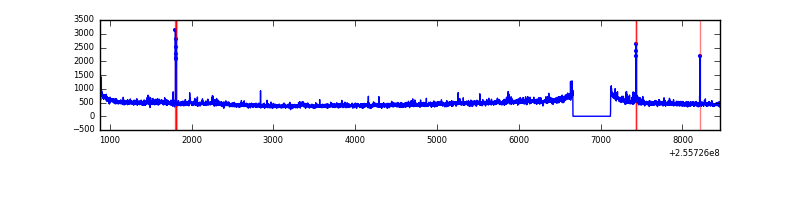 |
| B | 7579 | 7120 | 302 | 302 | 3.98% | 4.24% | 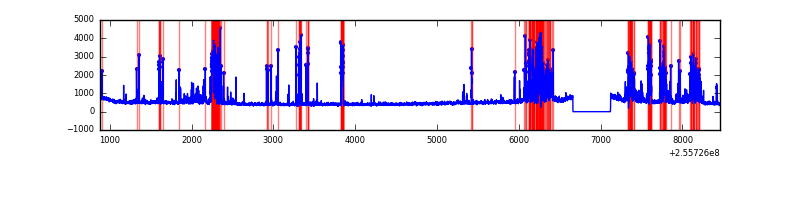 |
| C | 7579 | 7120 | 5 | 5 | 0.07% | 0.07% | 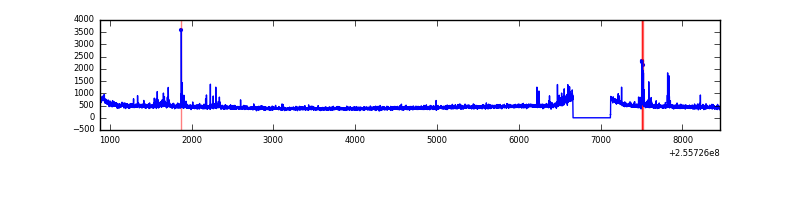 |
| D | 7579 | 7120 | 932 | 932 | 12.30% | 13.09% | 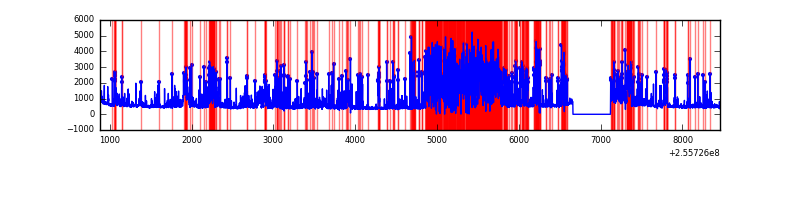 |
Top three noisy pixels from each quadrant. If the there are fewer than three noisy pixels in the level2.evt file, extra rows are filled as -1
| Pixel properties | Quadrant properties | ||||||
|---|---|---|---|---|---|---|---|
| Quadrant | DetID | PixID | Counts | Sigma | Mean | Median | Sigma |
| A | 12 | 189 | 95890 | 570.52 | 827 | 809 | 166.7 |
| A | 15 | 222 | 47837 | 282.18 | 827 | 809 | 166.7 |
| A | 9 | 143 | 26477 | 154.02 | 827 | 809 | 166.7 |
| B | 4 | 239 | 1375477 | 9022.47 | 807 | 786 | 152.4 |
| B | 0 | 219 | 116987 | 762.66 | 807 | 786 | 152.4 |
| B | 3 | 209 | 23952 | 152.04 | 807 | 786 | 152.4 |
| C | 15 | 208 | 120178 | 636.42 | 813 | 815 | 187.6 |
| C | 13 | 61 | 5925 | 27.25 | 813 | 815 | 187.6 |
| C | 8 | 222 | 2318 | 8.01 | 813 | 815 | 187.6 |
| D | 1 | 52 | 3535705 | 20869.78 | 711 | 688 | 169.4 |
| D | 8 | 195 | 324848 | 1913.75 | 711 | 688 | 169.4 |
| D | 7 | 80 | 225089 | 1324.8 | 711 | 688 | 169.4 |
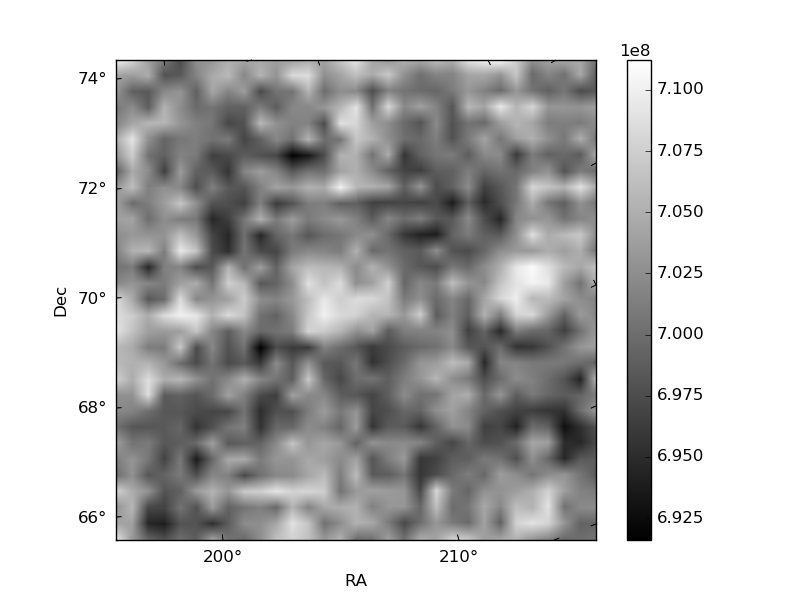
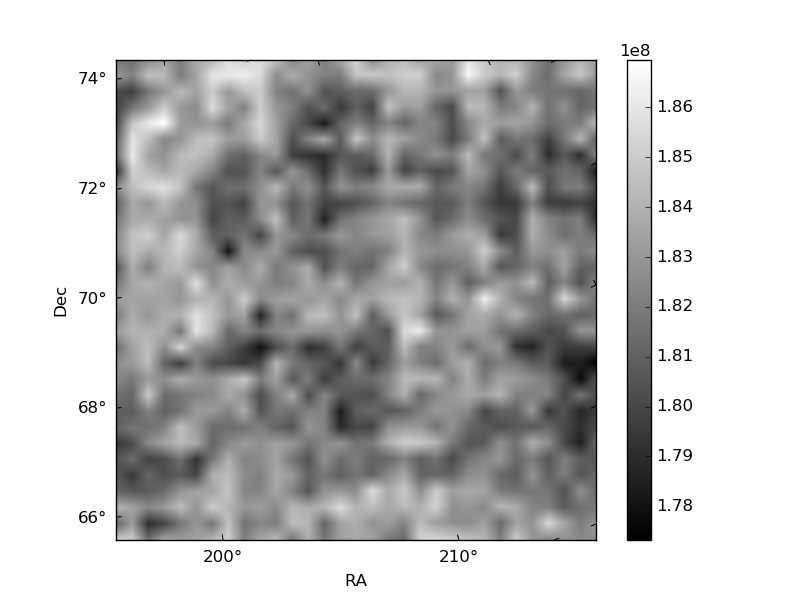
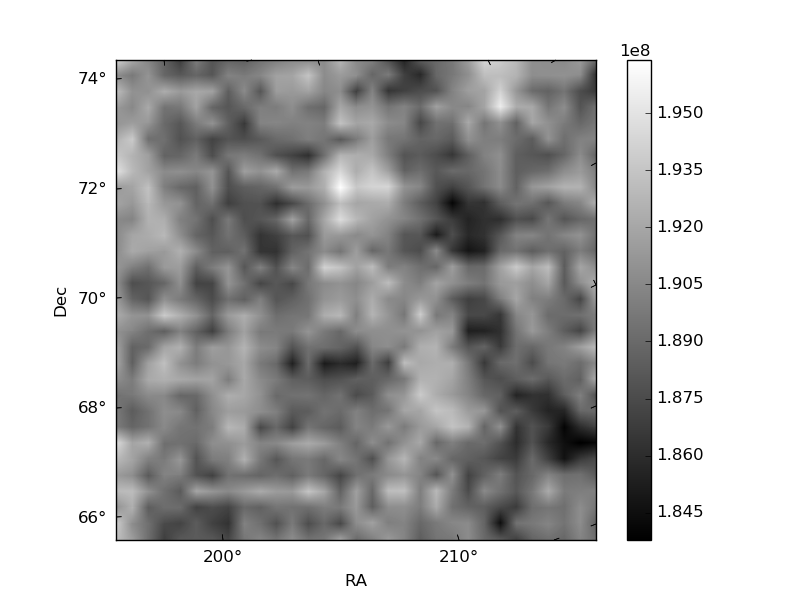
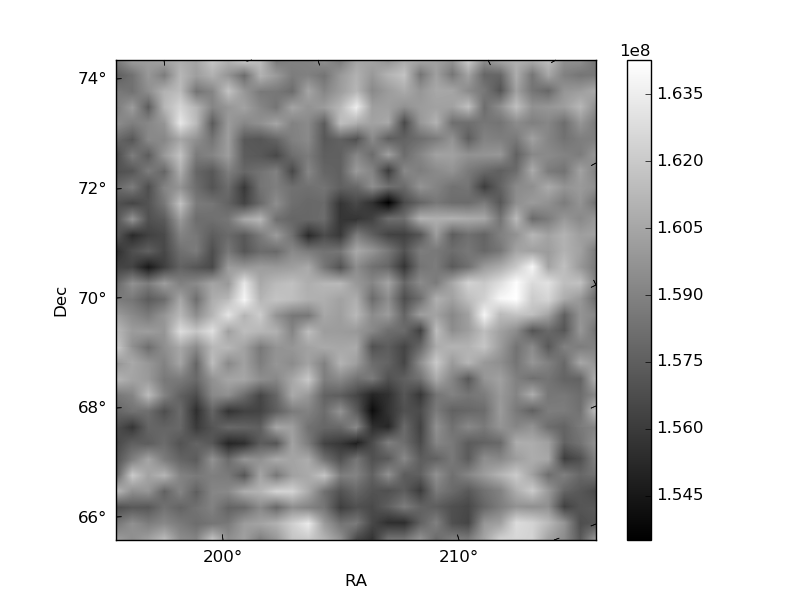
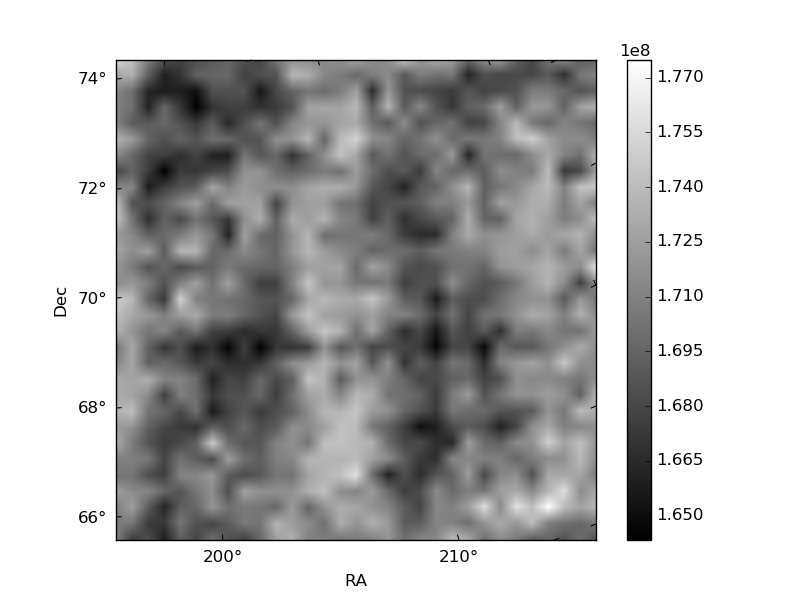
Histogram calculated using DETX and DETY for each event in the final _common_clean file
| Quadrant A | 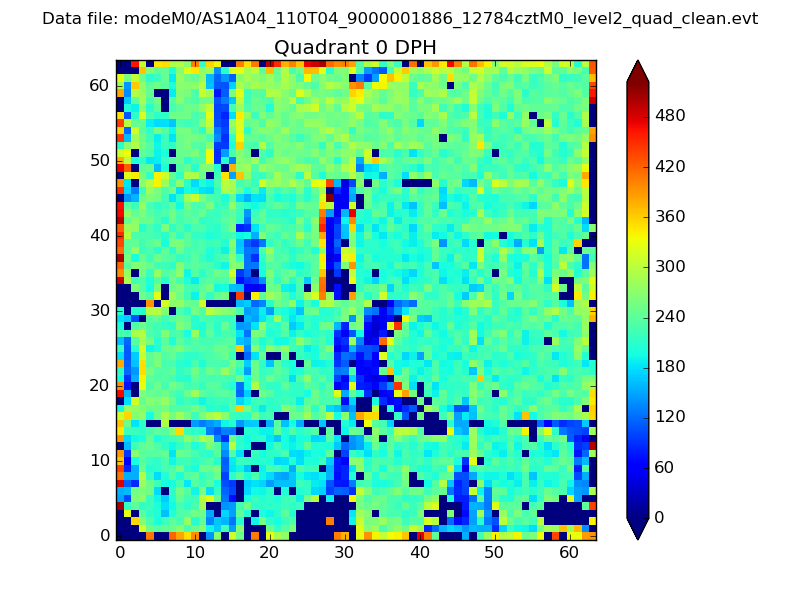 |
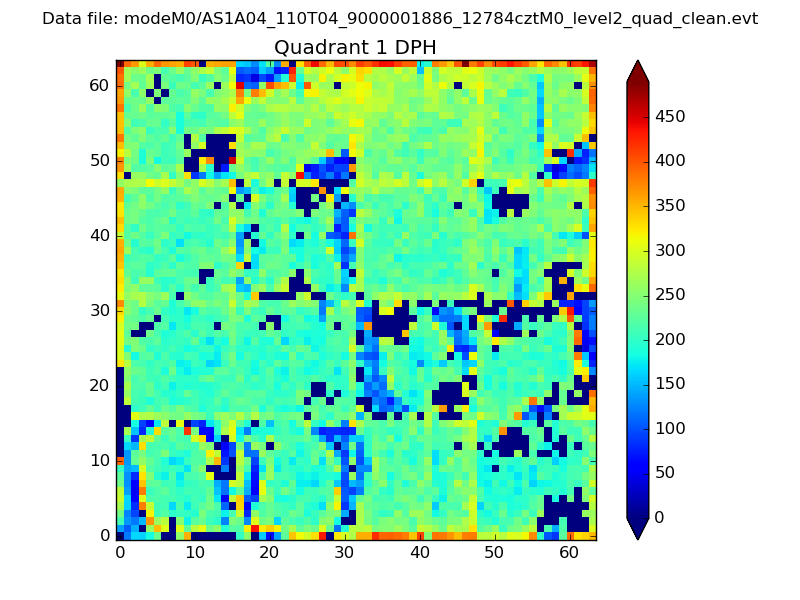 |
Quadrant B |
|---|---|---|---|
| Quadrant D | 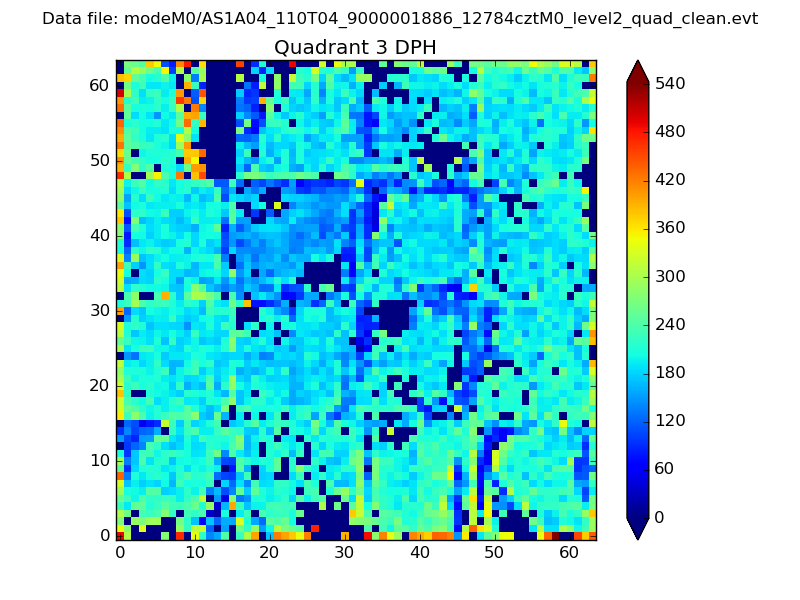 |
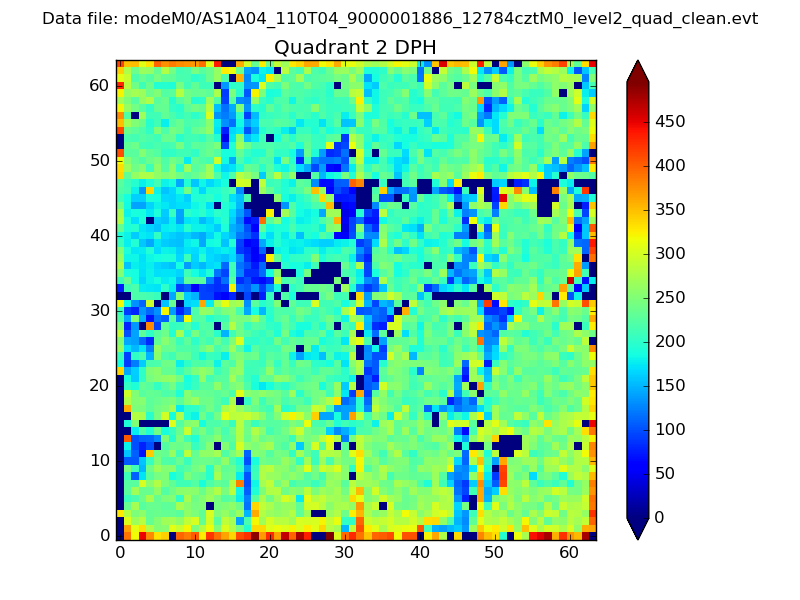 |
Quadrant C |
| Plot type | Count rate plots | Images |
|---|---|---|
| Comparison with Poisson distribution Blue bars denote a histogram of data divided into 1 sec bins. Red curve is a Poisson curve with rate = median count rate of data. |
 |
 |
| Quadrant-wise count rates Data is divided into 100 sec bins |
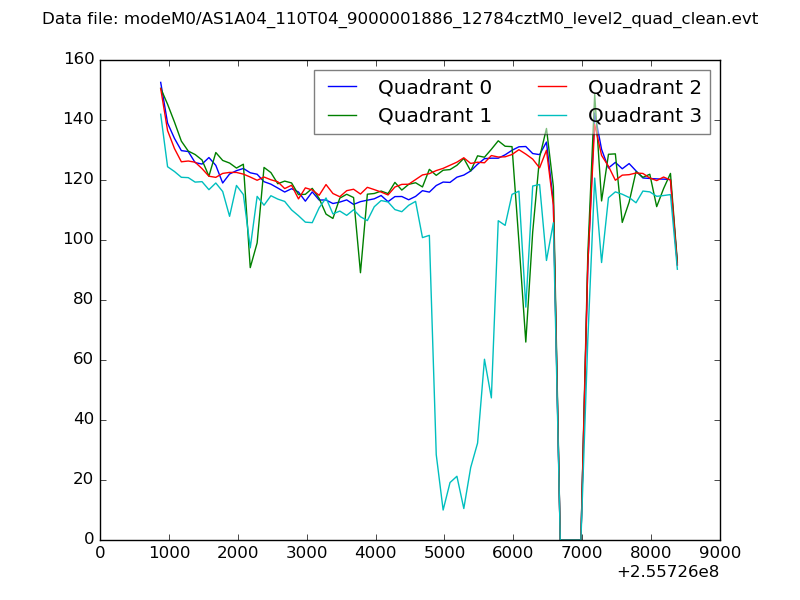 |
|
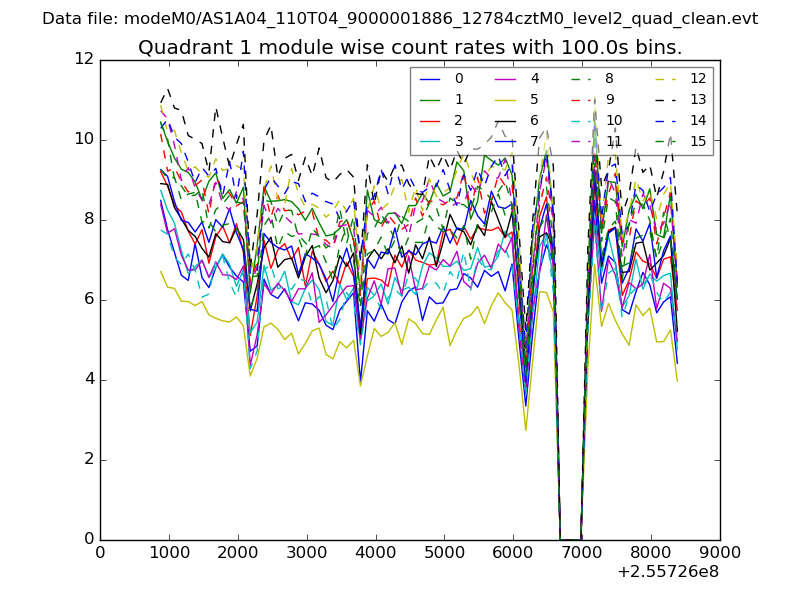
| Module-wise count rates for Quadrant A Data is divided into 100 sec bins |
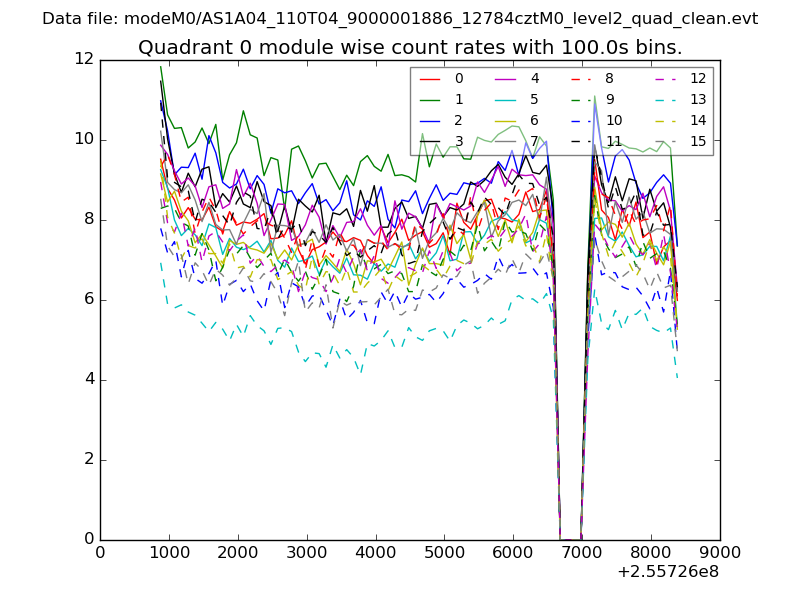 |
 |
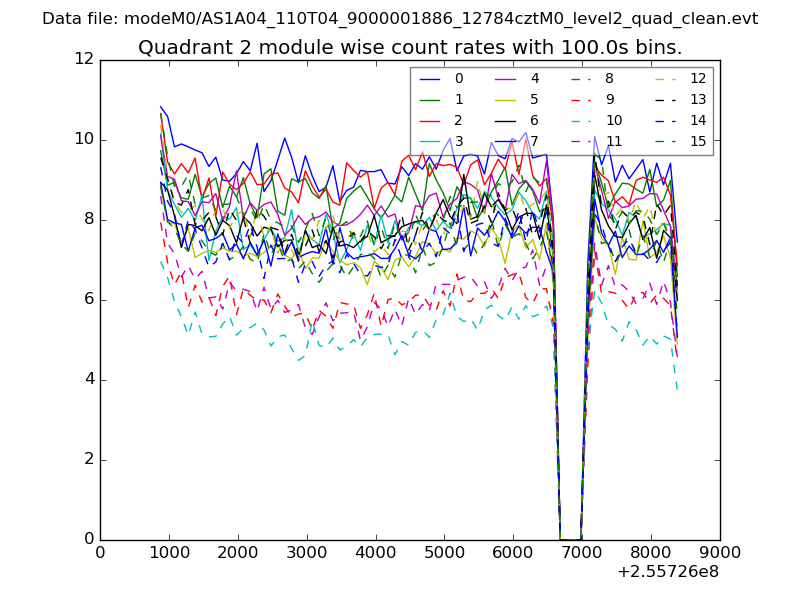
| Module-wise count rates for Quadrant B Data is divided into 100 sec bins |
 |
 |
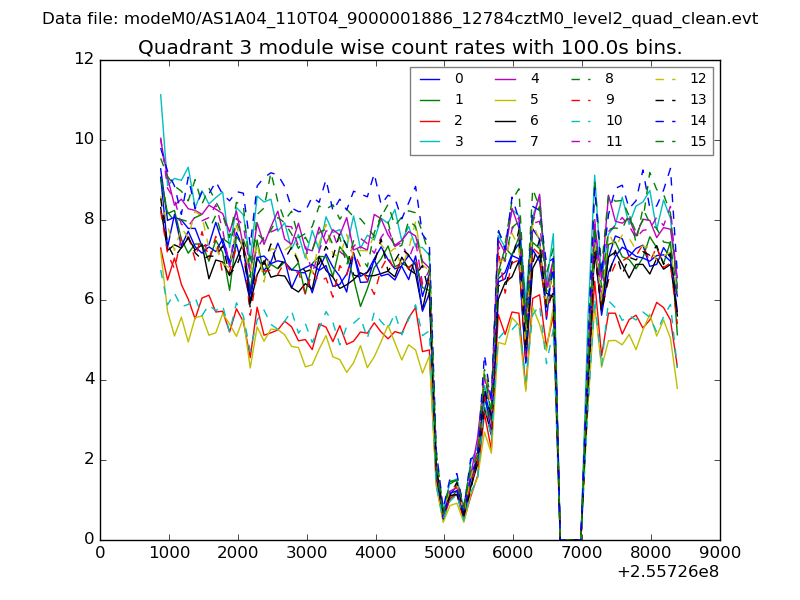
| Module-wise count rates for Quadrant C Data is divided into 100 sec bins |
 |
 |
| Module-wise count rates for Quadrant D Data is divided into 100 sec bins |
 |
 |
| Parameter | Plot |
|---|---|
| CZT HV Monitor | 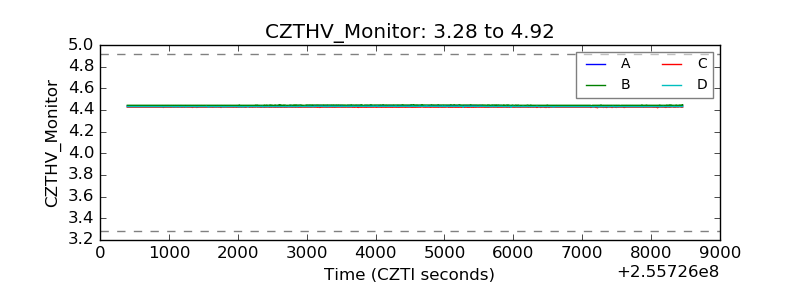 |
| D_VDD | 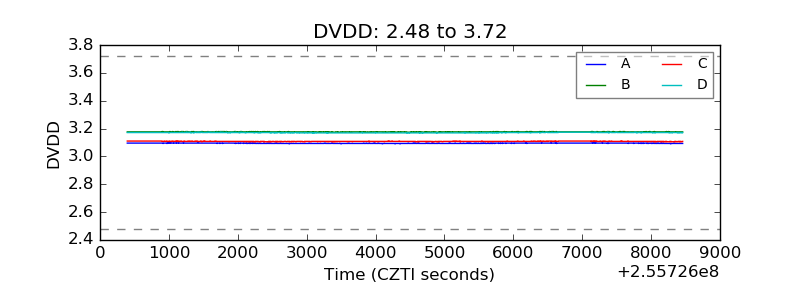 |
| Temperature 1 | 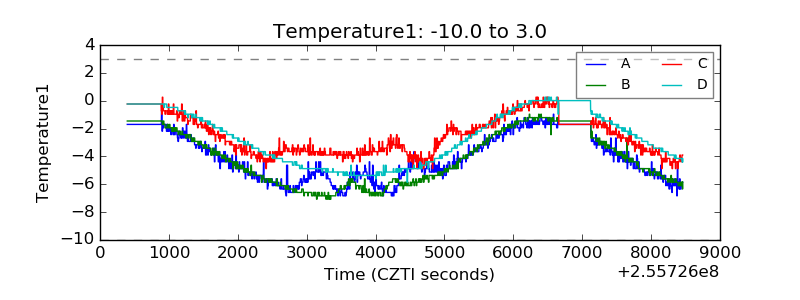 |
| Veto HV Monitor |  |
| Veto LLD | 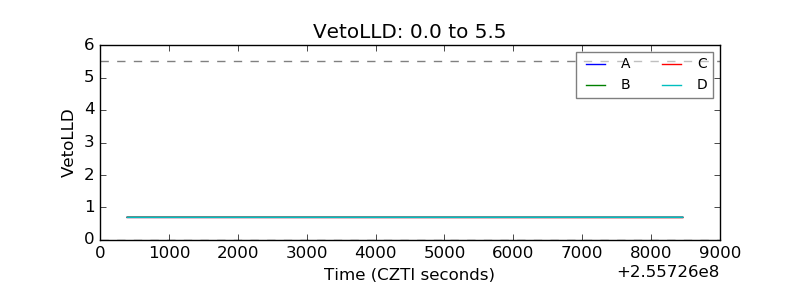 |
| Alpha Counter | 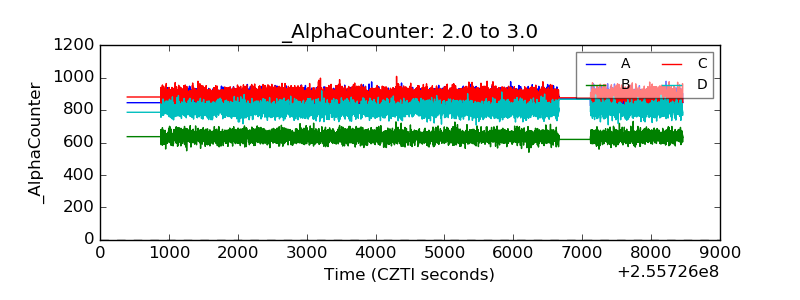 |
| _CPM_Rate | 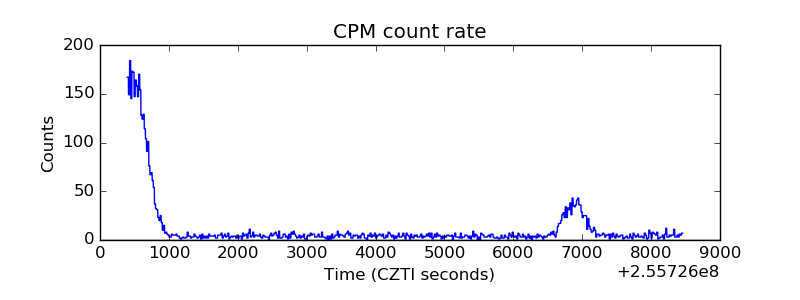 |
| CZT Counter | 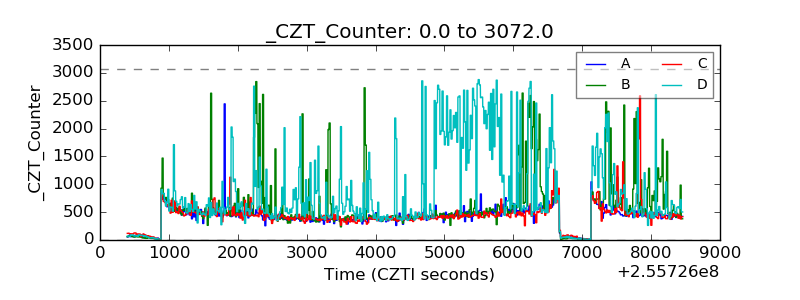 |
| +2.5 Volts monitor |  |
| +5 Volts monitor |  |
| _ROLL_ROT | 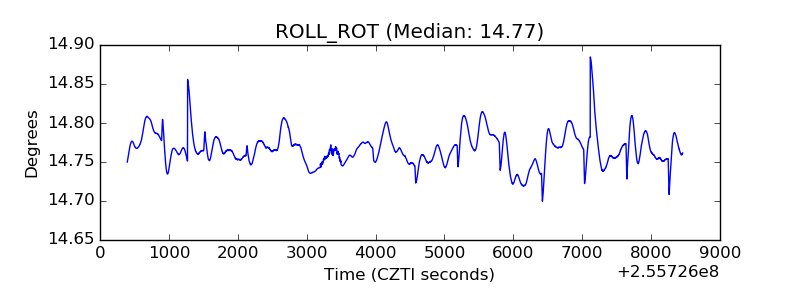 |
| _Roll_DEC | 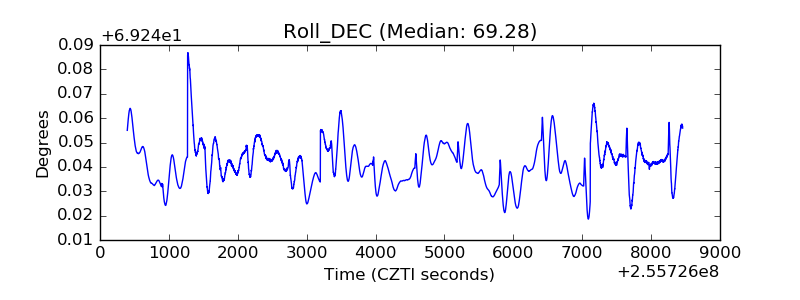 |
| _Roll_RA | 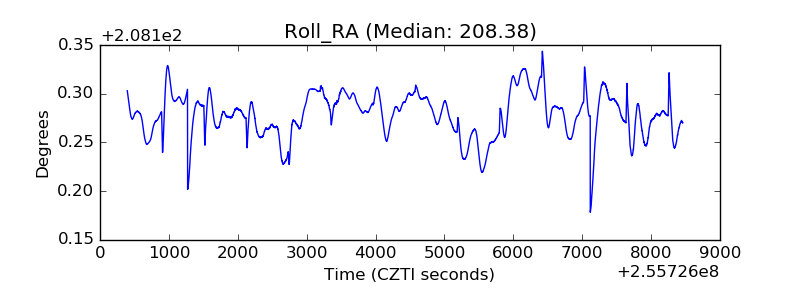 |
| Veto Counter | 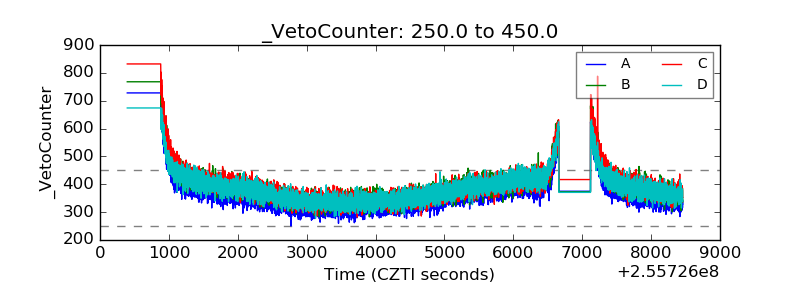 |