| Param | Original file | Final file |
|---|---|---|
| Filename | modeM0/AS1A04_110T04_9000001886_12785cztM0_level2.evt | modeM0/AS1A04_110T04_9000001886_12785cztM0_level2_quad_clean.evt |
| Size (bytes) | 594,028,800 | 139,861,440 |
| Size | 566.5 MB | 133.4 MB |
| Events in quadrant A | 3,754,763 | 938,213 |
| Events in quadrant B | 4,809,950 | 940,404 |
| Events in quadrant C | 3,570,766 | 940,706 |
| Events in quadrant D | 5,329,345 | 878,011 |
| Mode SS | |||
|---|---|---|---|
| Quadrant | BADHDUFLAG | Total packets | Discarded packets |
| A | 0 | 160 | 0 |
| B | 0 | 160 | 0 |
| C | 0 | 160 | 0 |
| D | 0 | 160 | 0 |
| Mode M0 | |||
|---|---|---|---|
| Quadrant | BADHDUFLAG | Total packets | Discarded packets |
| A | 0 | 16745 | 3 |
| B | 0 | 19636 | 2 |
| C | 0 | 16263 | 2 |
| D | 0 | 21233 | 2 |
| Mode M9 | |||
|---|---|---|---|
| Quadrant | BADHDUFLAG | Total packets | Discarded packets |
| A | 0 | 7 | 0 |
| B | 0 | 7 | 0 |
| C | 0 | 7 | 0 |
| D | 0 | 7 | 0 |
| Quadrant | Total seconds | Saturated seconds | Saturation percentage |
|---|---|---|---|
| A | 7742 | 79 | 1.020408% |
| B | 7742 | 399 | 5.153707% |
| C | 7742 | 71 | 0.917076% |
| D | 7742 | 455 | 5.877034% |
Noise dominated data is calculated using 1-second bins in cleaned event files. If a bin has >2000 counts, and if more than 50% of those come from <1% of pixels, then it is considered to be noise-dominated and hence unusable.
| Quadrant | # 1 sec bins | Bins with >0 counts | Bins with >2000 counts | High rate bins dominated by noise | Noise dominated (total time) | Noise dominated (detector-on time) | Marked lightcurve |
|---|---|---|---|---|---|---|---|
| A | 8483 | 7745 | 21 | 21 | 0.25% | 0.27% | 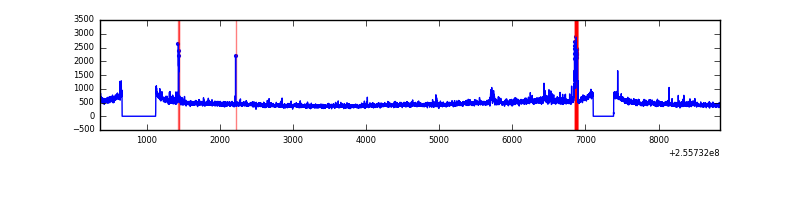 |
| B | 8483 | 7745 | 201 | 201 | 2.37% | 2.60% | 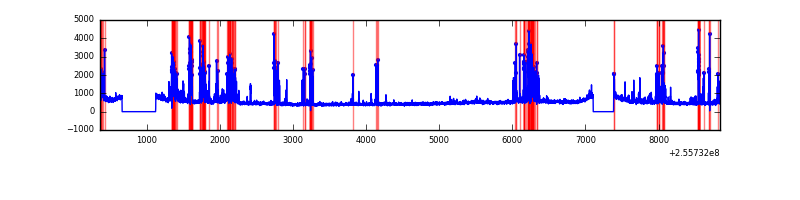 |
| C | 8483 | 7745 | 5 | 5 | 0.06% | 0.06% | 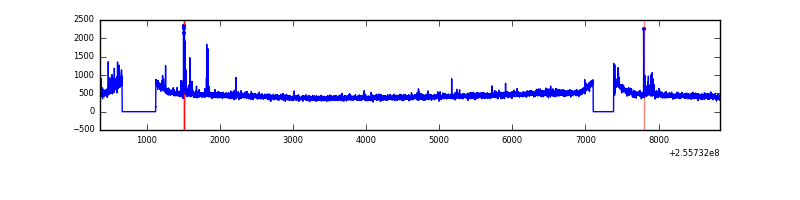 |
| D | 8483 | 7745 | 273 | 273 | 3.22% | 3.52% | 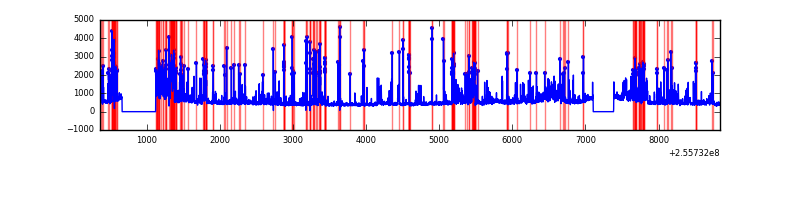 |
Top three noisy pixels from each quadrant. If the there are fewer than three noisy pixels in the level2.evt file, extra rows are filled as -1
| Pixel properties | Quadrant properties | ||||||
|---|---|---|---|---|---|---|---|
| Quadrant | DetID | PixID | Counts | Sigma | Mean | Median | Sigma |
| A | 12 | 189 | 121617 | 658.52 | 903 | 882 | 183.3 |
| A | 15 | 174 | 84255 | 454.73 | 903 | 882 | 183.3 |
| A | 8 | 15 | 44395 | 237.33 | 903 | 882 | 183.3 |
| B | 4 | 239 | 1066358 | 6254.92 | 897 | 872 | 170.3 |
| B | 0 | 219 | 137722 | 803.38 | 897 | 872 | 170.3 |
| B | 3 | 209 | 23697 | 133.99 | 897 | 872 | 170.3 |
| C | 15 | 208 | 97593 | 468.44 | 888 | 889 | 206.4 |
| C | 13 | 61 | 6479 | 27.08 | 888 | 889 | 206.4 |
| C | 8 | 128 | 4052 | 15.32 | 888 | 889 | 206.4 |
| D | 1 | 52 | 1423735 | 6849.82 | 863 | 835 | 207.7 |
| D | 8 | 195 | 310063 | 1488.62 | 863 | 835 | 207.7 |
| D | 7 | 80 | 166646 | 798.21 | 863 | 835 | 207.7 |
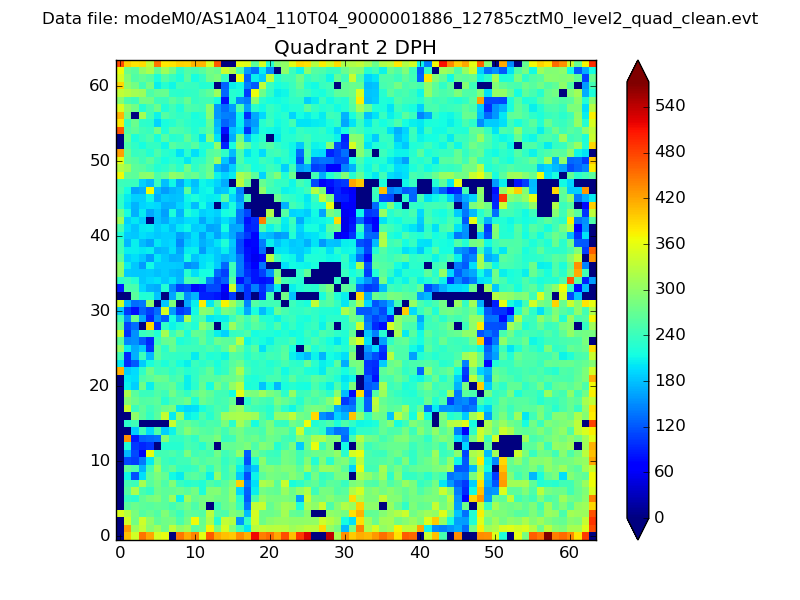
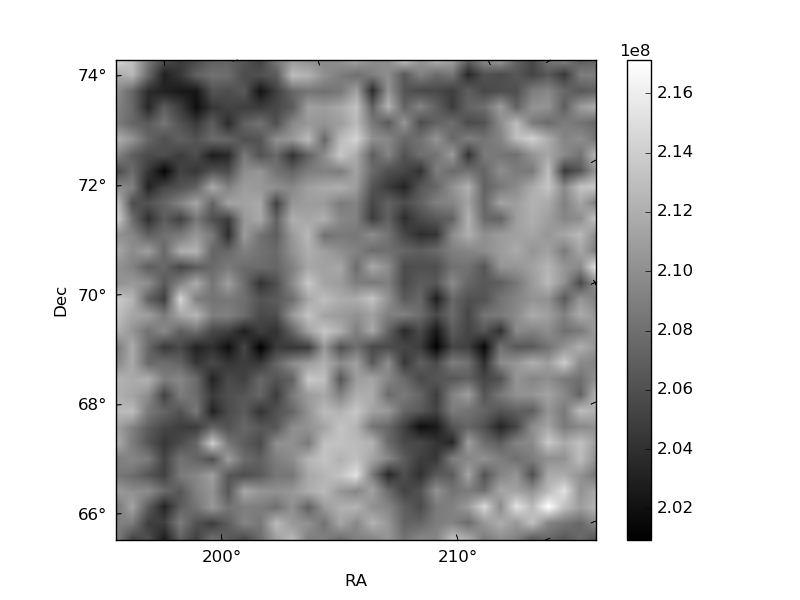
Histogram calculated using DETX and DETY for each event in the final _common_clean file
| Quadrant A | 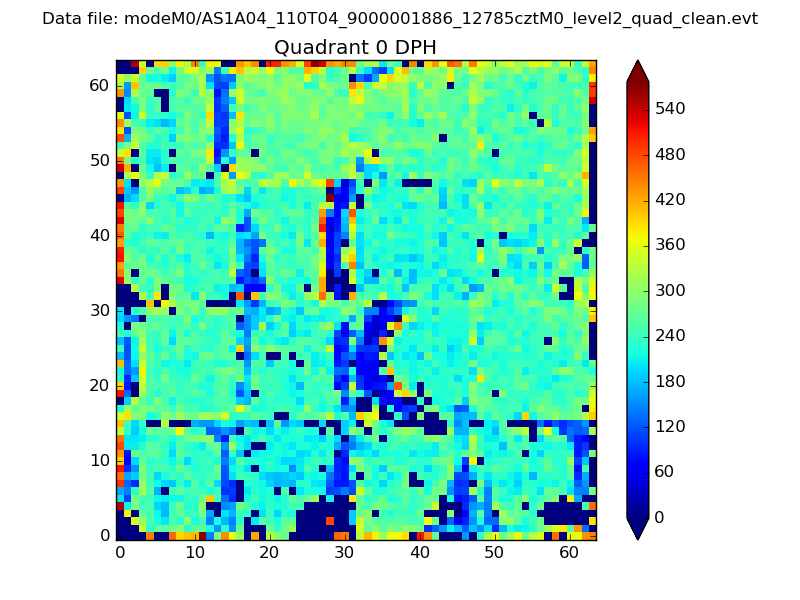 |
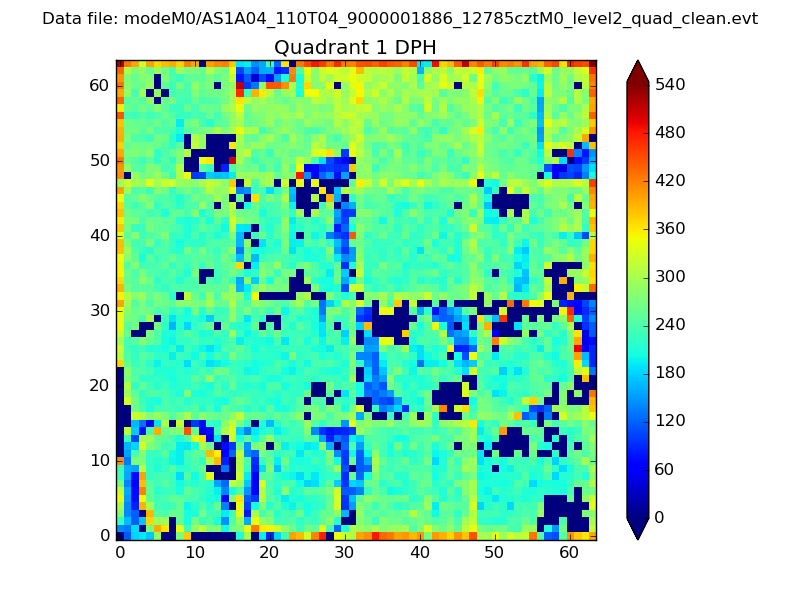 |
Quadrant B |
|---|---|---|---|
| Quadrant D | 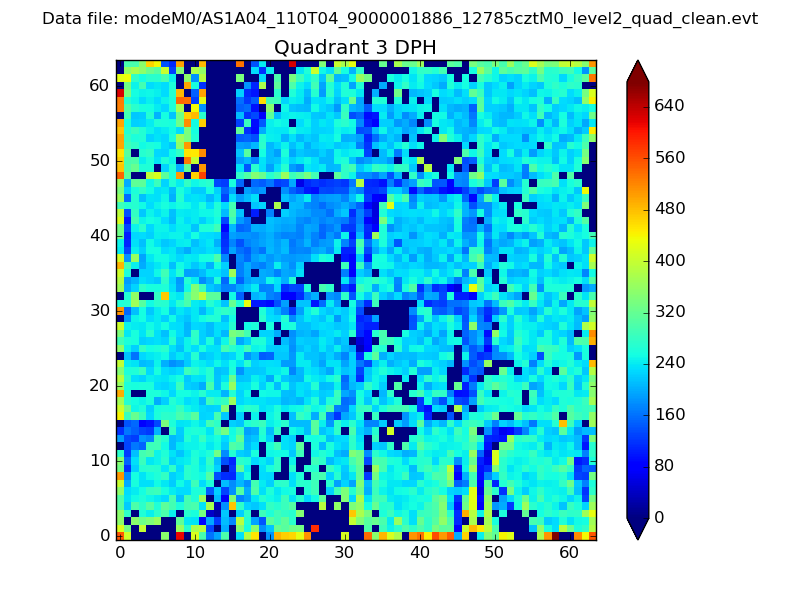 |
 |
Quadrant C |
| Plot type | Count rate plots | Images |
|---|---|---|
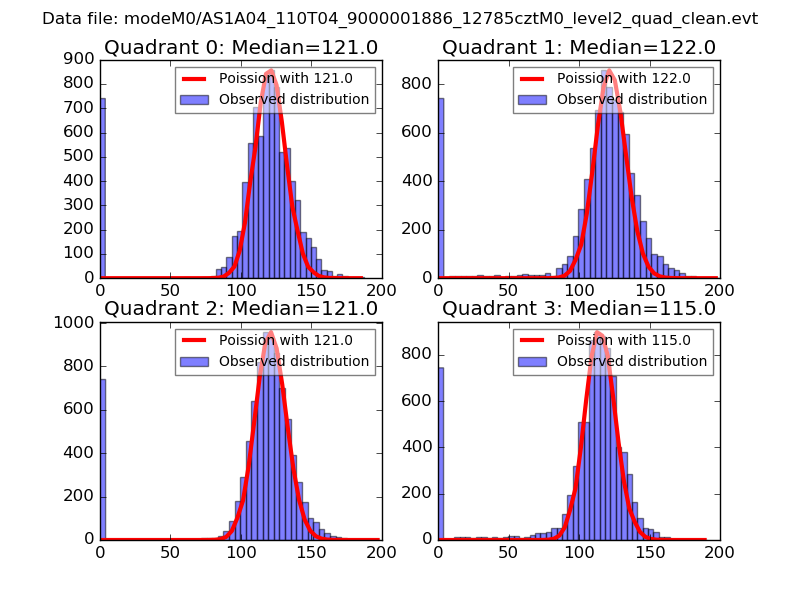
| Comparison with Poisson distribution Blue bars denote a histogram of data divided into 1 sec bins. Red curve is a Poisson curve with rate = median count rate of data. |
 |
 |
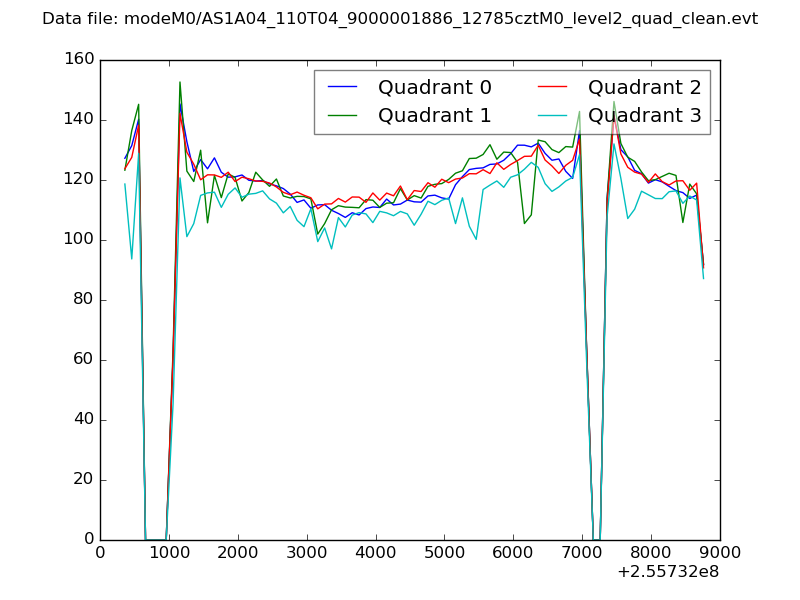
| Quadrant-wise count rates Data is divided into 100 sec bins |
 |
|
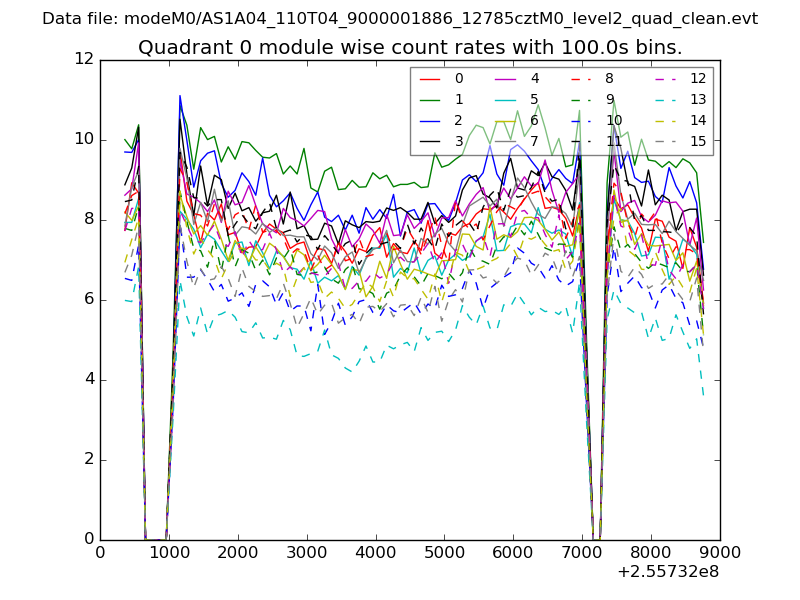
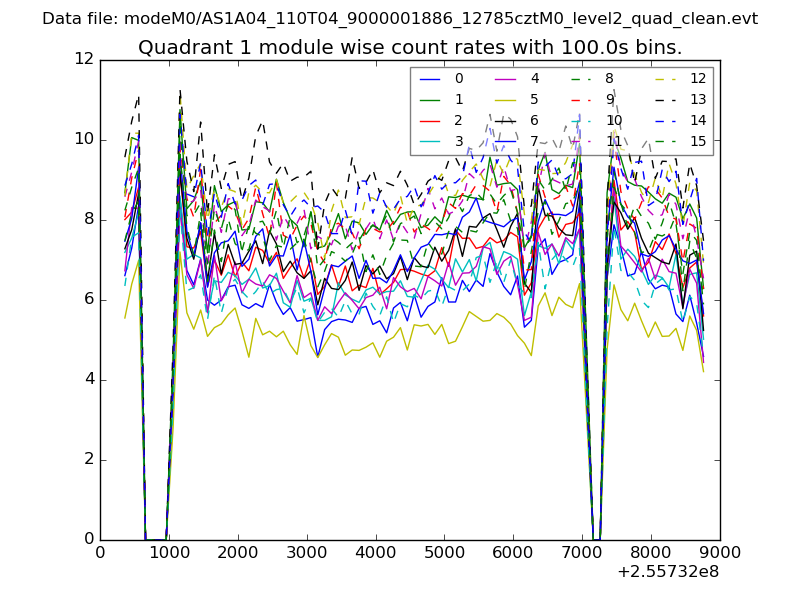
| Module-wise count rates for Quadrant A Data is divided into 100 sec bins |
 |
 |
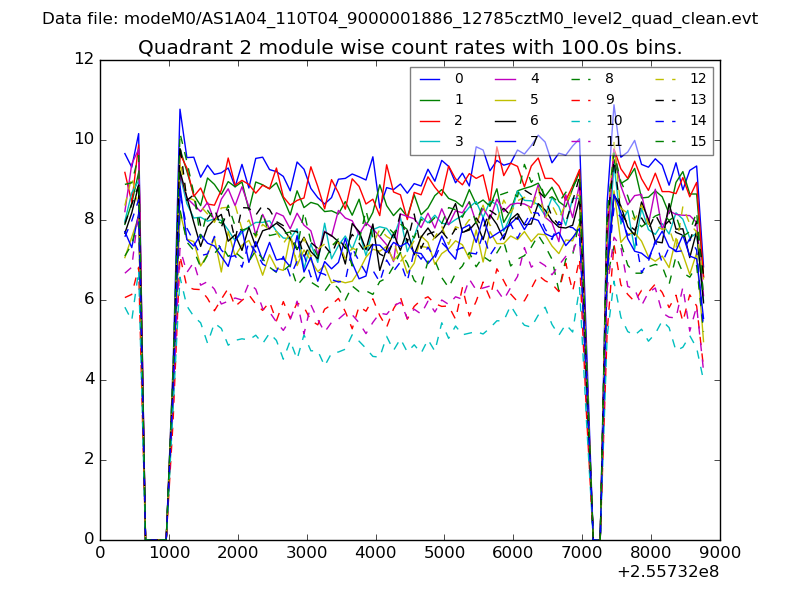
| Module-wise count rates for Quadrant B Data is divided into 100 sec bins |
 |
 |
| Module-wise count rates for Quadrant C Data is divided into 100 sec bins |
 |
 |
| Module-wise count rates for Quadrant D Data is divided into 100 sec bins |
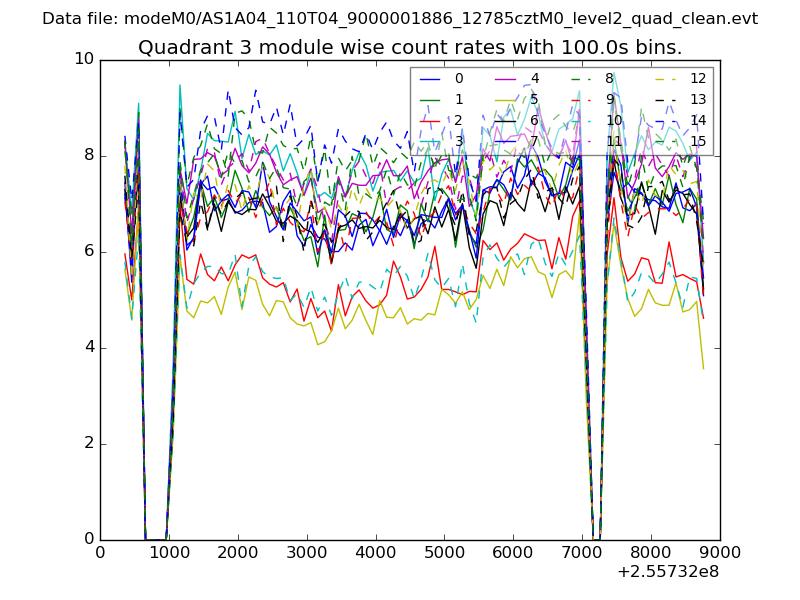 |
 |
| Parameter | Plot |
|---|---|
| CZT HV Monitor | 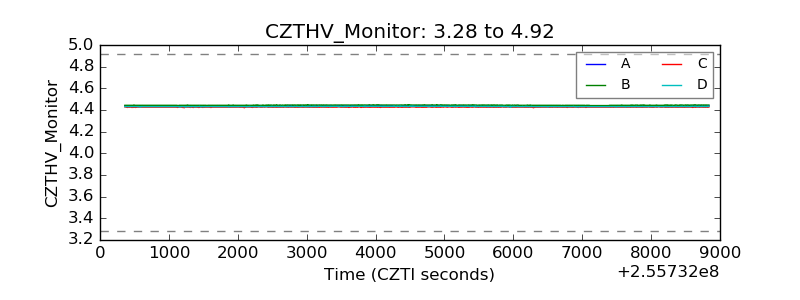 |
| D_VDD |  |
| Temperature 1 | 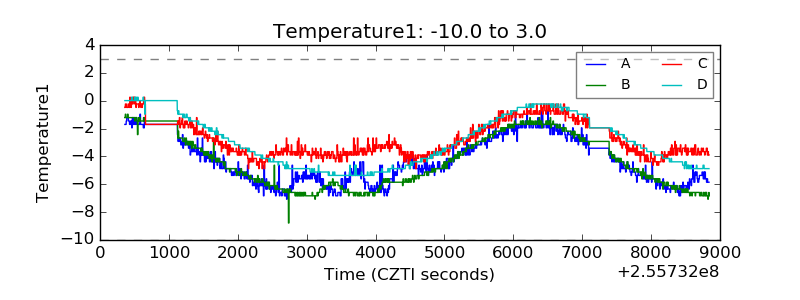 |
| Veto HV Monitor | 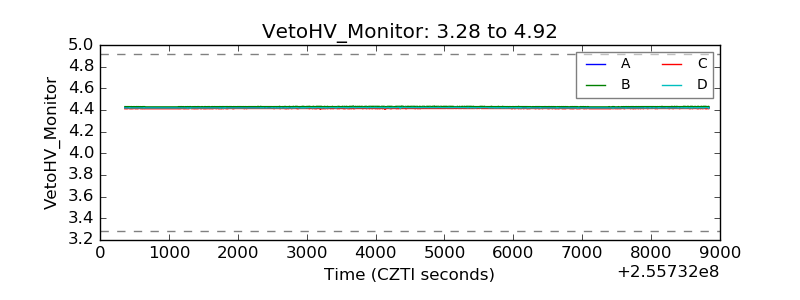 |
| Veto LLD | 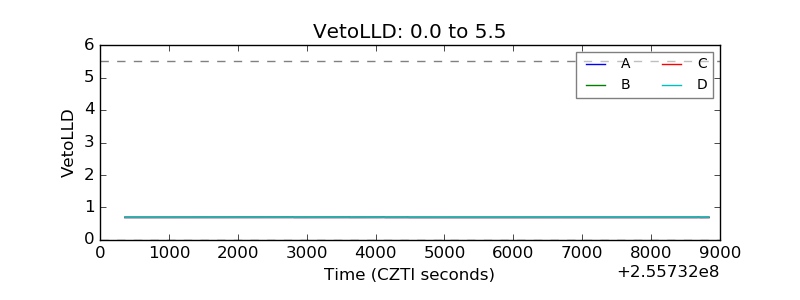 |
| Alpha Counter | 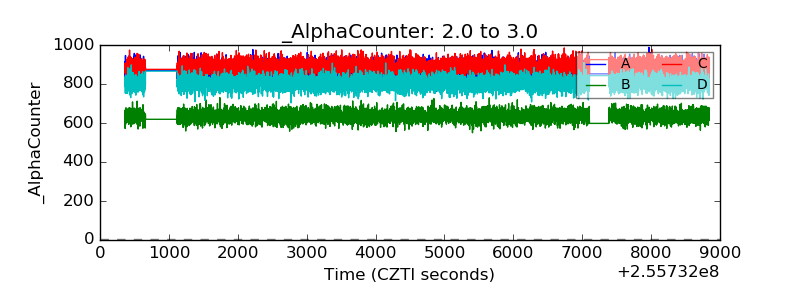 |
| _CPM_Rate | 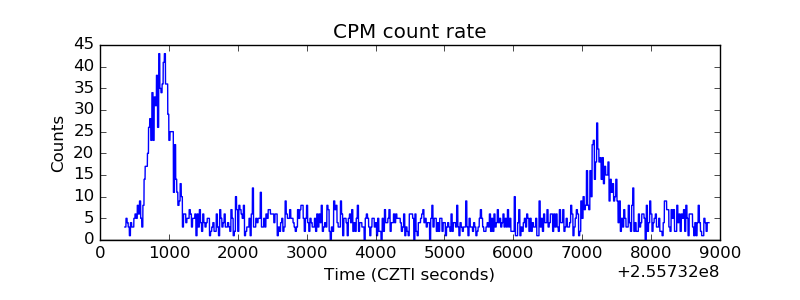 |
| CZT Counter |  |
| +2.5 Volts monitor |  |
| +5 Volts monitor |  |
| _ROLL_ROT | 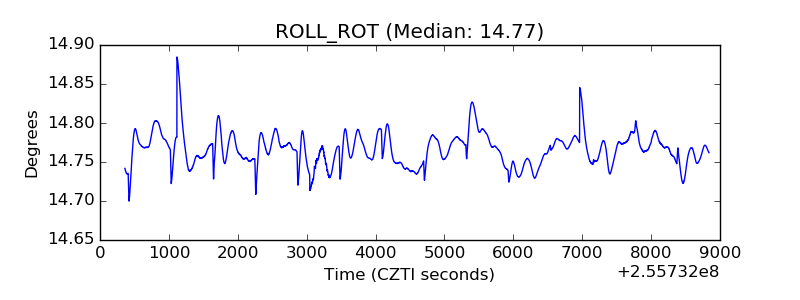 |
| _Roll_DEC | 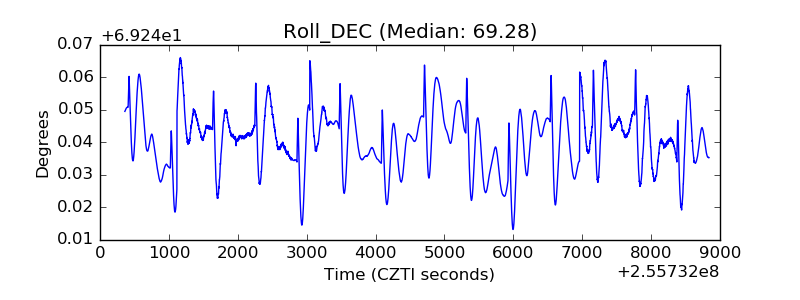 |
| _Roll_RA | 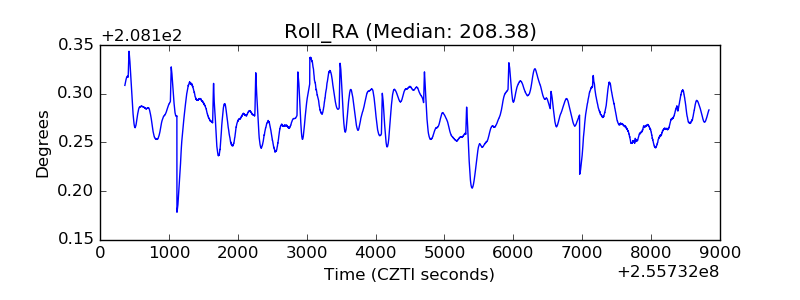 |
| Veto Counter | 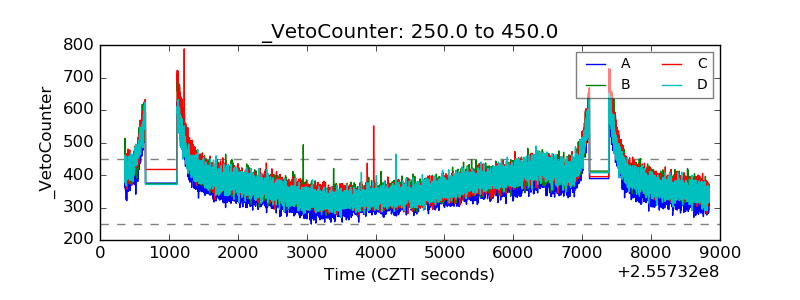 |