| Param | Original file | Final file |
|---|---|---|
| Filename | modeM0/AS1A04_110T04_9000001886_12789cztM0_level2.evt | modeM0/AS1A04_110T04_9000001886_12789cztM0_level2_quad_clean.evt |
| Size (bytes) | 1,318,066,560 | 340,459,200 |
| Size | 1.2 GB | 324.7 MB |
| Events in quadrant A | 8,930,197 | 2,273,857 |
| Events in quadrant B | 10,983,297 | 2,273,815 |
| Events in quadrant C | 8,447,218 | 2,273,618 |
| Events in quadrant D | 10,263,493 | 2,173,635 |
| Mode SS | |||
|---|---|---|---|
| Quadrant | BADHDUFLAG | Total packets | Discarded packets |
| A | 0 | 392 | 0 |
| B | 0 | 392 | 0 |
| C | 0 | 392 | 0 |
| D | 0 | 392 | 0 |
| Mode M0 | |||
|---|---|---|---|
| Quadrant | BADHDUFLAG | Total packets | Discarded packets |
| A | 0 | 39831 | 5 |
| B | 0 | 45719 | 4 |
| C | 0 | 38986 | 4 |
| D | 0 | 43983 | 4 |
| Mode M9 | |||
|---|---|---|---|
| Quadrant | BADHDUFLAG | Total packets | Discarded packets |
| A | 0 | 24 | 0 |
| B | 0 | 24 | 0 |
| C | 0 | 24 | 0 |
| D | 0 | 24 | 0 |
| Quadrant | Total seconds | Saturated seconds | Saturation percentage |
|---|---|---|---|
| A | 19124 | 77 | 0.402635% |
| B | 19124 | 791 | 4.136164% |
| C | 19124 | 52 | 0.271910% |
| D | 19124 | 176 | 0.920310% |
Noise dominated data is calculated using 1-second bins in cleaned event files. If a bin has >2000 counts, and if more than 50% of those come from <1% of pixels, then it is considered to be noise-dominated and hence unusable.
| Quadrant | # 1 sec bins | Bins with >0 counts | Bins with >2000 counts | High rate bins dominated by noise | Noise dominated (total time) | Noise dominated (detector-on time) | Marked lightcurve |
|---|---|---|---|---|---|---|---|
| A | 21605 | 19127 | 6 | 6 | 0.03% | 0.03% | 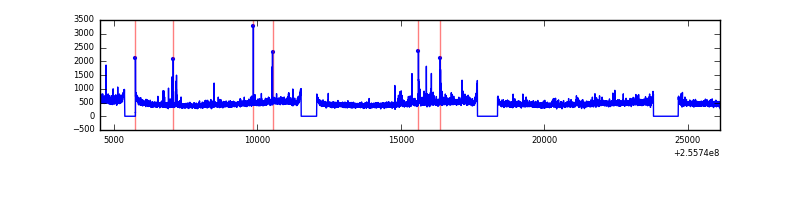 |
| B | 21605 | 19127 | 392 | 392 | 1.81% | 2.05% | 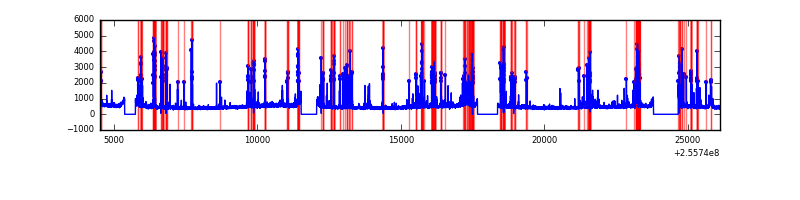 |
| C | 21605 | 19127 | 11 | 11 | 0.05% | 0.06% | 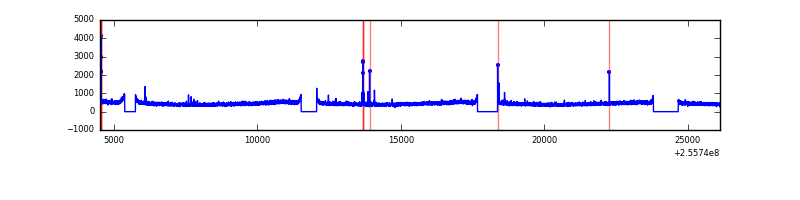 |
| D | 21605 | 19127 | 136 | 136 | 0.63% | 0.71% | 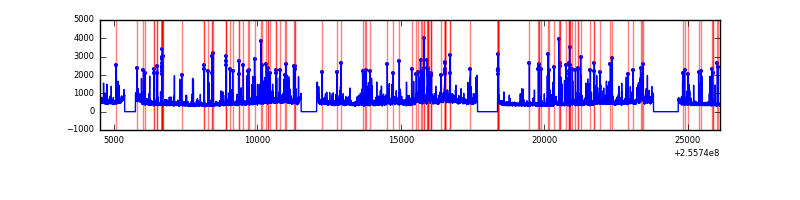 |
Top three noisy pixels from each quadrant. If the there are fewer than three noisy pixels in the level2.evt file, extra rows are filled as -1
| Pixel properties | Quadrant properties | ||||||
|---|---|---|---|---|---|---|---|
| Quadrant | DetID | PixID | Counts | Sigma | Mean | Median | Sigma |
| A | 12 | 189 | 265321 | 595.71 | 2194 | 2142 | 441.8 |
| A | 8 | 15 | 139543 | 311.01 | 2194 | 2142 | 441.8 |
| A | 15 | 174 | 38998 | 83.42 | 2194 | 2142 | 441.8 |
| B | 4 | 239 | 1839011 | 4494.94 | 2165 | 2109 | 408.7 |
| B | 3 | 64 | 233075 | 565.18 | 2165 | 2109 | 408.7 |
| B | 0 | 219 | 160144 | 386.71 | 2165 | 2109 | 408.7 |
| C | 15 | 208 | 110765 | 222.0 | 2132 | 2137 | 489.3 |
| C | 13 | 61 | 15484 | 27.28 | 2132 | 2137 | 489.3 |
| C | 8 | 128 | 13653 | 23.53 | 2132 | 2137 | 489.3 |
| D | 8 | 195 | 1389240 | 2729.52 | 2115 | 2049 | 508.2 |
| D | 13 | 104 | 254406 | 496.55 | 2115 | 2049 | 508.2 |
| D | 7 | 80 | 238317 | 464.9 | 2115 | 2049 | 508.2 |
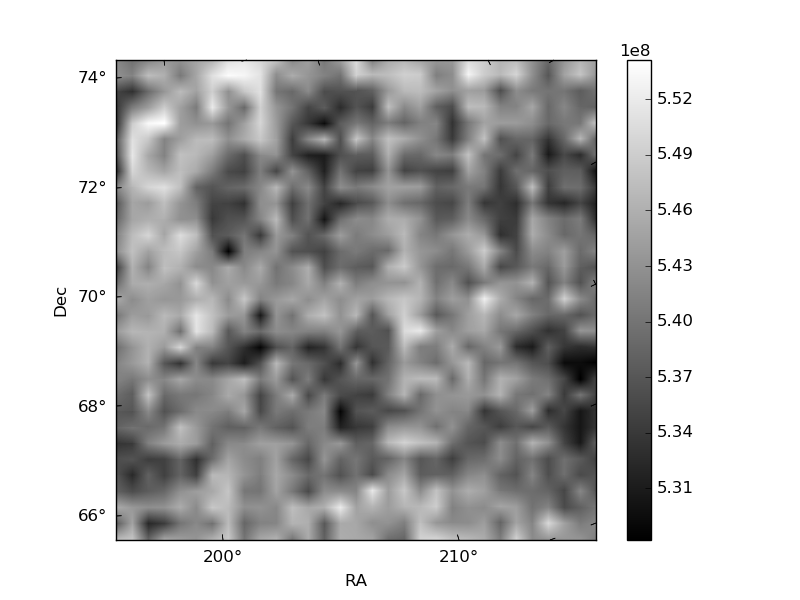
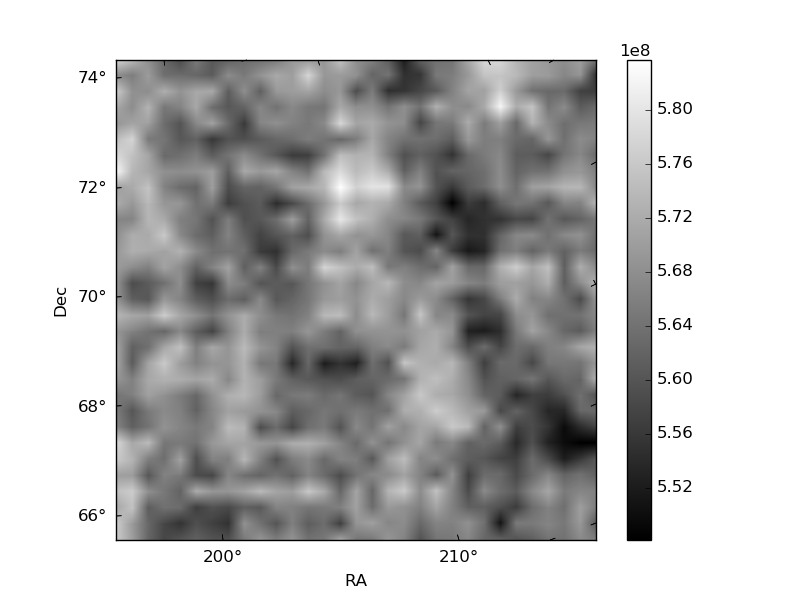
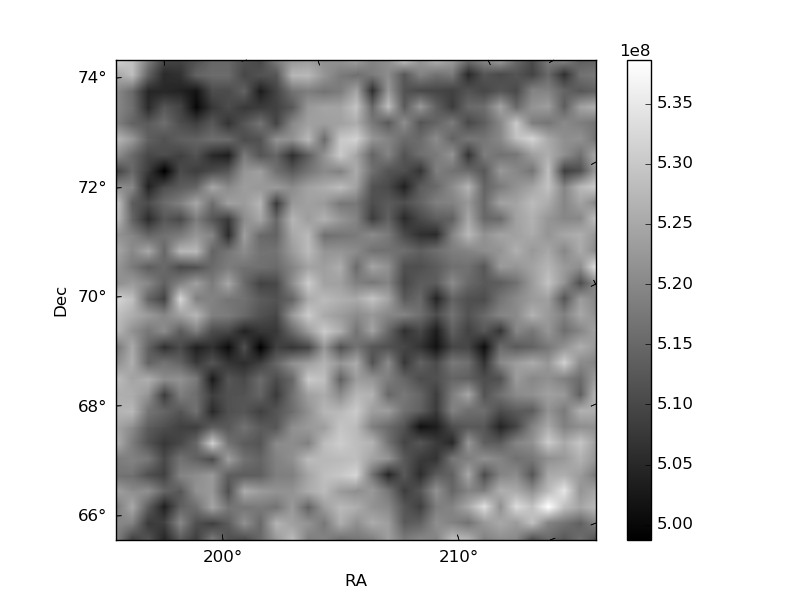
Histogram calculated using DETX and DETY for each event in the final _common_clean file
| Quadrant A | 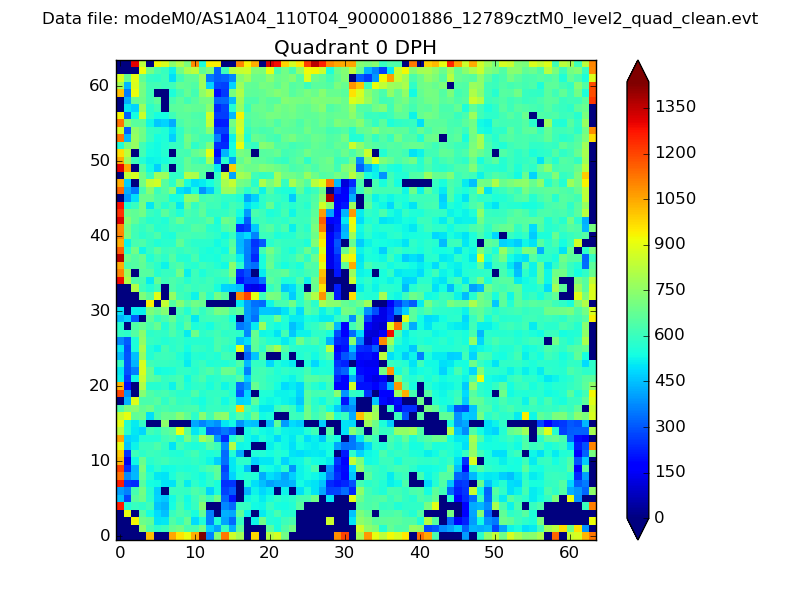 |
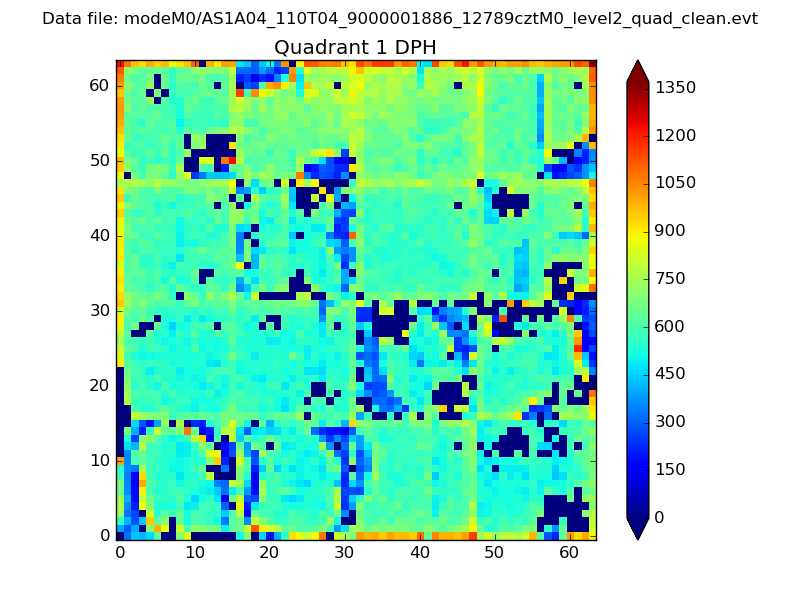 |
Quadrant B |
|---|---|---|---|
| Quadrant D | 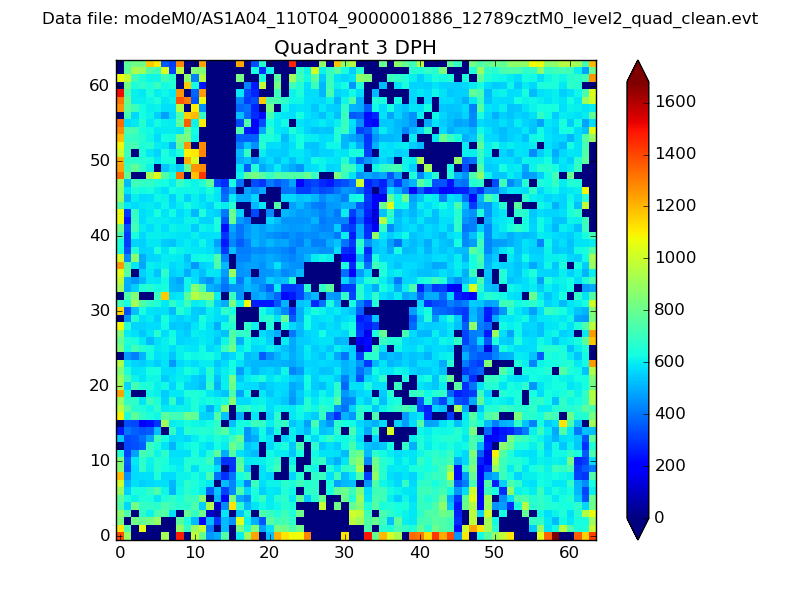 |
 |
Quadrant C |
| Plot type | Count rate plots | Images |
|---|---|---|
| Comparison with Poisson distribution Blue bars denote a histogram of data divided into 1 sec bins. Red curve is a Poisson curve with rate = median count rate of data. |
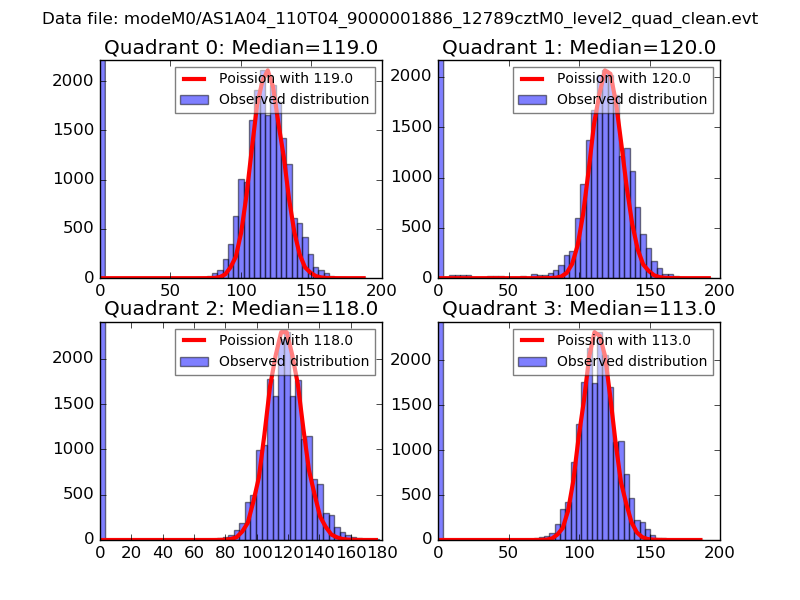 |
 |
| Quadrant-wise count rates Data is divided into 100 sec bins |
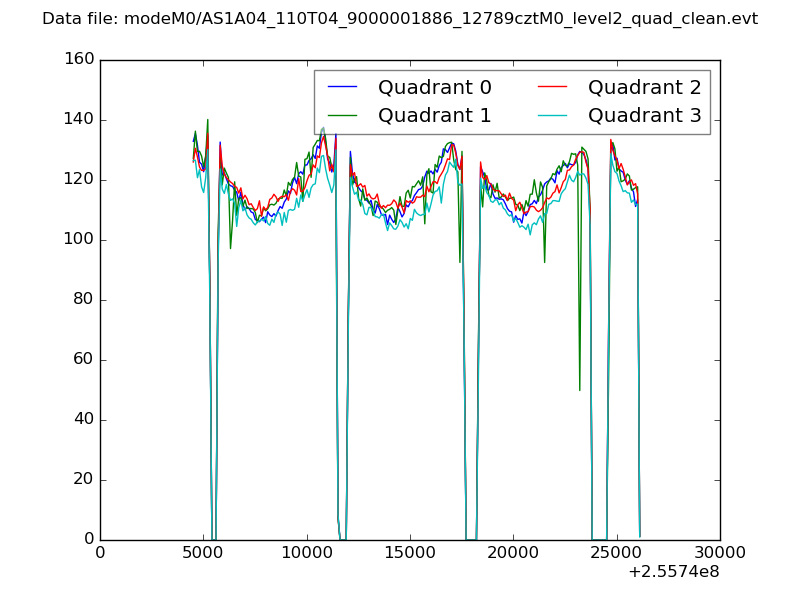 |
|
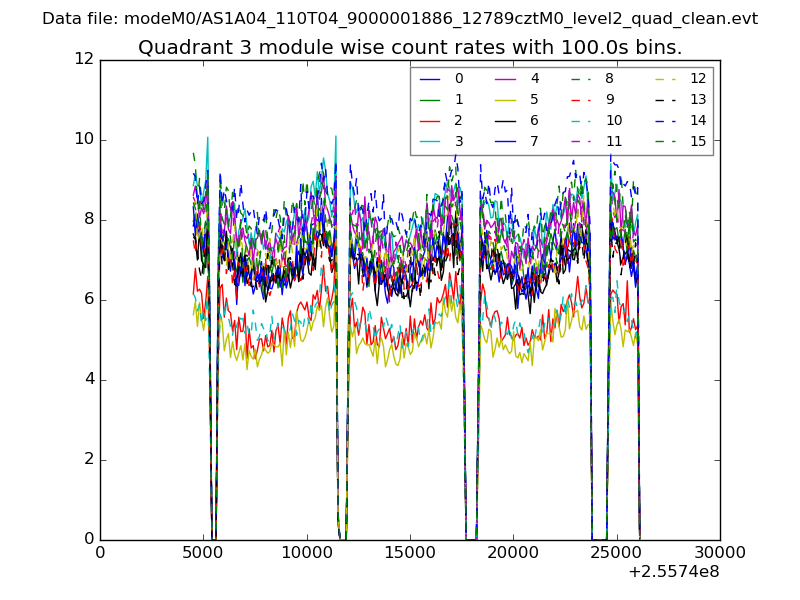
| Module-wise count rates for Quadrant A Data is divided into 100 sec bins |
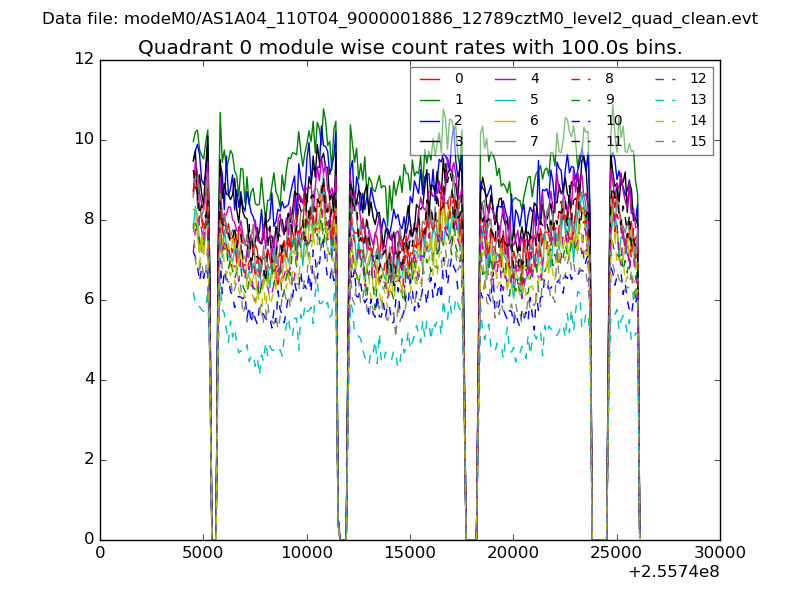 |
 |
| Module-wise count rates for Quadrant B Data is divided into 100 sec bins |
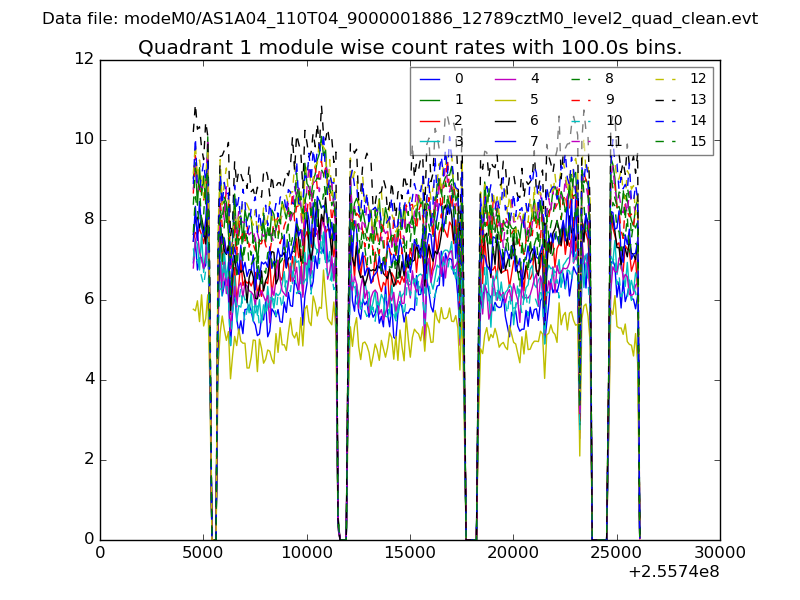 |
 |
| Module-wise count rates for Quadrant C Data is divided into 100 sec bins |
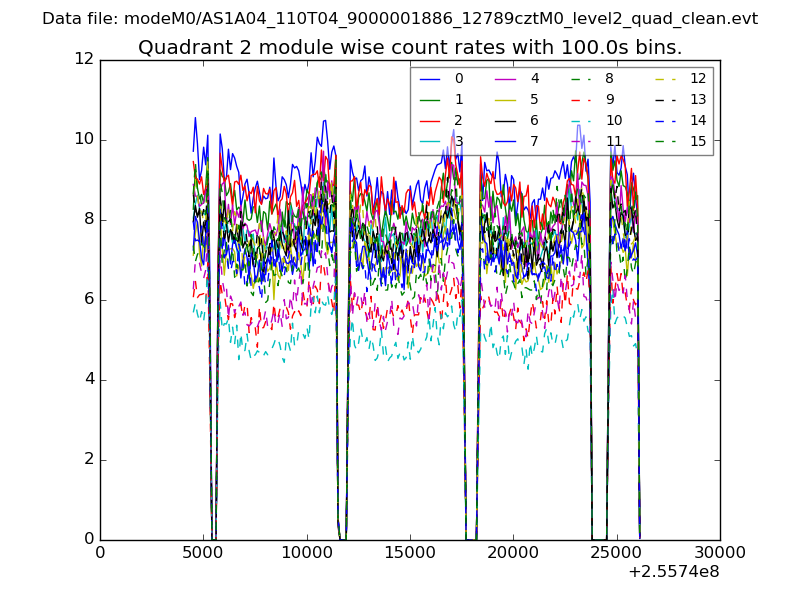 |
 |
| Module-wise count rates for Quadrant D Data is divided into 100 sec bins |
 |
 |
| Parameter | Plot |
|---|---|
| CZT HV Monitor |  |
| D_VDD |  |
| Temperature 1 | 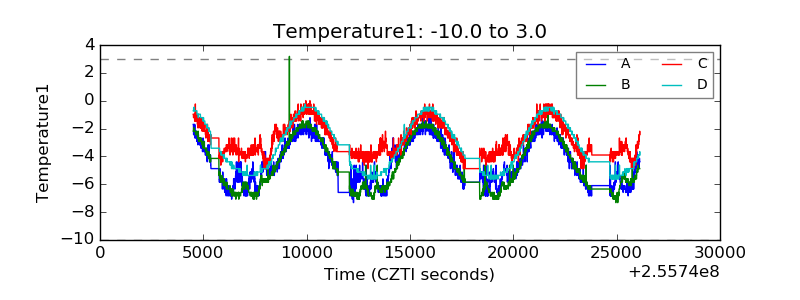 |
| Veto HV Monitor | 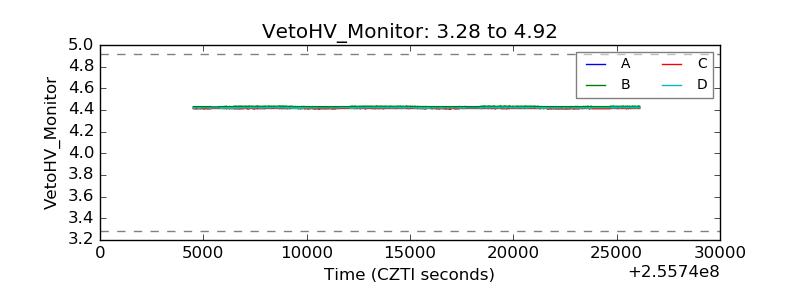 |
| Veto LLD | 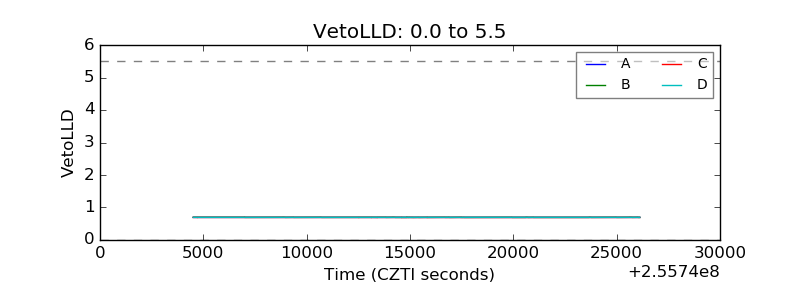 |
| Alpha Counter | 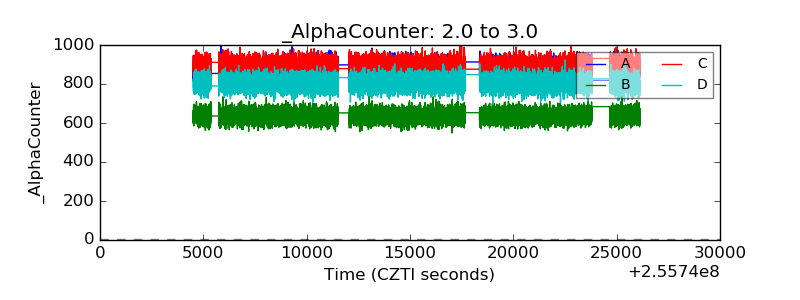 |
| _CPM_Rate | 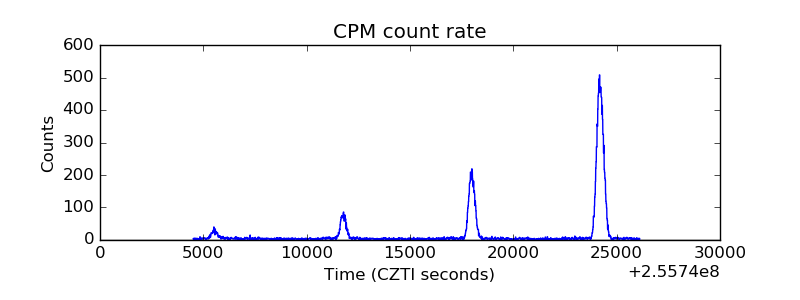 |
| CZT Counter |  |
| +2.5 Volts monitor |  |
| +5 Volts monitor |  |
| _ROLL_ROT | 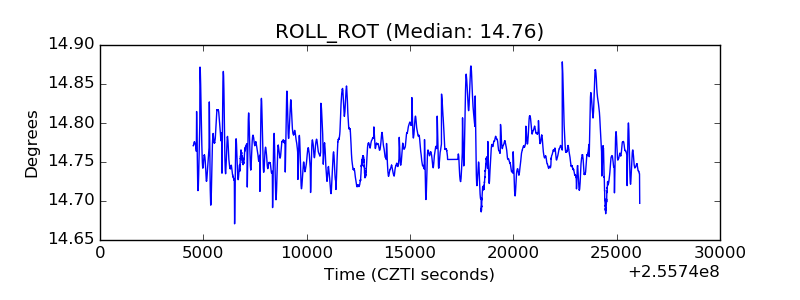 |
| _Roll_DEC | 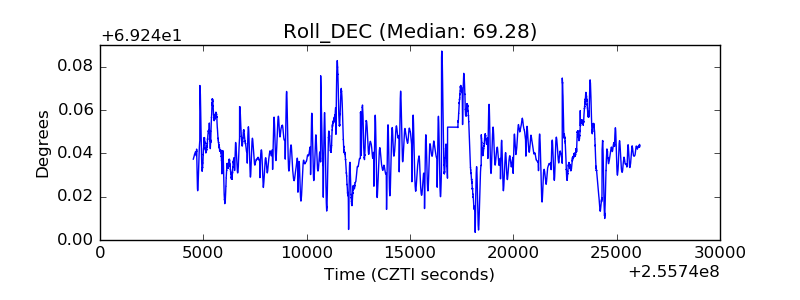 |
| _Roll_RA | 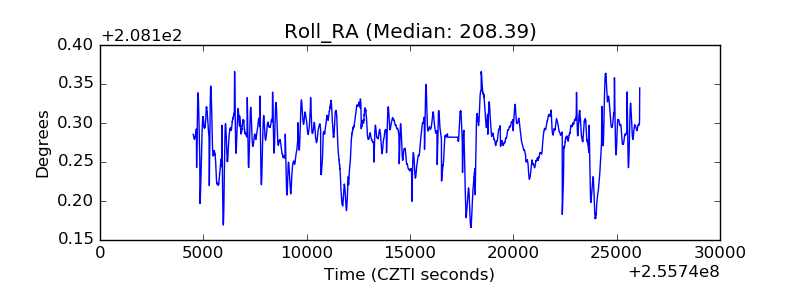 |
| Veto Counter | 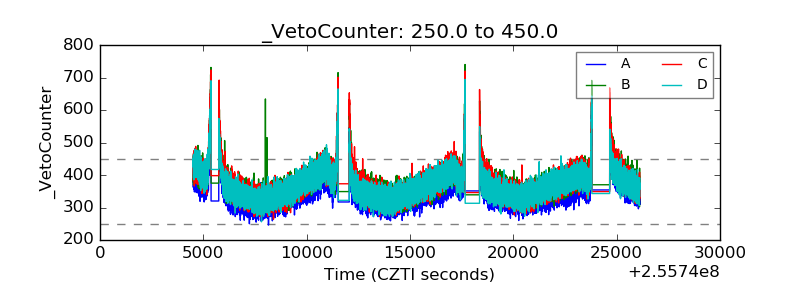 |