| Param | Original file | Final file |
|---|---|---|
| Filename | modeM0/AS1A04_110T04_9000001886_12790cztM0_level2.evt | modeM0/AS1A04_110T04_9000001886_12790cztM0_level2_quad_clean.evt |
| Size (bytes) | 457,519,680 | 109,442,880 |
| Size | 436.3 MB | 104.4 MB |
| Events in quadrant A | 3,098,471 | 734,676 |
| Events in quadrant B | 3,669,040 | 737,007 |
| Events in quadrant C | 2,625,816 | 734,511 |
| Events in quadrant D | 4,051,883 | 686,053 |
| Mode SS | |||
|---|---|---|---|
| Quadrant | BADHDUFLAG | Total packets | Discarded packets |
| A | 0 | 122 | 0 |
| B | 0 | 122 | 0 |
| C | 0 | 122 | 0 |
| D | 0 | 122 | 0 |
| Mode M0 | |||
|---|---|---|---|
| Quadrant | BADHDUFLAG | Total packets | Discarded packets |
| A | 0 | 13179 | 2 |
| B | 0 | 14830 | 1 |
| C | 0 | 12205 | 1 |
| D | 0 | 16193 | 1 |
| Mode M9 | |||
|---|---|---|---|
| Quadrant | BADHDUFLAG | Total packets | Discarded packets |
| A | 0 | 10 | 0 |
| B | 0 | 10 | 0 |
| C | 0 | 10 | 0 |
| D | 0 | 10 | 0 |
| Quadrant | Total seconds | Saturated seconds | Saturation percentage |
|---|---|---|---|
| A | 6047 | 132 | 2.182901% |
| B | 6047 | 299 | 4.944601% |
| C | 6047 | 23 | 0.380354% |
| D | 6047 | 336 | 5.556474% |
Noise dominated data is calculated using 1-second bins in cleaned event files. If a bin has >2000 counts, and if more than 50% of those come from <1% of pixels, then it is considered to be noise-dominated and hence unusable.
| Quadrant | # 1 sec bins | Bins with >0 counts | Bins with >2000 counts | High rate bins dominated by noise | Noise dominated (total time) | Noise dominated (detector-on time) | Marked lightcurve |
|---|---|---|---|---|---|---|---|
| A | 7033 | 6049 | 84 | 84 | 1.19% | 1.39% | 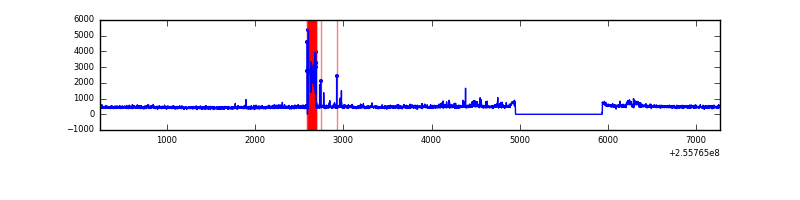 |
| B | 7033 | 6049 | 155 | 155 | 2.20% | 2.56% | 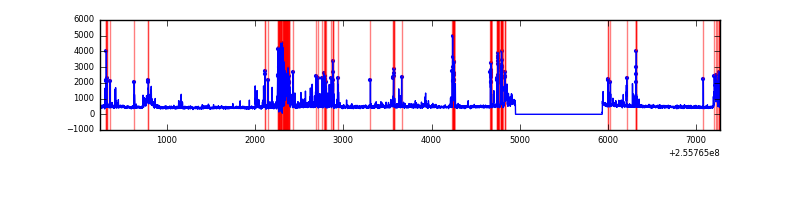 |
| C | 7033 | 6049 | 1 | 1 | 0.01% | 0.02% | 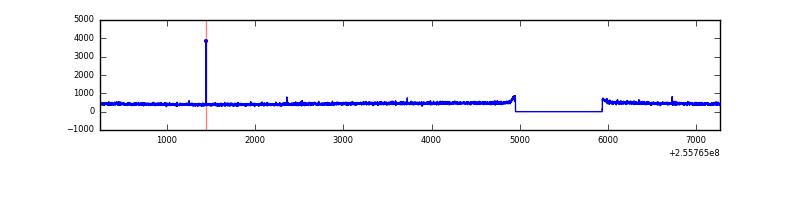 |
| D | 7033 | 6049 | 264 | 264 | 3.75% | 4.36% | 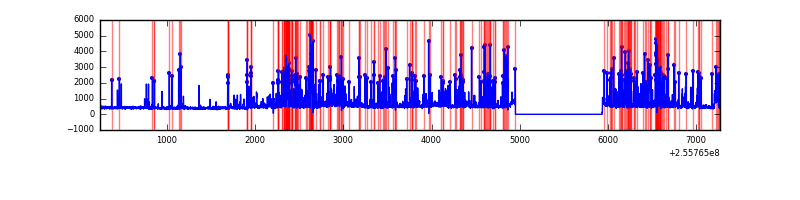 |
Top three noisy pixels from each quadrant. If the there are fewer than three noisy pixels in the level2.evt file, extra rows are filled as -1
| Pixel properties | Quadrant properties | ||||||
|---|---|---|---|---|---|---|---|
| Quadrant | DetID | PixID | Counts | Sigma | Mean | Median | Sigma |
| A | 15 | 174 | 245557 | 1731.52 | 693 | 677 | 141.4 |
| A | 12 | 189 | 149389 | 1051.53 | 693 | 677 | 141.4 |
| A | 8 | 15 | 34972 | 242.5 | 693 | 677 | 141.4 |
| B | 4 | 239 | 892008 | 6867.81 | 685 | 667 | 129.8 |
| B | 3 | 209 | 31462 | 237.28 | 685 | 667 | 129.8 |
| B | 0 | 219 | 22664 | 169.49 | 685 | 667 | 129.8 |
| C | 13 | 61 | 5037 | 28.17 | 672 | 675 | 154.9 |
| C | 14 | 234 | 5002 | 27.94 | 672 | 675 | 154.9 |
| C | 8 | 222 | 2446 | 11.44 | 672 | 675 | 154.9 |
| D | 1 | 52 | 822945 | 5171.85 | 659 | 640 | 159.0 |
| D | 8 | 195 | 633064 | 3977.6 | 659 | 640 | 159.0 |
| D | 7 | 80 | 56354 | 350.41 | 659 | 640 | 159.0 |
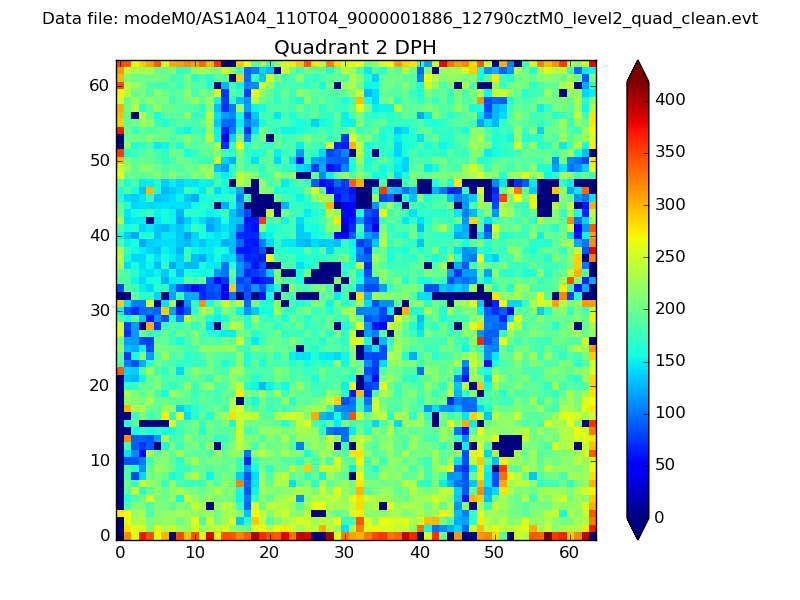
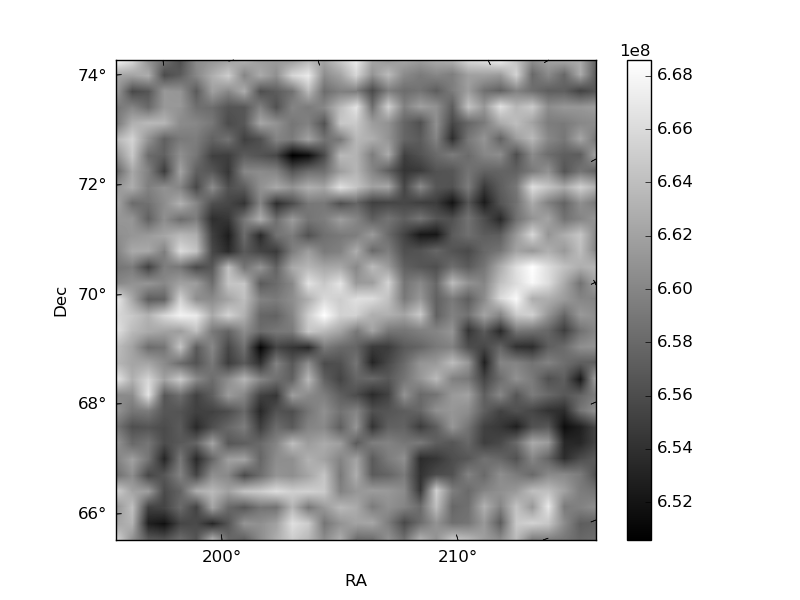
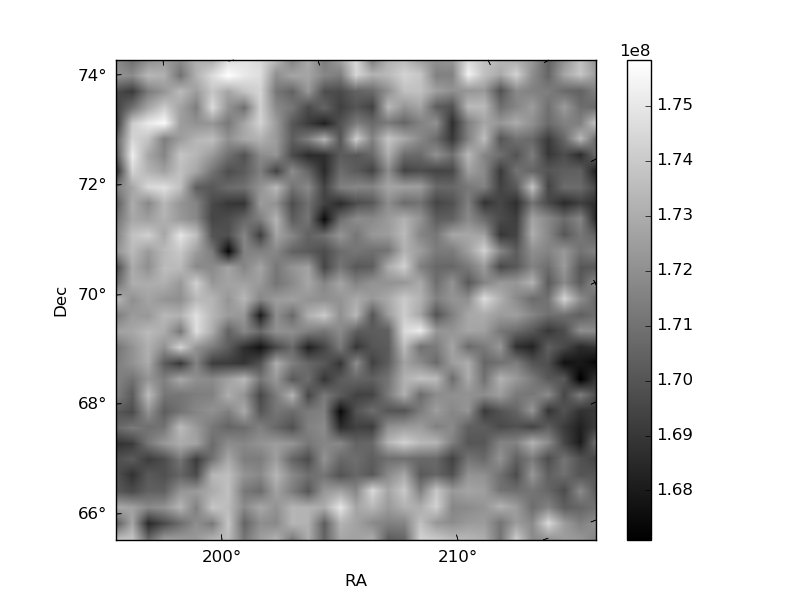
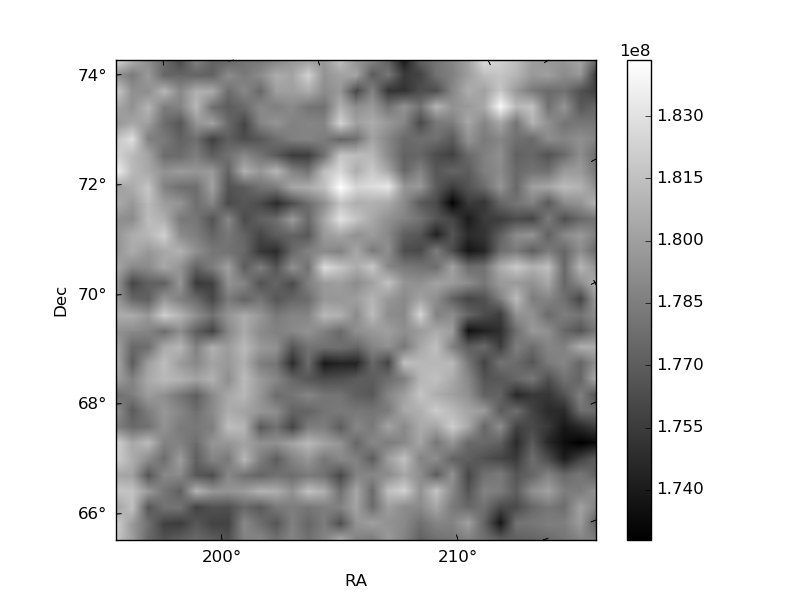
Histogram calculated using DETX and DETY for each event in the final _common_clean file
| Quadrant A | 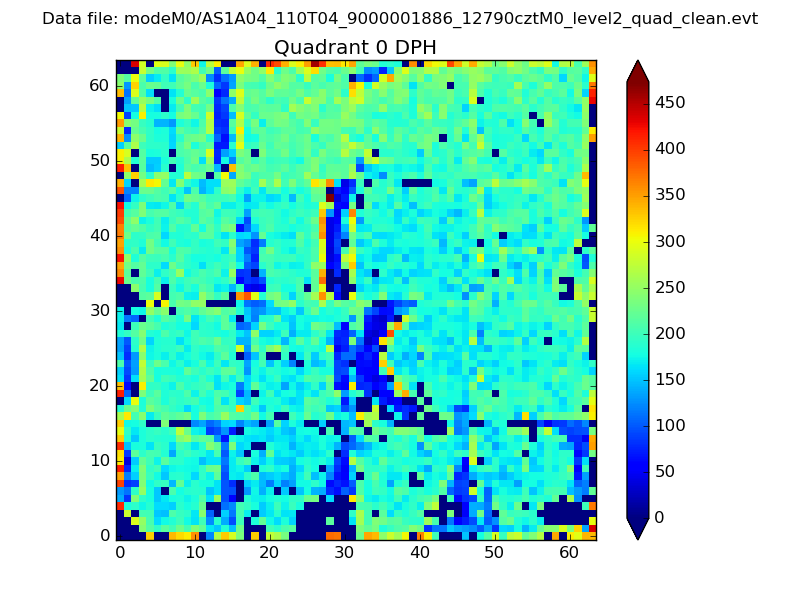 |
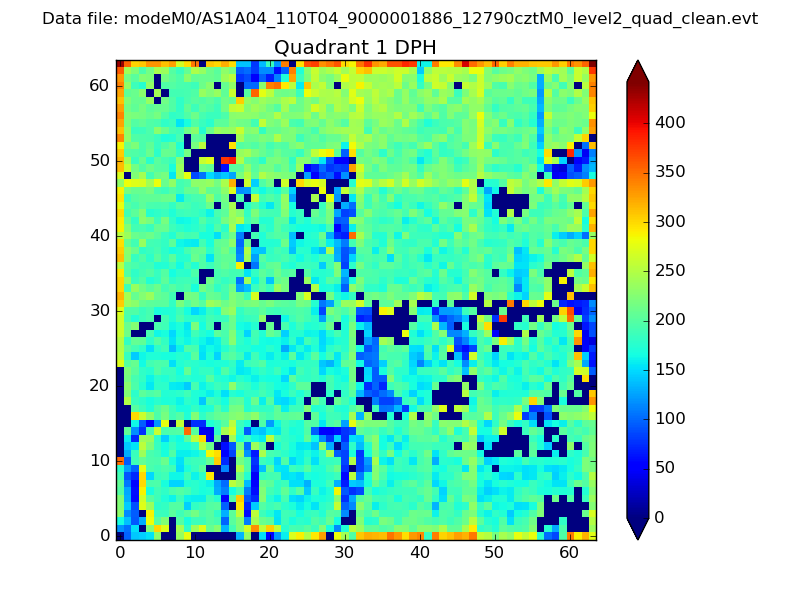 |
Quadrant B |
|---|---|---|---|
| Quadrant D | 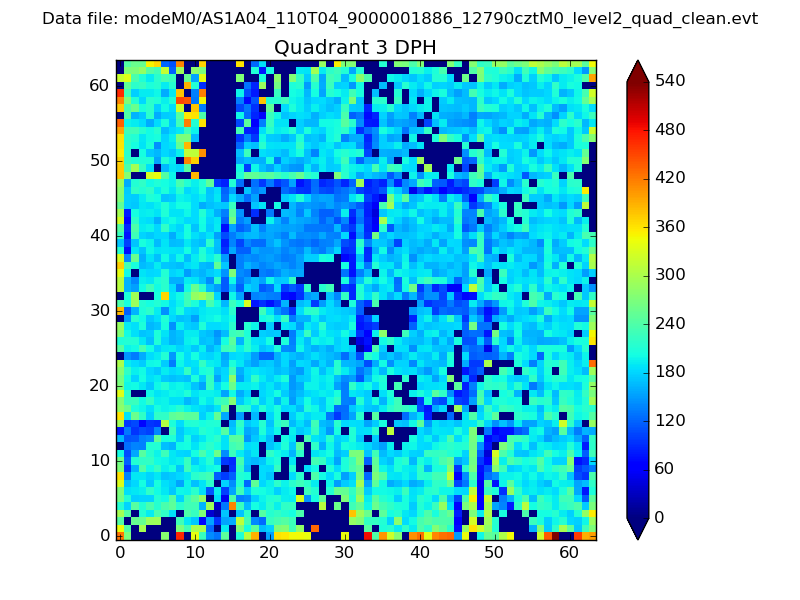 |
 |
Quadrant C |
| Plot type | Count rate plots | Images |
|---|---|---|
| Comparison with Poisson distribution Blue bars denote a histogram of data divided into 1 sec bins. Red curve is a Poisson curve with rate = median count rate of data. |
 |
 |
| Quadrant-wise count rates Data is divided into 100 sec bins |
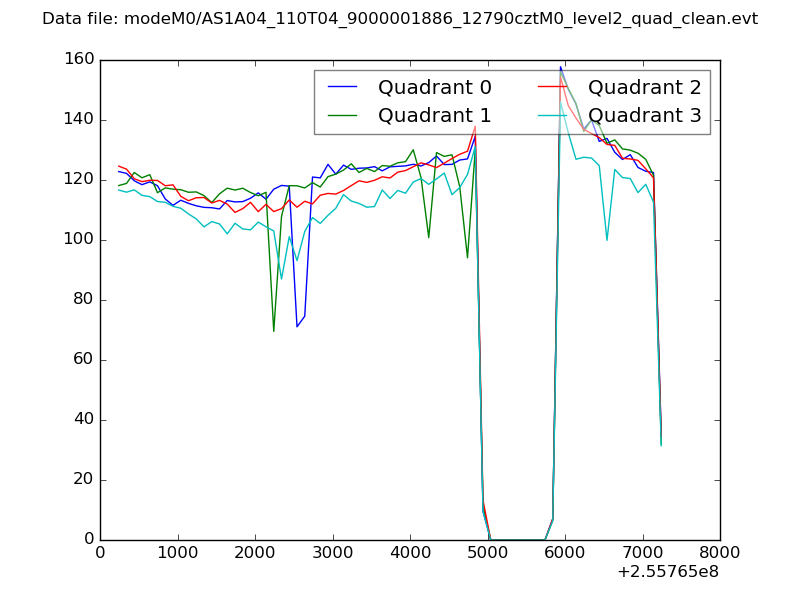 |
|
| Module-wise count rates for Quadrant A Data is divided into 100 sec bins |
 |
 |
| Module-wise count rates for Quadrant B Data is divided into 100 sec bins |
 |
 |
| Module-wise count rates for Quadrant C Data is divided into 100 sec bins |
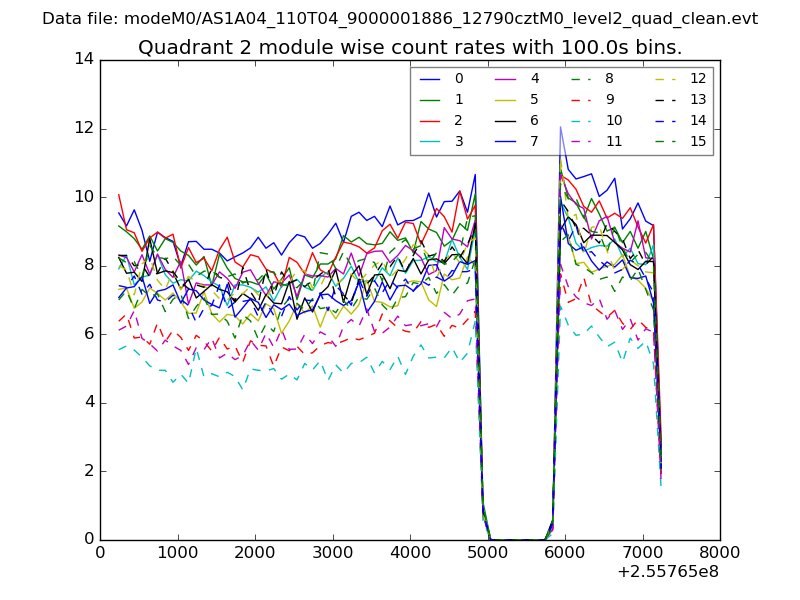 |
 |
| Module-wise count rates for Quadrant D Data is divided into 100 sec bins |
 |
 |
| Parameter | Plot |
|---|---|
| CZT HV Monitor | 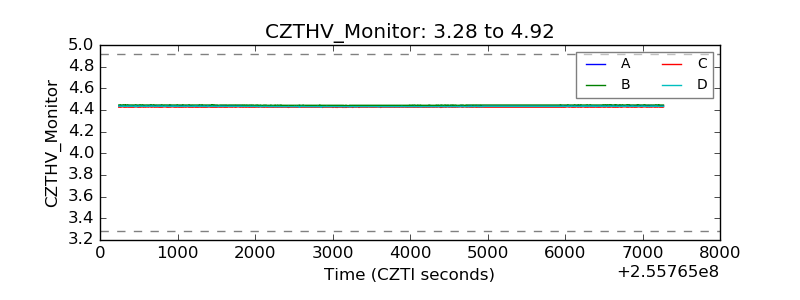 |
| D_VDD | 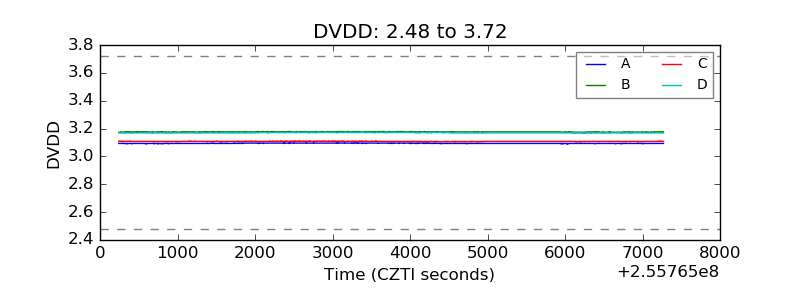 |
| Temperature 1 | 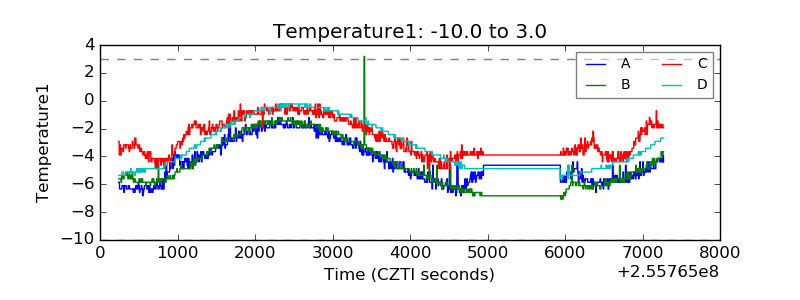 |
| Veto HV Monitor | 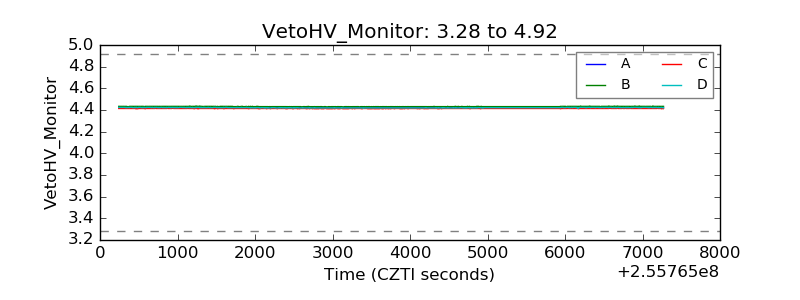 |
| Veto LLD | 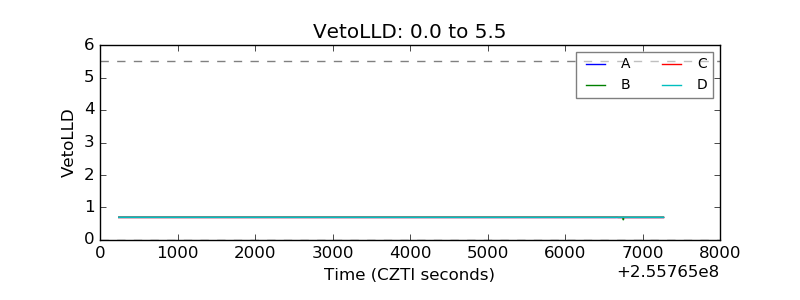 |
| Alpha Counter | 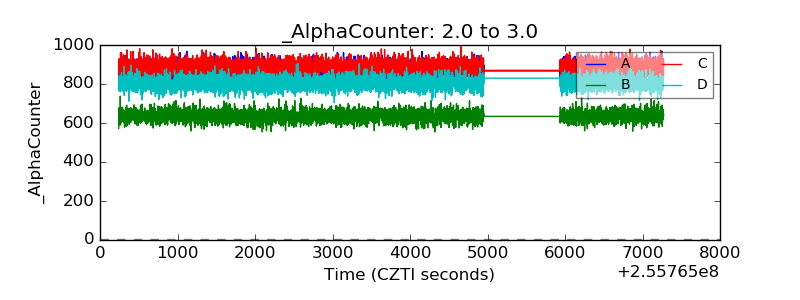 |
| _CPM_Rate | 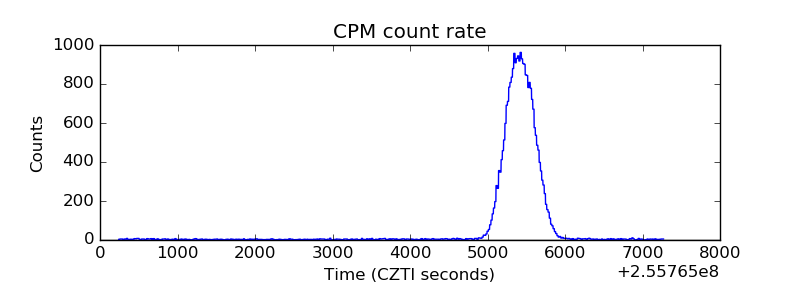 |
| CZT Counter | 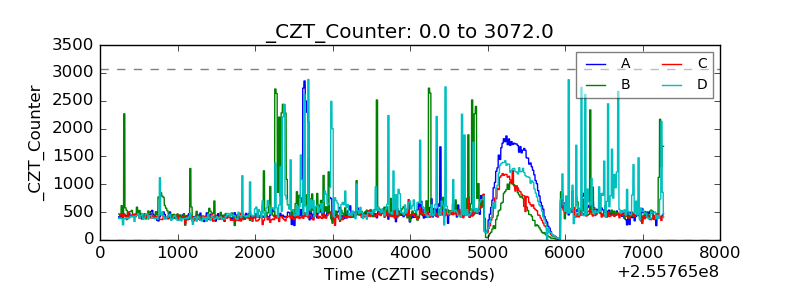 |
| +2.5 Volts monitor |  |
| +5 Volts monitor |  |
| _ROLL_ROT |  |
| _Roll_DEC |  |
| _Roll_RA | 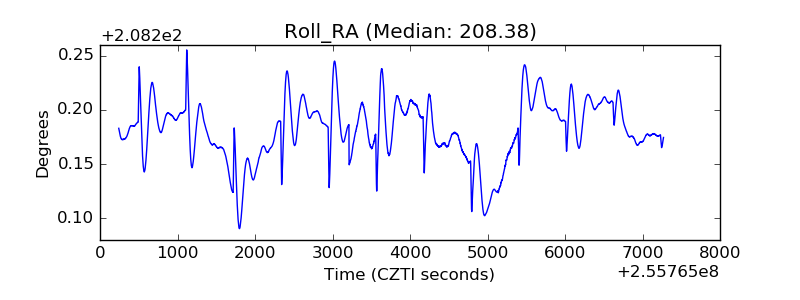 |
| Veto Counter | 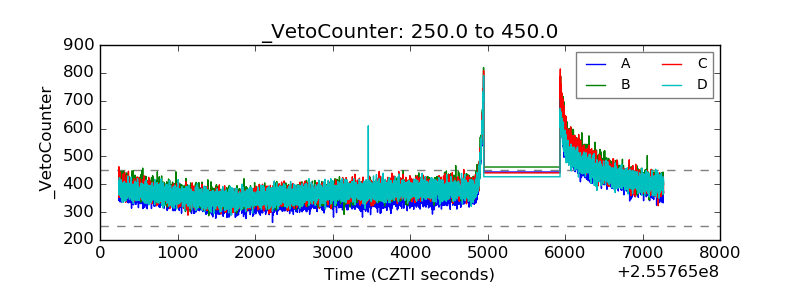 |