| Param | Original file | Final file |
|---|---|---|
| Filename | modeM0/AS1A04_110T04_9000001886_12793cztM0_level2.evt | modeM0/AS1A04_110T04_9000001886_12793cztM0_level2_quad_clean.evt |
| Size (bytes) | 504,498,240 | 123,016,320 |
| Size | 481.1 MB | 117.3 MB |
| Events in quadrant A | 3,109,599 | 853,437 |
| Events in quadrant B | 4,905,903 | 817,357 |
| Events in quadrant C | 2,862,903 | 833,759 |
| Events in quadrant D | 3,982,000 | 790,948 |
| Mode SS | |||
|---|---|---|---|
| Quadrant | BADHDUFLAG | Total packets | Discarded packets |
| A | 0 | 126 | 0 |
| B | 0 | 126 | 0 |
| C | 0 | 126 | 0 |
| D | 0 | 126 | 0 |
| Mode M0 | |||
|---|---|---|---|
| Quadrant | BADHDUFLAG | Total packets | Discarded packets |
| A | 0 | 13013 | 2 |
| B | 0 | 18505 | 1 |
| C | 0 | 12576 | 1 |
| D | 0 | 15812 | 1 |
| Mode M9 | |||
|---|---|---|---|
| Quadrant | BADHDUFLAG | Total packets | Discarded packets |
| A | 0 | 12 | 0 |
| B | 0 | 12 | 0 |
| C | 0 | 12 | 0 |
| D | 0 | 12 | 0 |
| Quadrant | Total seconds | Saturated seconds | Saturation percentage |
|---|---|---|---|
| A | 6159 | 56 | 0.909239% |
| B | 6159 | 664 | 10.780971% |
| C | 6159 | 36 | 0.584510% |
| D | 6159 | 232 | 3.766845% |
Noise dominated data is calculated using 1-second bins in cleaned event files. If a bin has >2000 counts, and if more than 50% of those come from <1% of pixels, then it is considered to be noise-dominated and hence unusable.
| Quadrant | # 1 sec bins | Bins with >0 counts | Bins with >2000 counts | High rate bins dominated by noise | Noise dominated (total time) | Noise dominated (detector-on time) | Marked lightcurve |
|---|---|---|---|---|---|---|---|
| A | 7370 | 6161 | 2 | 2 | 0.03% | 0.03% | 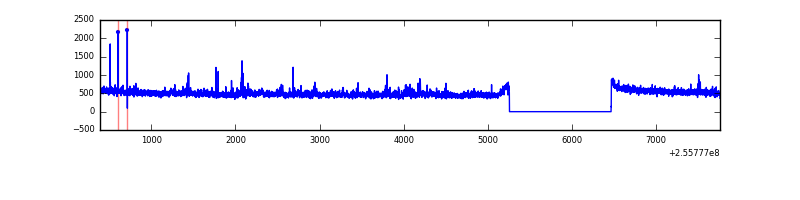 |
| B | 7370 | 6161 | 448 | 448 | 6.08% | 7.27% | 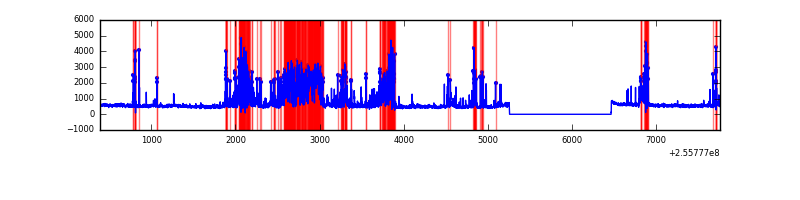 |
| C | 7370 | 6161 | 1 | 1 | 0.01% | 0.02% | 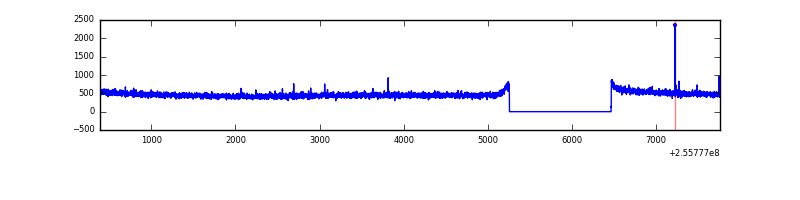 |
| D | 7370 | 6161 | 178 | 178 | 2.42% | 2.89% | 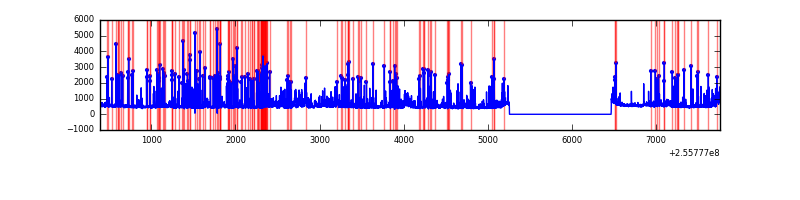 |
Top three noisy pixels from each quadrant. If the there are fewer than three noisy pixels in the level2.evt file, extra rows are filled as -1
| Pixel properties | Quadrant properties | ||||||
|---|---|---|---|---|---|---|---|
| Quadrant | DetID | PixID | Counts | Sigma | Mean | Median | Sigma |
| A | 12 | 189 | 102788 | 659.61 | 768 | 751 | 154.7 |
| A | 8 | 15 | 21133 | 131.76 | 768 | 751 | 154.7 |
| A | 9 | 143 | 18300 | 113.44 | 768 | 751 | 154.7 |
| B | 4 | 239 | 1816875 | 13310.54 | 729 | 714 | 136.4 |
| B | 0 | 219 | 132891 | 968.72 | 729 | 714 | 136.4 |
| B | 0 | 85 | 41445 | 298.52 | 729 | 714 | 136.4 |
| C | 13 | 61 | 5538 | 28.75 | 733 | 737 | 167.0 |
| C | 14 | 234 | 5052 | 25.84 | 733 | 737 | 167.0 |
| C | 3 | 202 | 1912 | 7.04 | 733 | 737 | 167.0 |
| D | 8 | 195 | 847269 | 4918.61 | 729 | 709 | 172.1 |
| D | 1 | 52 | 317936 | 1843.12 | 729 | 709 | 172.1 |
| D | 2 | 234 | 23117 | 130.19 | 729 | 709 | 172.1 |
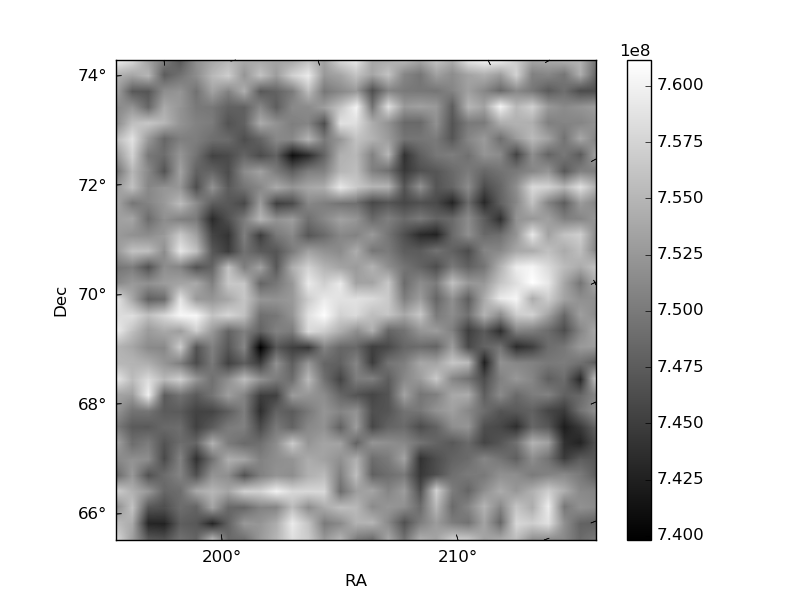
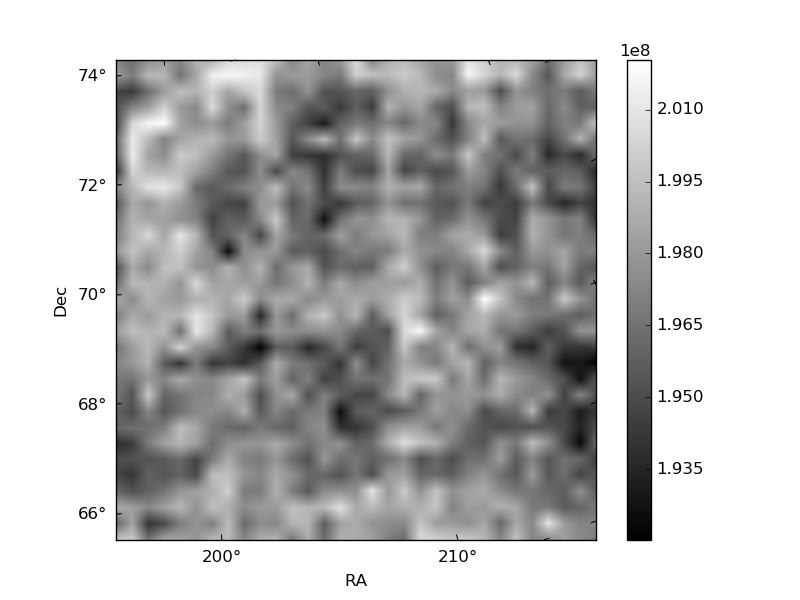
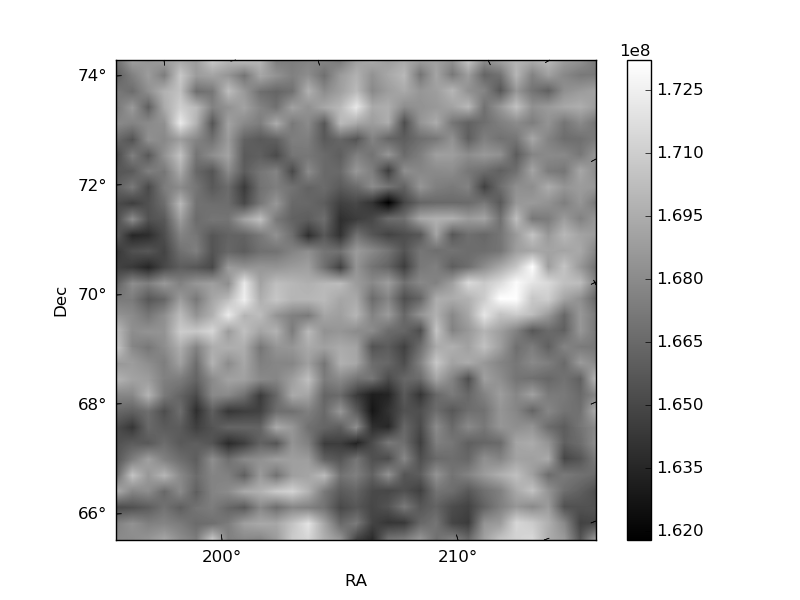
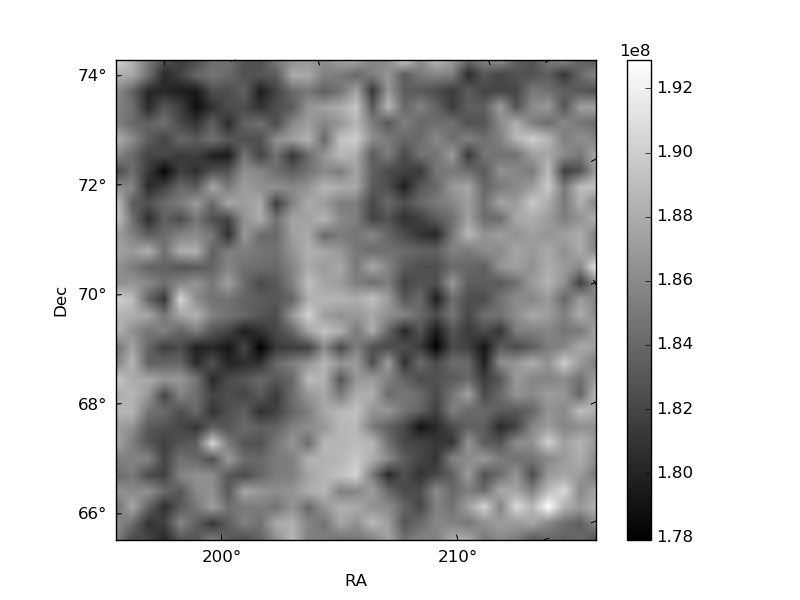
Histogram calculated using DETX and DETY for each event in the final _common_clean file
| Quadrant A | 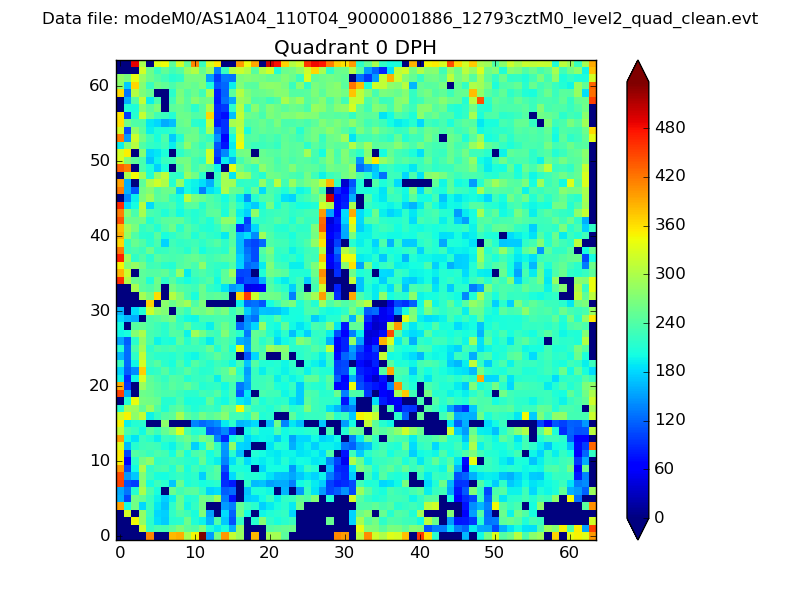 |
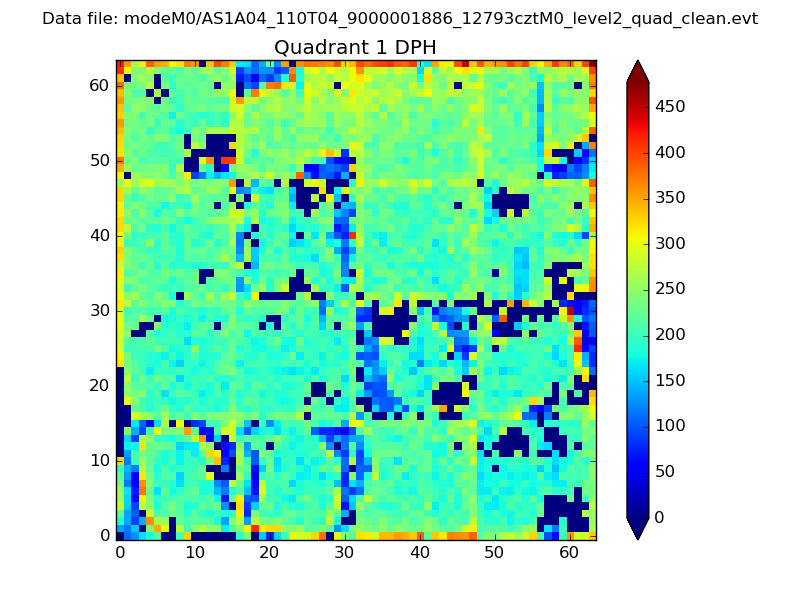 |
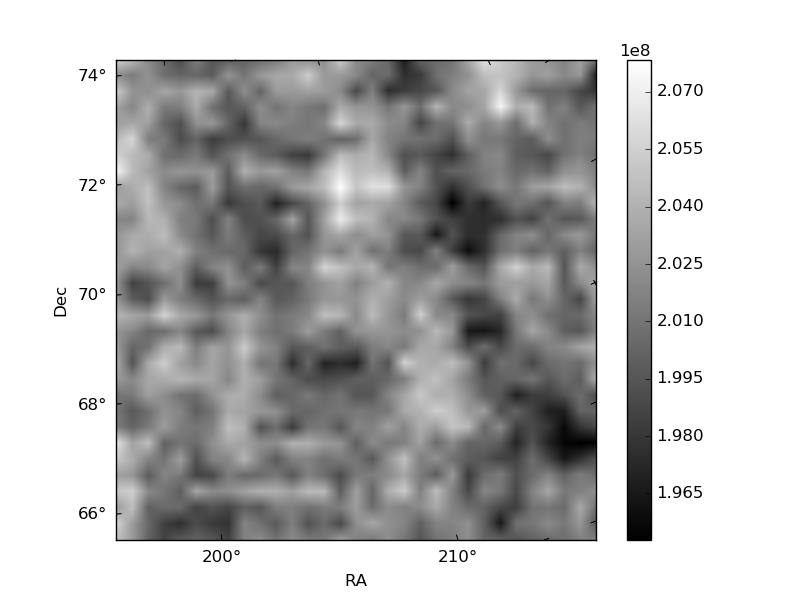
Quadrant B |
|---|---|---|---|
| Quadrant D | 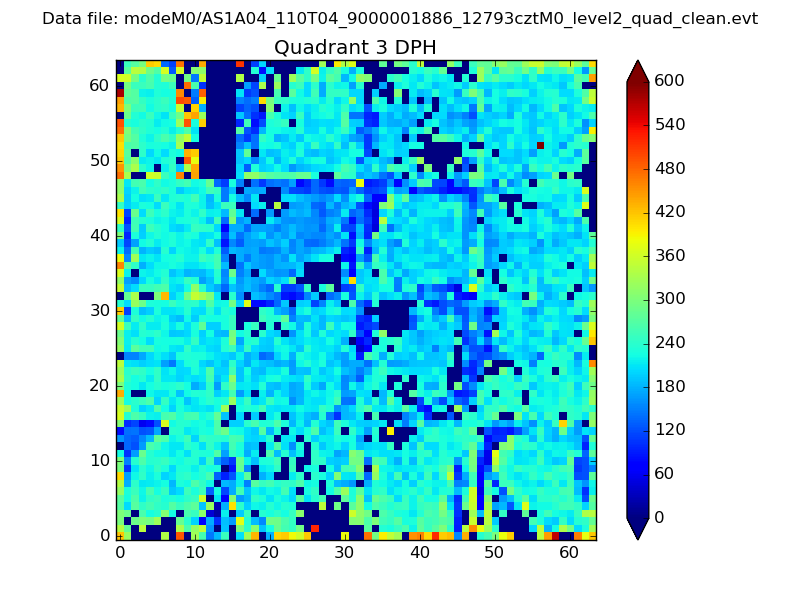 |
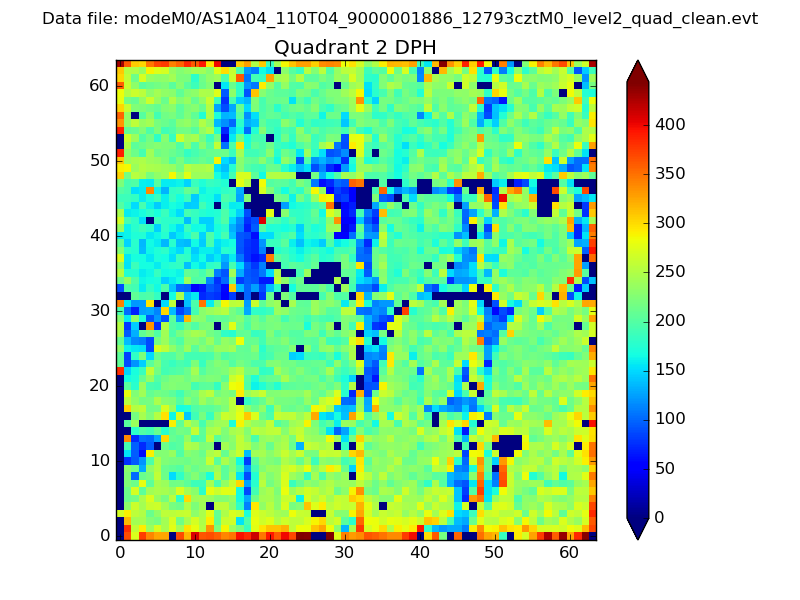 |
Quadrant C |
| Plot type | Count rate plots | Images |
|---|---|---|
| Comparison with Poisson distribution Blue bars denote a histogram of data divided into 1 sec bins. Red curve is a Poisson curve with rate = median count rate of data. |
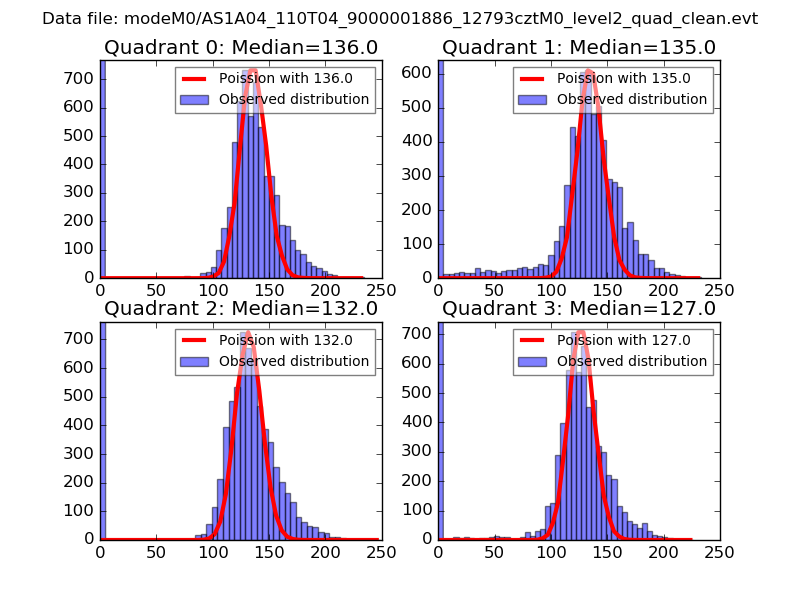 |
 |
| Quadrant-wise count rates Data is divided into 100 sec bins |
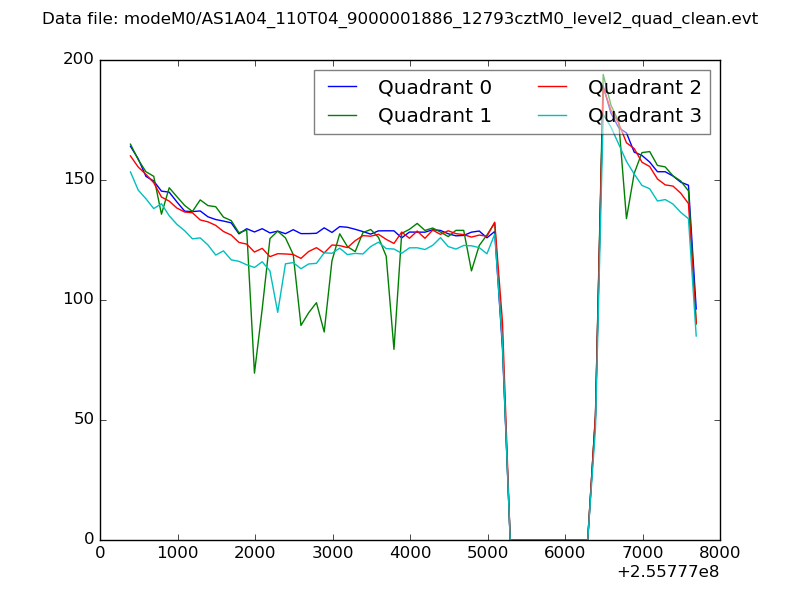 |
|
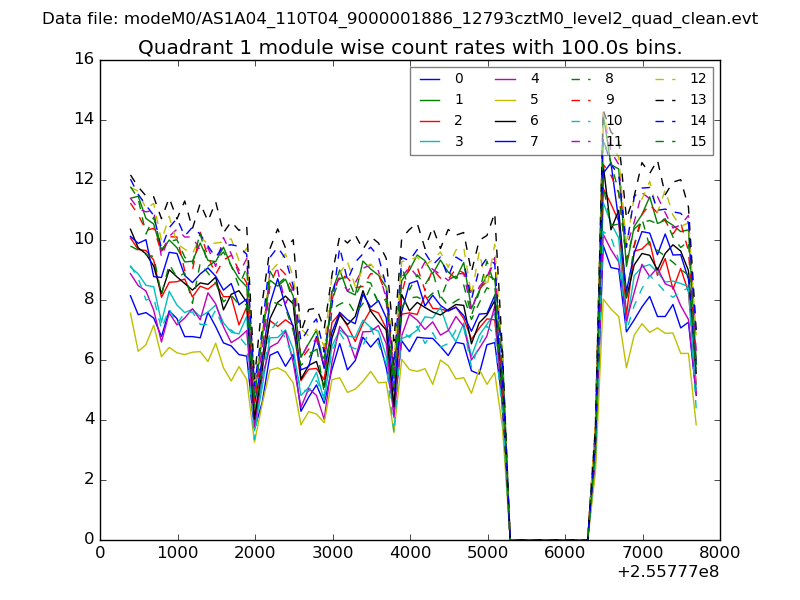
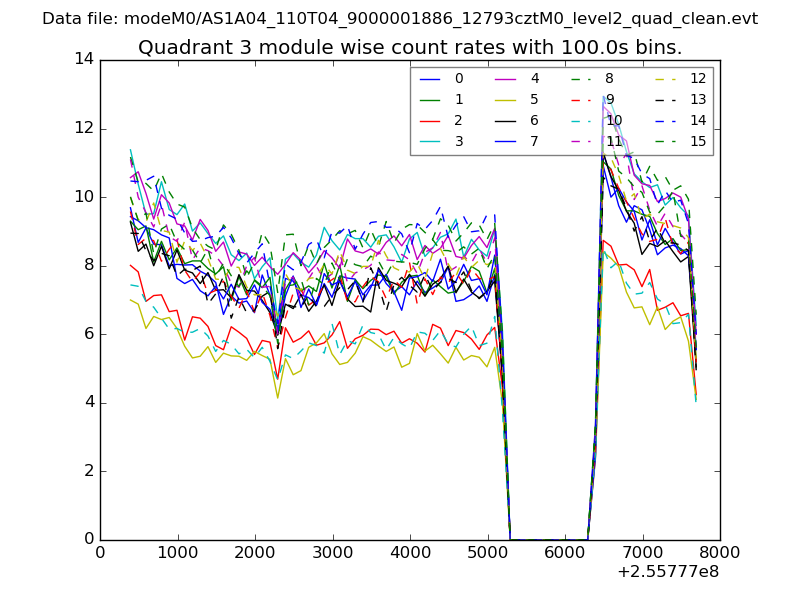
| Module-wise count rates for Quadrant A Data is divided into 100 sec bins |
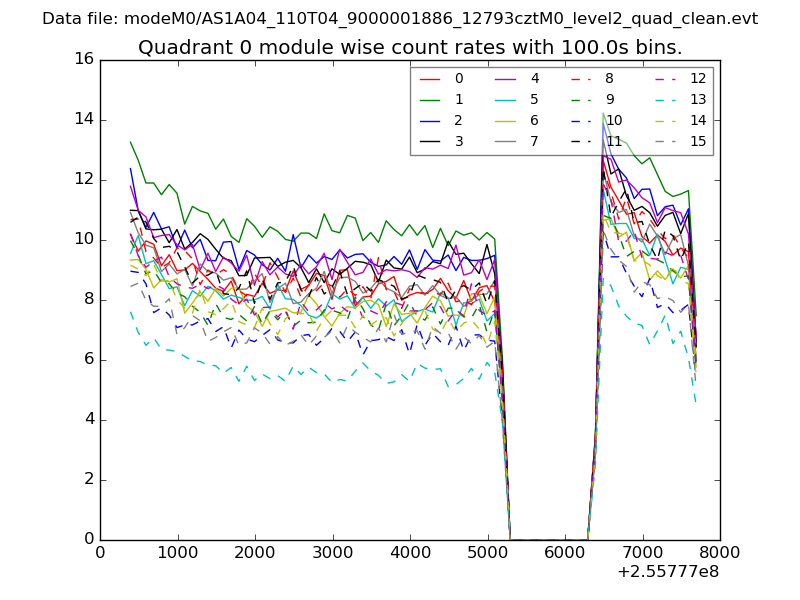 |
 |
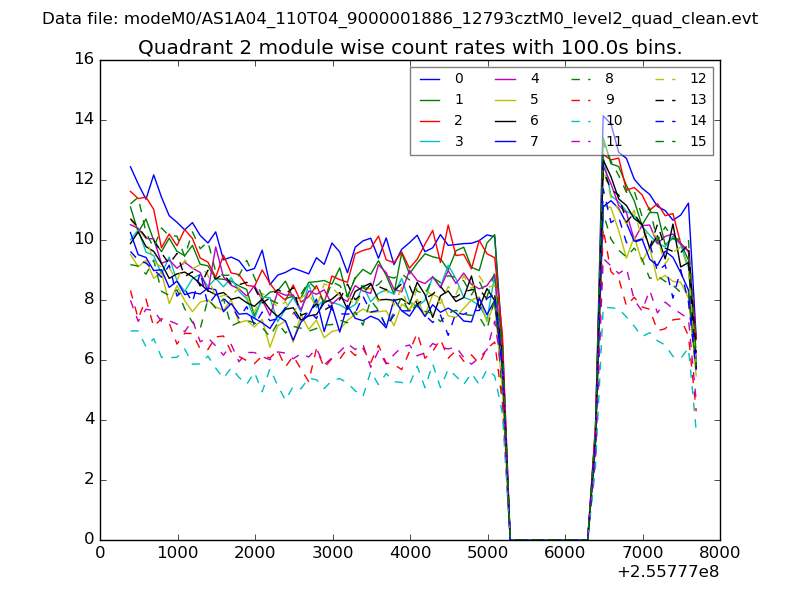
| Module-wise count rates for Quadrant B Data is divided into 100 sec bins |
 |
 |
| Module-wise count rates for Quadrant C Data is divided into 100 sec bins |
 |
 |
| Module-wise count rates for Quadrant D Data is divided into 100 sec bins |
 |
 |
| Parameter | Plot |
|---|---|
| CZT HV Monitor | 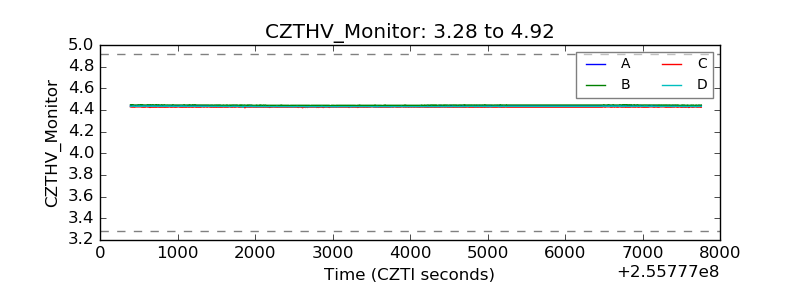 |
| D_VDD | 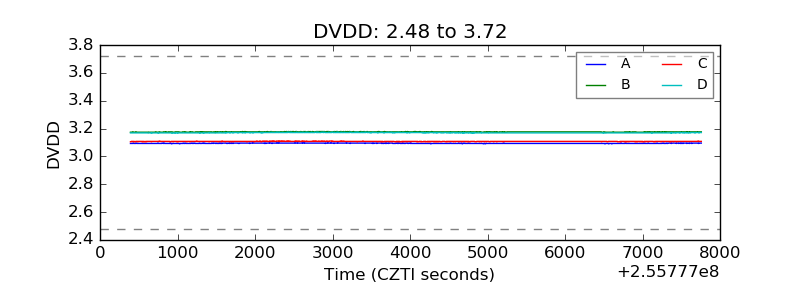 |
| Temperature 1 | 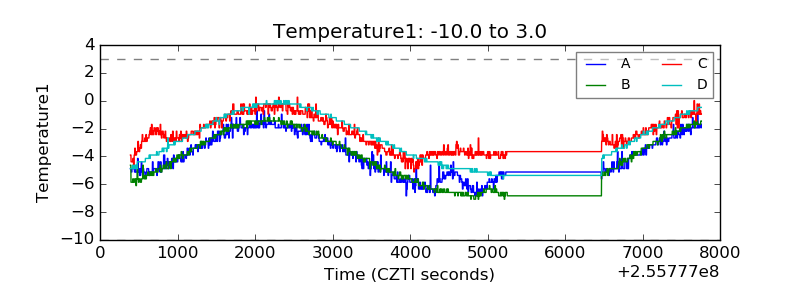 |
| Veto HV Monitor | 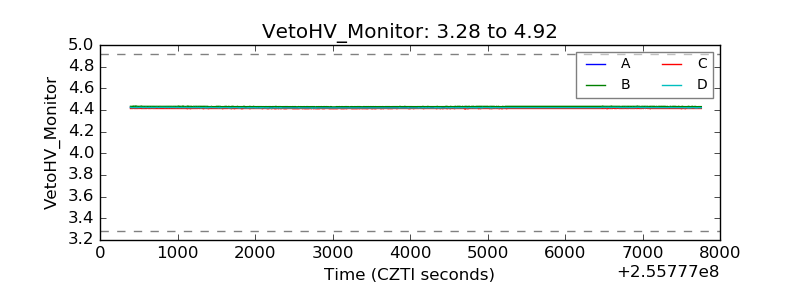 |
| Veto LLD | 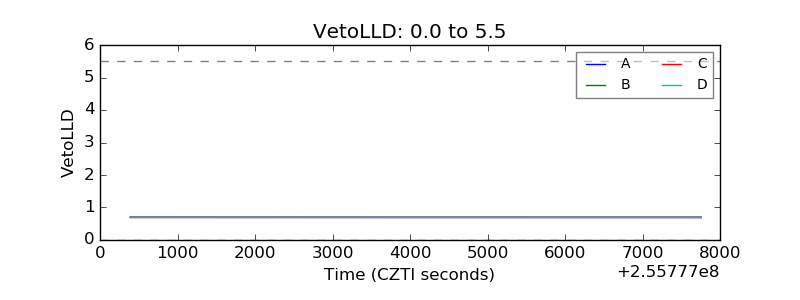 |
| Alpha Counter | 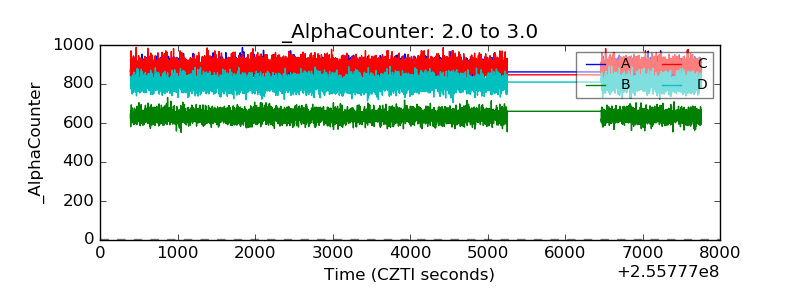 |
| _CPM_Rate | 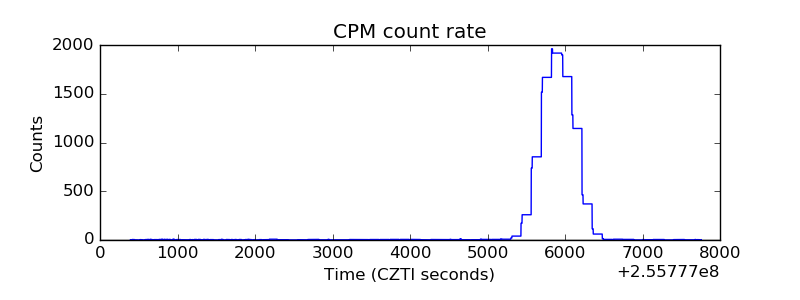 |
| CZT Counter | 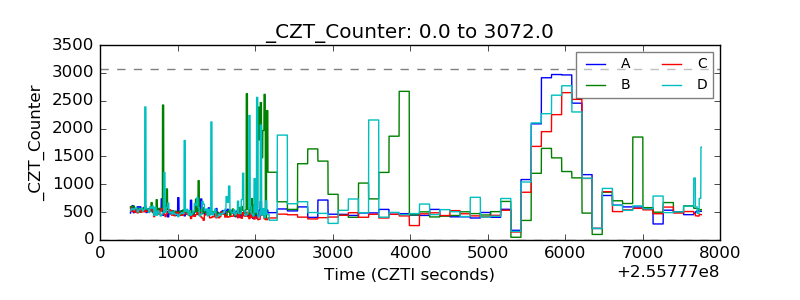 |
| +2.5 Volts monitor | 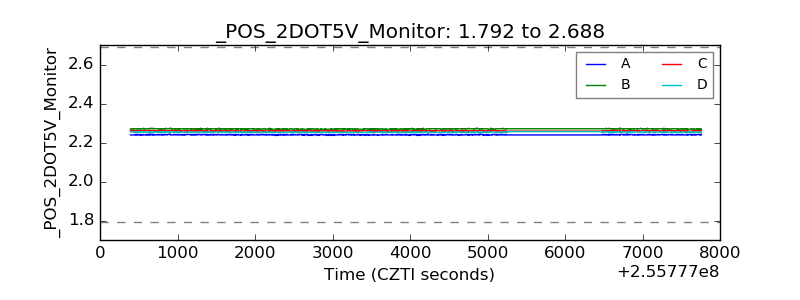 |
| +5 Volts monitor |  |
| _ROLL_ROT | 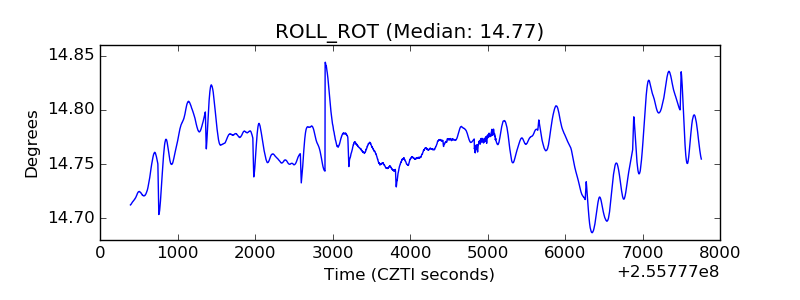 |
| _Roll_DEC | 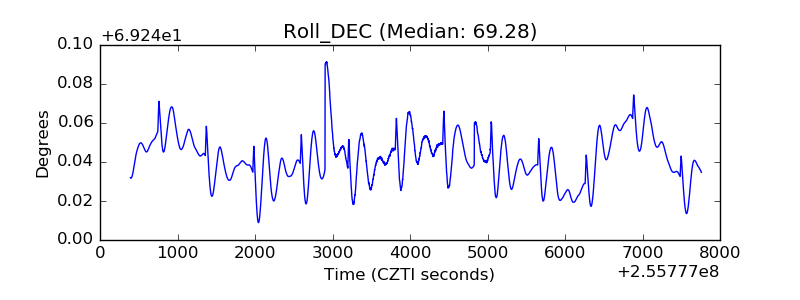 |
| _Roll_RA | 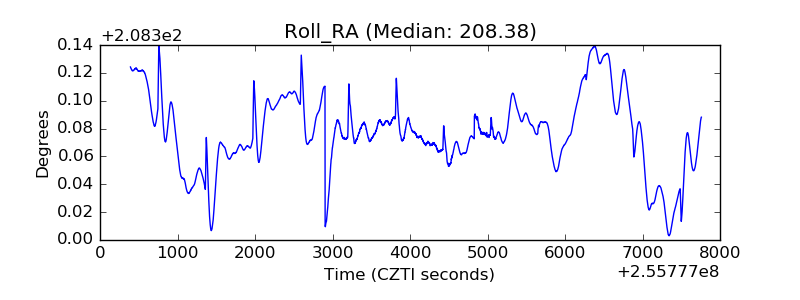 |
| Veto Counter | 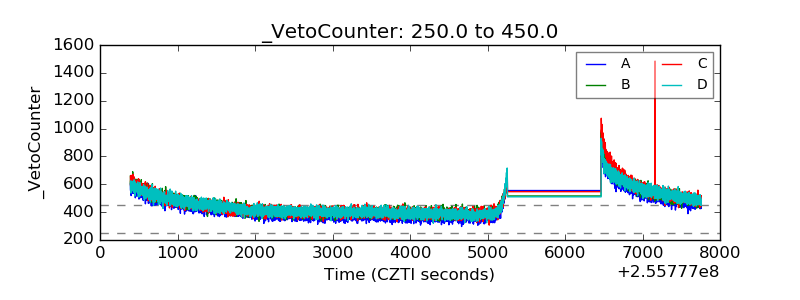 |