| Param | Original file | Final file |
|---|---|---|
| Filename | modeM0/AS1A04_112T01_9000001884cztM0_level2.fits | modeM0/AS1A04_112T01_9000001884cztM0_level2_quad_clean.evt |
| Size (bytes) | 366,310,080 | 446,132,160 |
| Size | 349.3 MB | 425.5 MB |
| Events in quadrant A | 2,280,752 | 2,914,646 |
| Events in quadrant B | 2,104,794 | 2,754,255 |
| Events in quadrant C | 2,204,794 | 2,762,399 |
| Events in quadrant D | 1,858,208 | 2,437,384 |
| Mode M0 | |||
|---|---|---|---|
| Quadrant | BADHDUFLAG | Total packets | Discarded packets |
| A | 0 | 84820 | 0 |
| B | 0 | 103939 | 0 |
| C | 0 | 83773 | 0 |
| D | 0 | 102510 | 0 |
| Mode SS | |||
|---|---|---|---|
| Quadrant | BADHDUFLAG | Total packets | Discarded packets |
| A | 0 | 784 | 0 |
| B | 0 | 784 | 0 |
| C | 0 | 784 | 0 |
| D | 0 | 784 | 0 |
| Mode M9 | |||
|---|---|---|---|
| Quadrant | BADHDUFLAG | Total packets | Discarded packets |
| A | 0 | 85 | 0 |
| B | 0 | 85 | 0 |
| C | 0 | 85 | 0 |
| D | 0 | 85 | 0 |
| Quadrant | Total seconds | Saturated seconds | Saturation percentage |
|---|---|---|---|
| A | 38488 | 562 | 1.460195% |
| B | 38488 | 3223 | 8.374039% |
| C | 38488 | 526 | 1.366660% |
| D | 38488 | 2315 | 6.014862% |
Noise dominated data is calculated using 1-second bins in cleaned event files. If a bin has >2000 counts, and if more than 50% of those come from <1% of pixels, then it is considered to be noise-dominated and hence unusable.
| Quadrant | # 1 sec bins | Bins with >0 counts | Bins with >2000 counts | High rate bins dominated by noise | Noise dominated (total time) | Noise dominated (detector-on time) | Marked lightcurve |
|---|---|---|---|---|---|---|---|
| A | 46393 | 38487 | 0 | 0 | 0.00% | 0.00% | 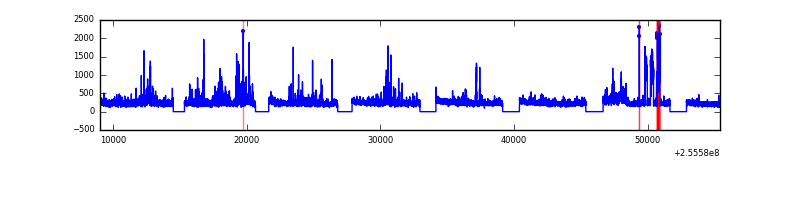 |
| B | 46393 | 38307 | 0 | 0 | 0.00% | 0.00% | 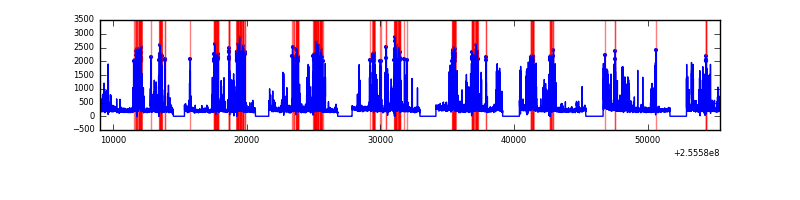 |
| C | 46393 | 38485 | 0 | 0 | 0.00% | 0.00% | 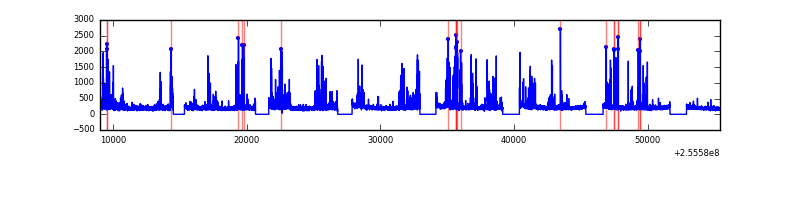 |
| D | 46393 | 38329 | 0 | 0 | 0.00% | 0.00% | 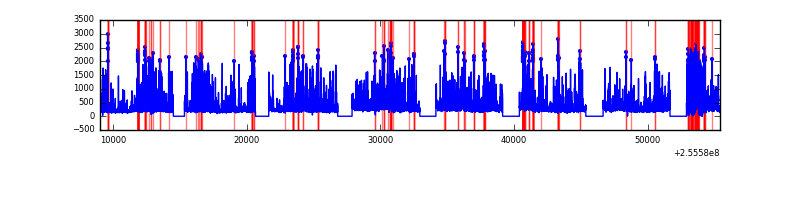 |
Top three noisy pixels from each quadrant. If the there are fewer than three noisy pixels in the level2.evt file, extra rows are filled as -1
| Pixel properties | Quadrant properties | ||||||
|---|---|---|---|---|---|---|---|
| Quadrant | DetID | PixID | Counts | Sigma | Mean | Median | Sigma |
| A | 0 | 29 | 2084 | 10.39 | 593 | 561 | 146.5 |
| A | 7 | 110 | 1851 | 8.8 | 593 | 561 | 146.5 |
| A | 9 | 19 | 1746 | 8.09 | 593 | 561 | 146.5 |
| B | 2 | 9 | 1825 | 11.82 | 556 | 534 | 109.2 |
| B | 5 | 128 | 1412 | 8.04 | 556 | 534 | 109.2 |
| B | 14 | 254 | 1405 | 7.98 | 556 | 534 | 109.2 |
| C | 12 | 241 | 1574 | 6.84 | 582 | 544 | 150.5 |
| C | 3 | 126 | 1453 | 6.04 | 582 | 544 | 150.5 |
| C | 2 | 191 | 1447 | 6.0 | 582 | 544 | 150.5 |
| D | 3 | 14 | 1362 | 6.14 | 531 | 486 | 142.6 |
| D | 6 | 231 | 1320 | 5.85 | 531 | 486 | 142.6 |
| D | 3 | 31 | 1301 | 5.71 | 531 | 486 | 142.6 |
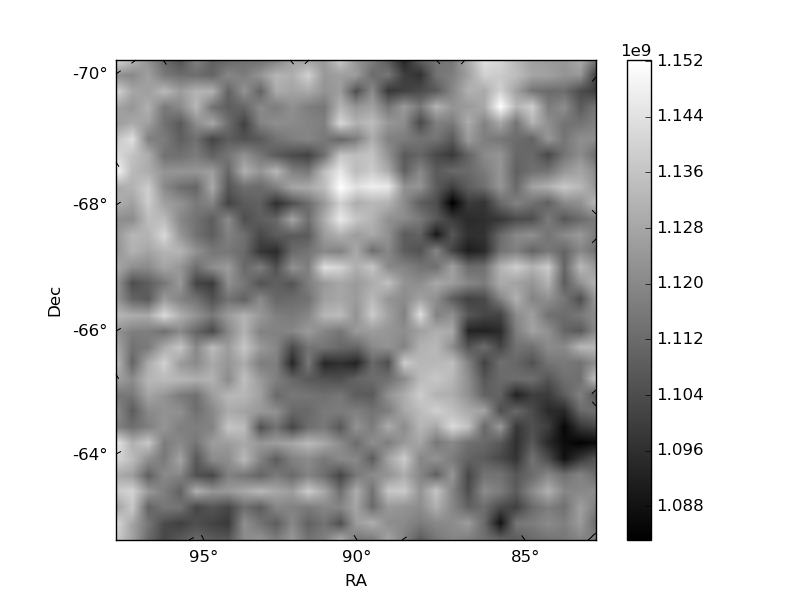
Histogram calculated using DETX and DETY for each event in the final _common_clean file
| Quadrant A | 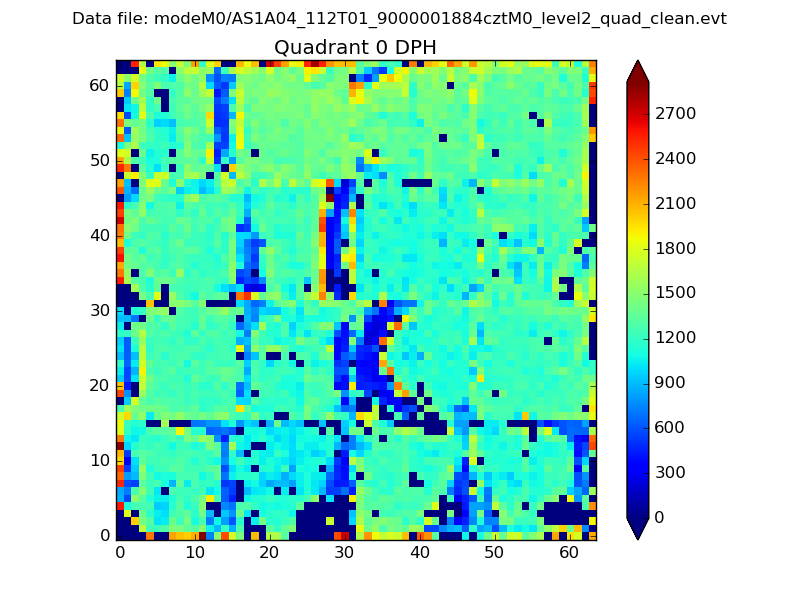 |
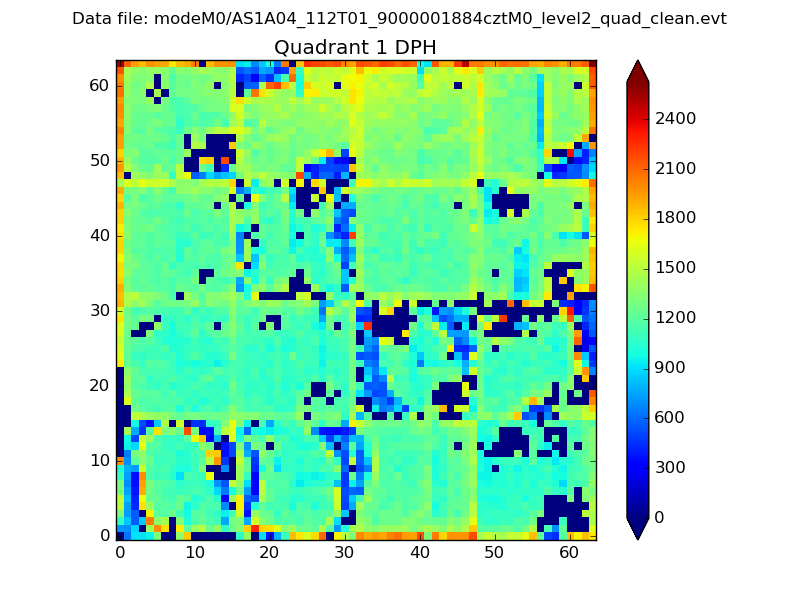 |
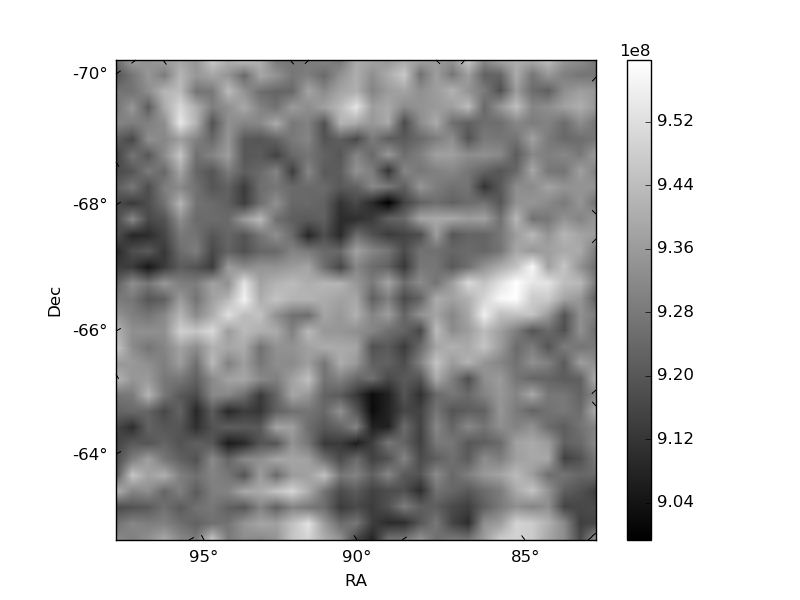
Quadrant B |
|---|---|---|---|
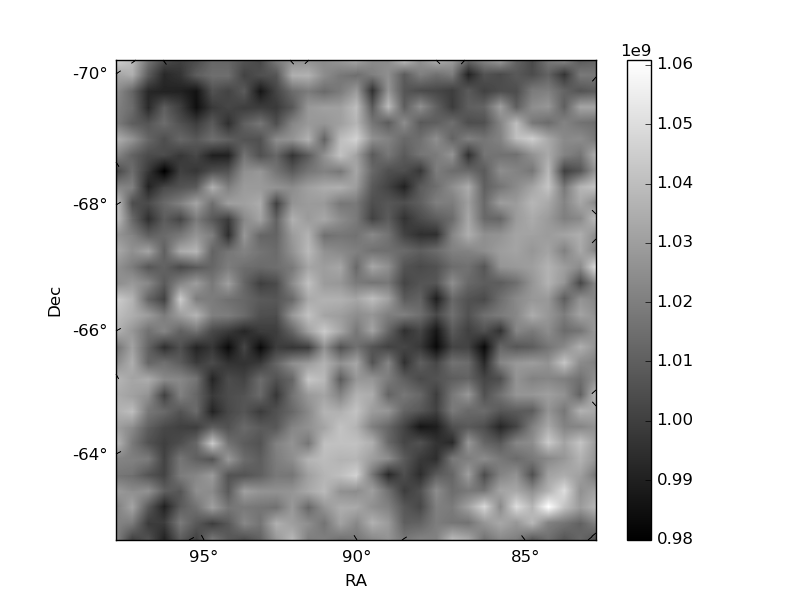
| Quadrant D | 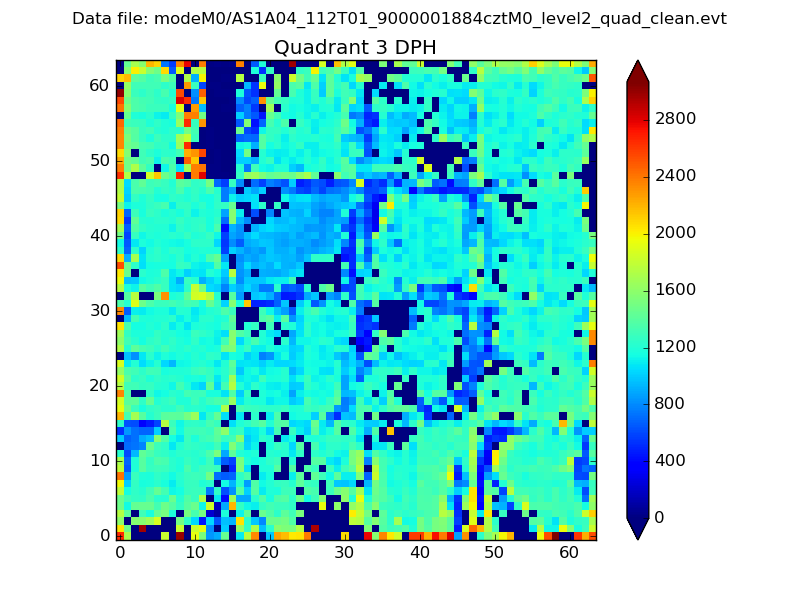 |
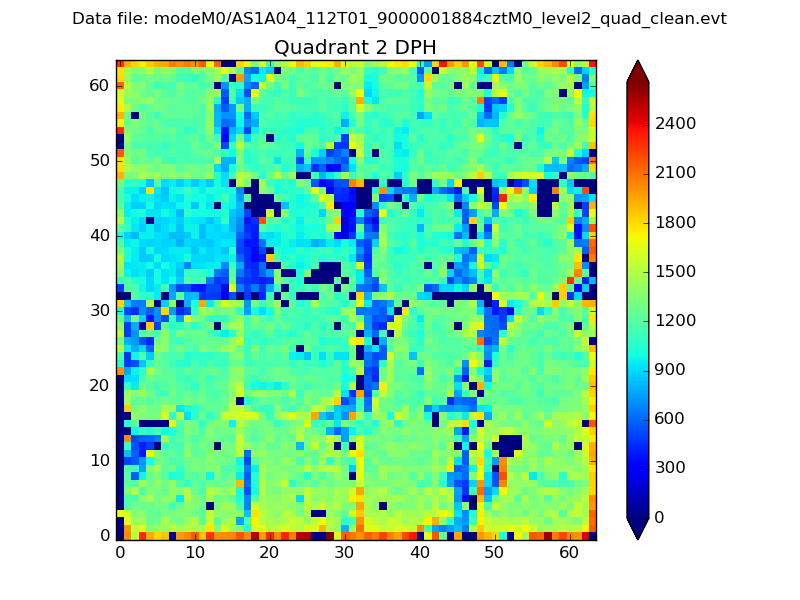 |
Quadrant C |
| Plot type | Count rate plots | Images |
|---|---|---|
| Comparison with Poisson distribution Blue bars denote a histogram of data divided into 1 sec bins. Red curve is a Poisson curve with rate = median count rate of data. |
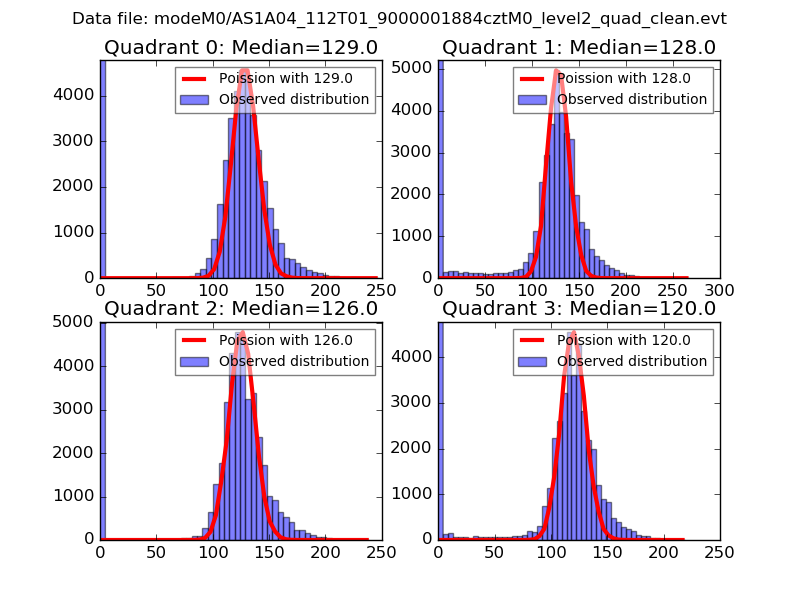 |
 |
| Quadrant-wise count rates Data is divided into 100 sec bins |
 |
|
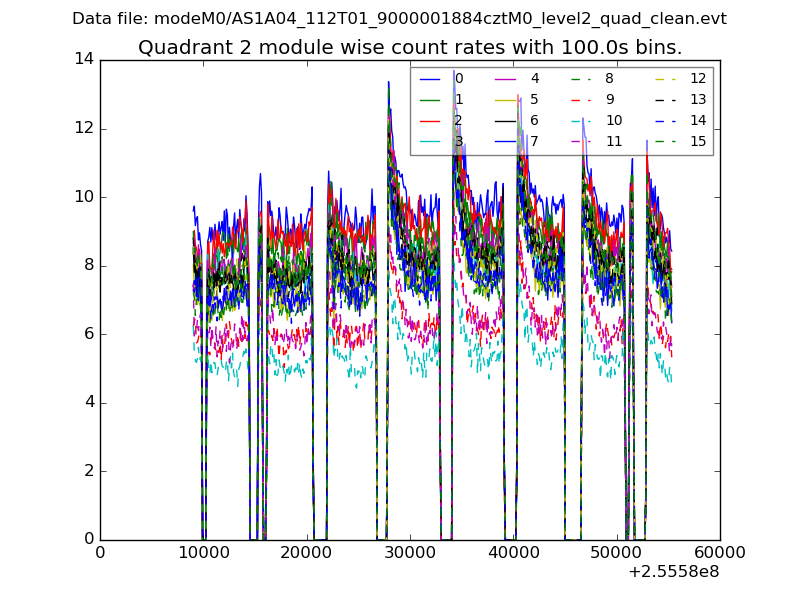
| Module-wise count rates for Quadrant A Data is divided into 100 sec bins |
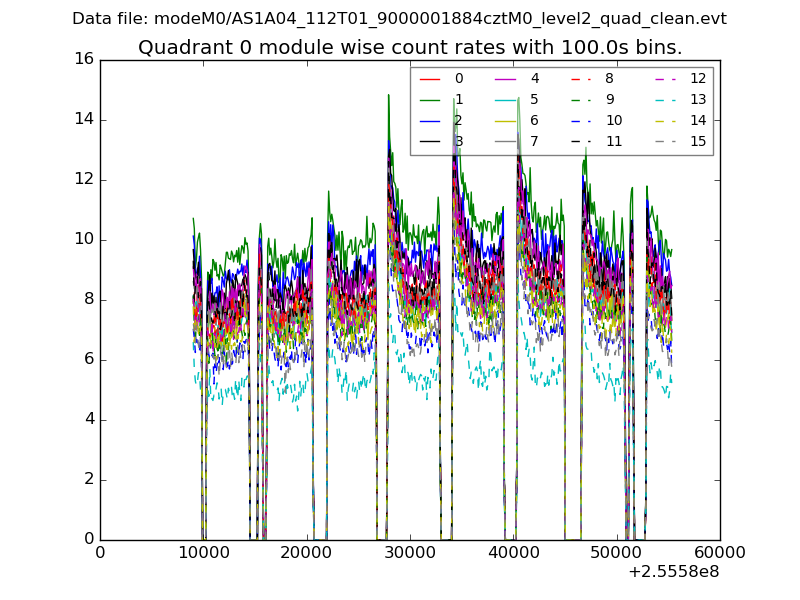 |
 |
| Module-wise count rates for Quadrant B Data is divided into 100 sec bins |
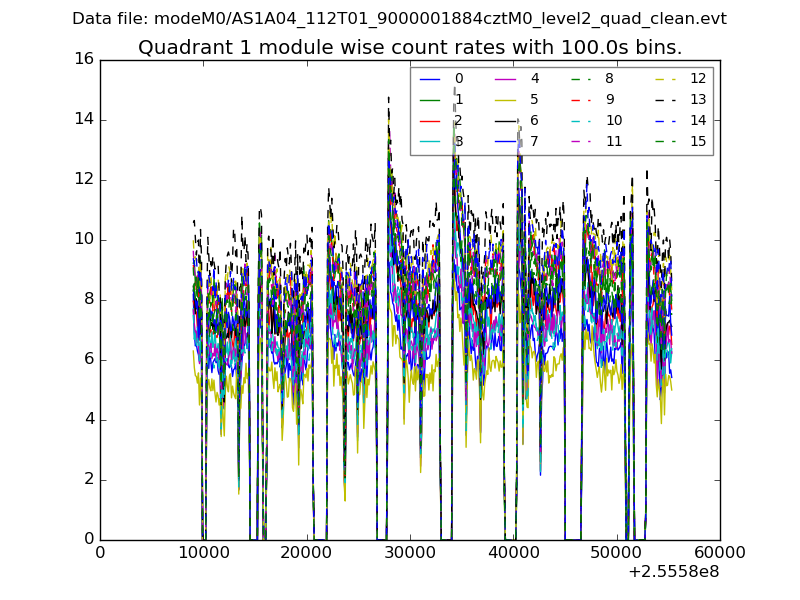 |
 |
| Module-wise count rates for Quadrant C Data is divided into 100 sec bins |
 |
 |
| Module-wise count rates for Quadrant D Data is divided into 100 sec bins |
 |
 |
| Parameter | Plot |
|---|---|
| CZT HV Monitor |  |
| D_VDD | 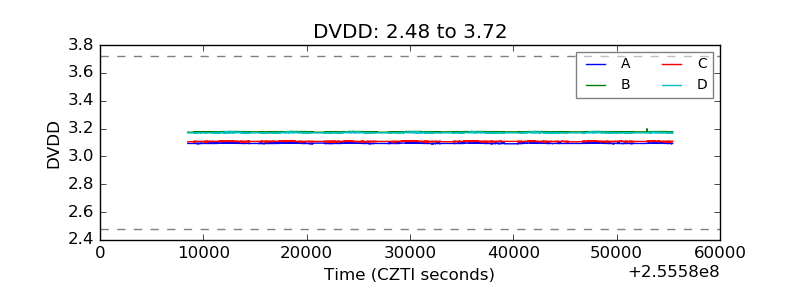 |
| Temperature 1 | 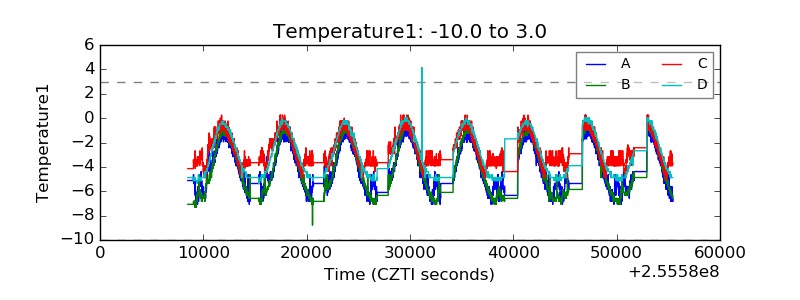 |
| Veto HV Monitor |  |
| Veto LLD | 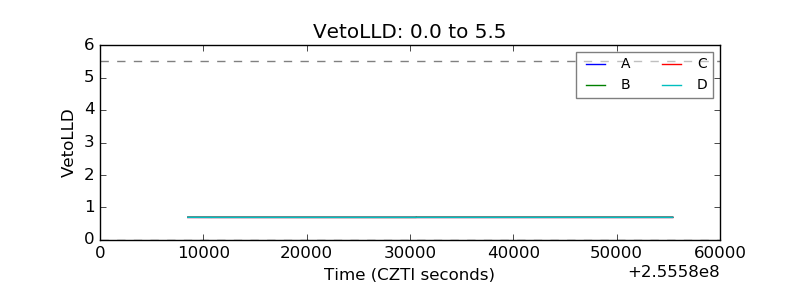 |
| Alpha Counter | 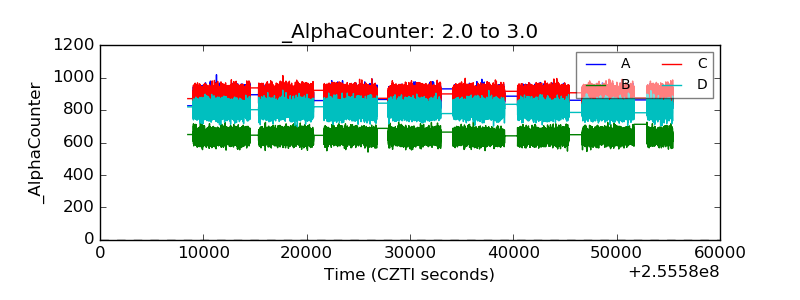 |
| _CPM_Rate | 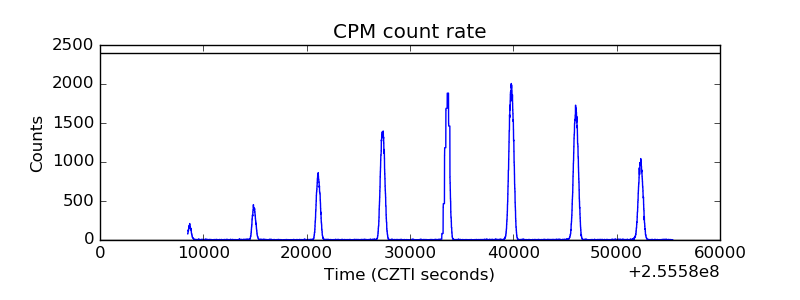 |
| CZT Counter |  |
| +2.5 Volts monitor |  |
| +5 Volts monitor |  |
| _ROLL_ROT |  |
| _Roll_DEC | 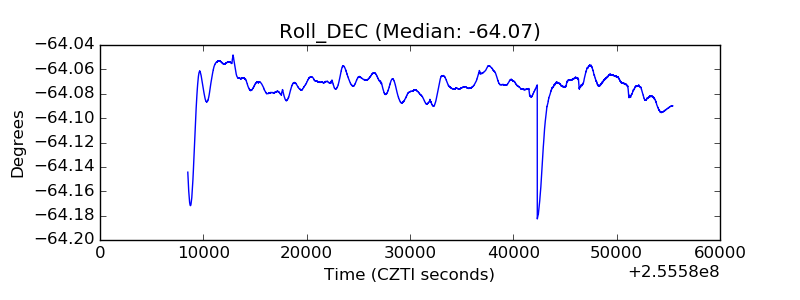 |
| _Roll_RA | 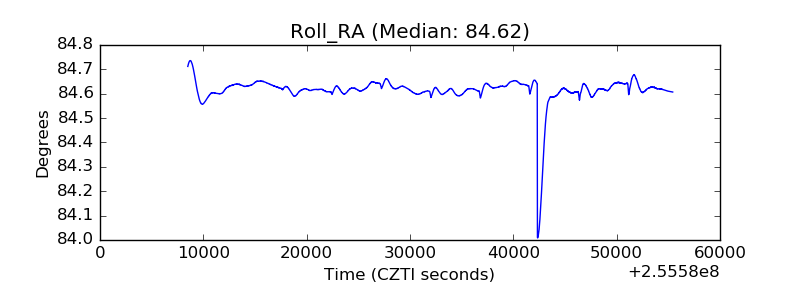 |
| Veto Counter | 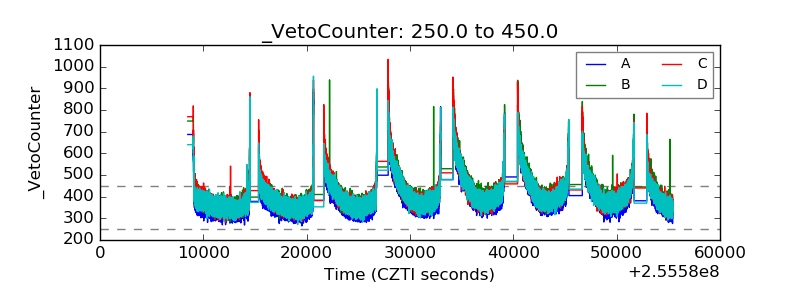 |