| Param | Original file | Final file |
|---|---|---|
| Filename | modeM0/AS1A04_112T01_9000001884_12760cztM0_level2.evt | modeM0/AS1A04_112T01_9000001884_12760cztM0_level2_quad_clean.evt |
| Size (bytes) | 537,811,200 | 110,954,880 |
| Size | 512.9 MB | 105.8 MB |
| Events in quadrant A | 3,504,839 | 733,272 |
| Events in quadrant B | 4,417,275 | 719,121 |
| Events in quadrant C | 3,393,693 | 733,025 |
| Events in quadrant D | 4,499,288 | 689,588 |
| Mode M0 | |||
|---|---|---|---|
| Quadrant | BADHDUFLAG | Total packets | Discarded packets |
| A | 0 | 14722 | 3 |
| B | 0 | 17578 | 2 |
| C | 0 | 14894 | 2 |
| D | 0 | 18068 | 2 |
| Mode SS | |||
|---|---|---|---|
| Quadrant | BADHDUFLAG | Total packets | Discarded packets |
| A | 0 | 142 | 0 |
| B | 0 | 142 | 0 |
| C | 0 | 142 | 0 |
| D | 0 | 142 | 0 |
| Mode M9 | |||
|---|---|---|---|
| Quadrant | BADHDUFLAG | Total packets | Discarded packets |
| A | 0 | 14 | 0 |
| B | 0 | 14 | 0 |
| C | 0 | 14 | 0 |
| D | 0 | 14 | 0 |
| Quadrant | Total seconds | Saturated seconds | Saturation percentage |
|---|---|---|---|
| A | 6963 | 78 | 1.120207% |
| B | 6963 | 459 | 6.591986% |
| C | 6963 | 84 | 1.206377% |
| D | 6963 | 289 | 4.150510% |
Noise dominated data is calculated using 1-second bins in cleaned event files. If a bin has >2000 counts, and if more than 50% of those come from <1% of pixels, then it is considered to be noise-dominated and hence unusable.
| Quadrant | # 1 sec bins | Bins with >0 counts | Bins with >2000 counts | High rate bins dominated by noise | Noise dominated (total time) | Noise dominated (detector-on time) | Marked lightcurve |
|---|---|---|---|---|---|---|---|
| A | 7799 | 6965 | 3 | 3 | 0.04% | 0.04% | 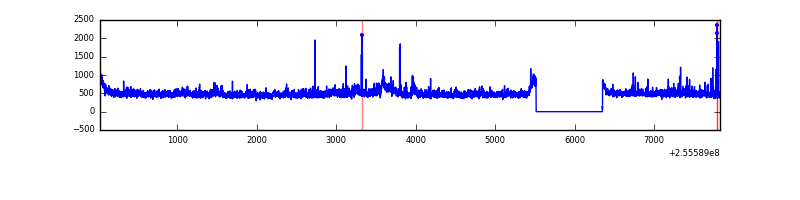 |
| B | 7799 | 6965 | 289 | 289 | 3.71% | 4.15% | 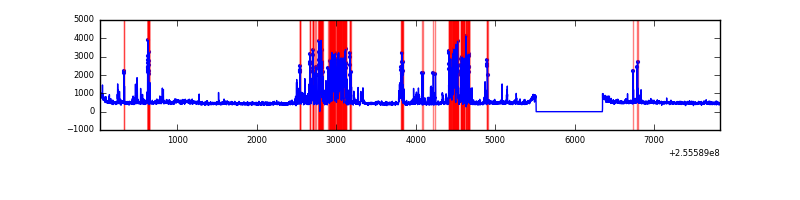 |
| C | 7799 | 6965 | 12 | 12 | 0.15% | 0.17% | 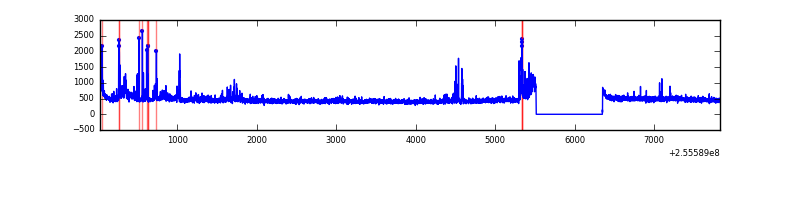 |
| D | 7799 | 6965 | 221 | 221 | 2.83% | 3.17% | 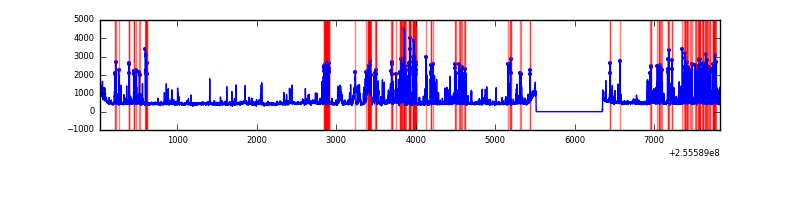 |
Top three noisy pixels from each quadrant. If the there are fewer than three noisy pixels in the level2.evt file, extra rows are filled as -1
| Pixel properties | Quadrant properties | ||||||
|---|---|---|---|---|---|---|---|
| Quadrant | DetID | PixID | Counts | Sigma | Mean | Median | Sigma |
| A | 0 | 23 | 127830 | 767.35 | 813 | 793 | 165.6 |
| A | 12 | 189 | 92296 | 552.71 | 813 | 793 | 165.6 |
| A | 15 | 239 | 74866 | 447.43 | 813 | 793 | 165.6 |
| B | 4 | 239 | 1154842 | 7640.31 | 793 | 773 | 151.0 |
| B | 0 | 214 | 62600 | 409.31 | 793 | 773 | 151.0 |
| B | 3 | 209 | 20570 | 131.06 | 793 | 773 | 151.0 |
| C | 15 | 208 | 305255 | 1672.65 | 791 | 794 | 182.0 |
| C | 13 | 61 | 5766 | 27.32 | 791 | 794 | 182.0 |
| C | 8 | 222 | 3404 | 14.34 | 791 | 794 | 182.0 |
| D | 1 | 52 | 1253285 | 6692.57 | 779 | 753 | 187.2 |
| D | 2 | 136 | 141995 | 754.69 | 779 | 753 | 187.2 |
| D | 8 | 195 | 65025 | 343.42 | 779 | 753 | 187.2 |
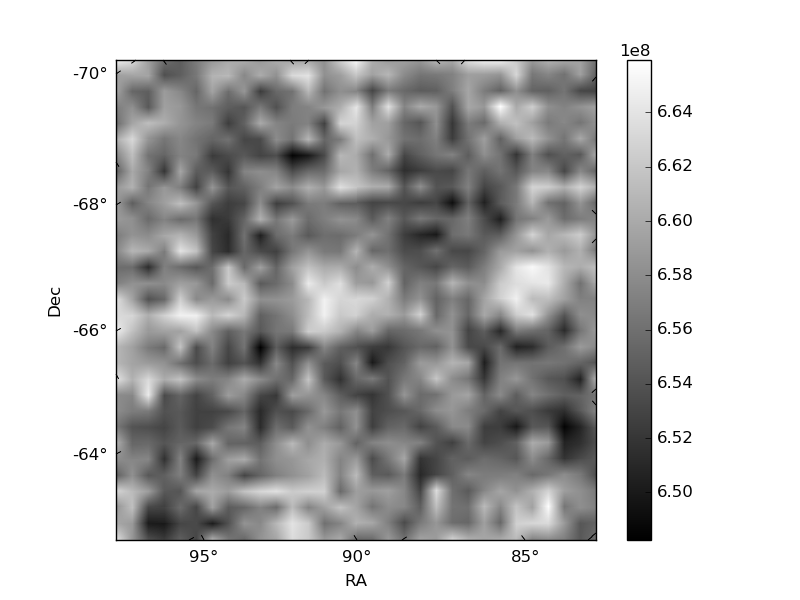
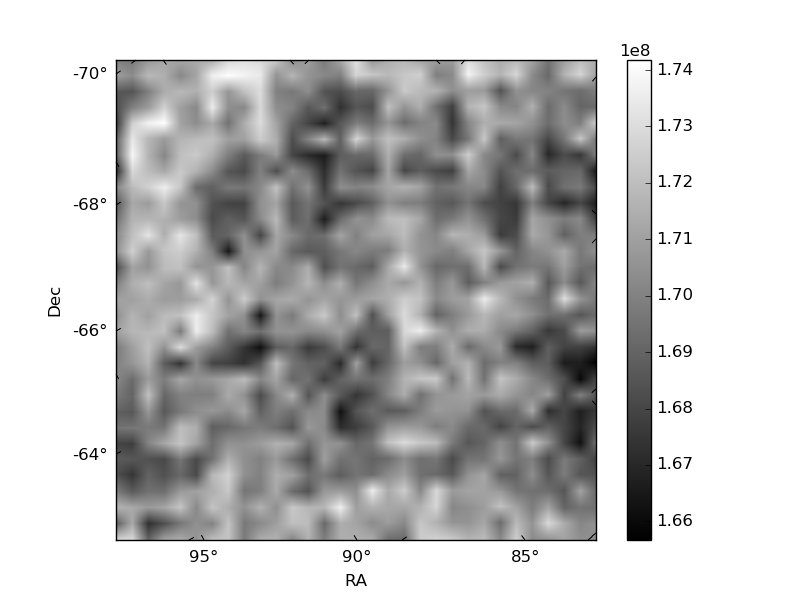
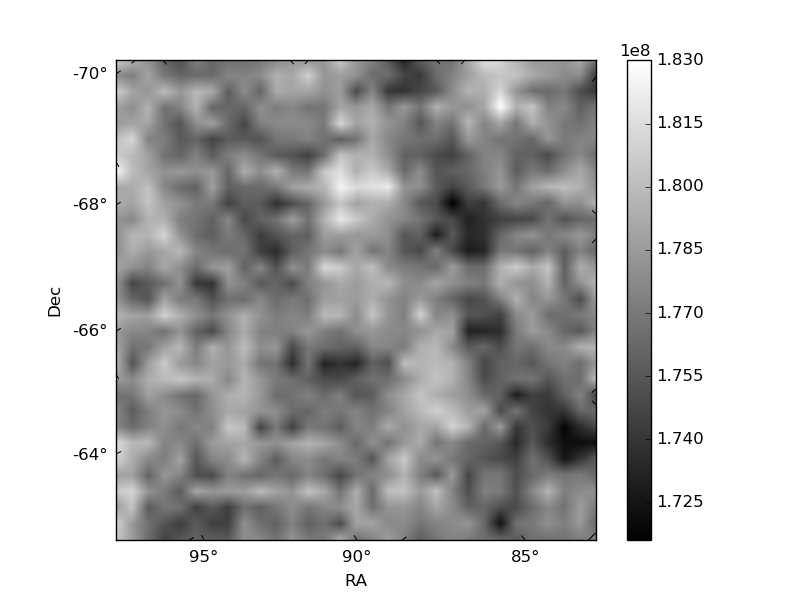
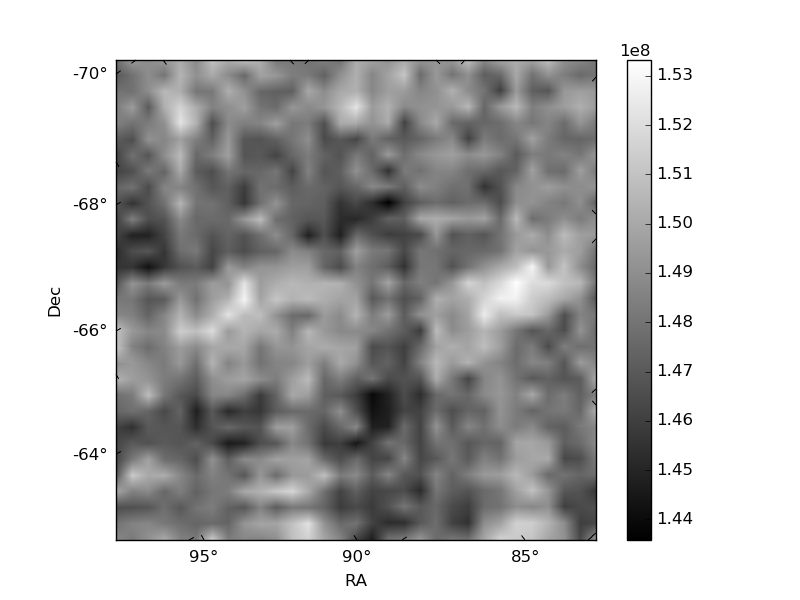
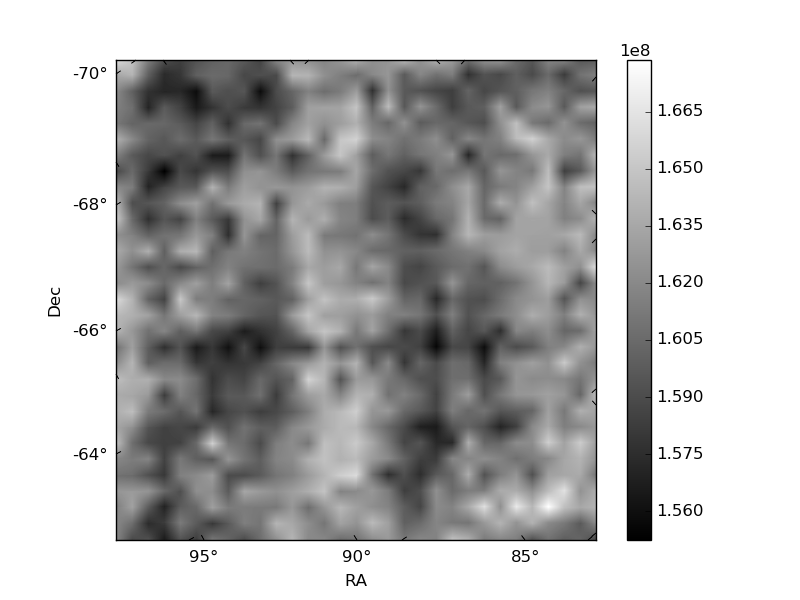
Histogram calculated using DETX and DETY for each event in the final _common_clean file
| Quadrant A | 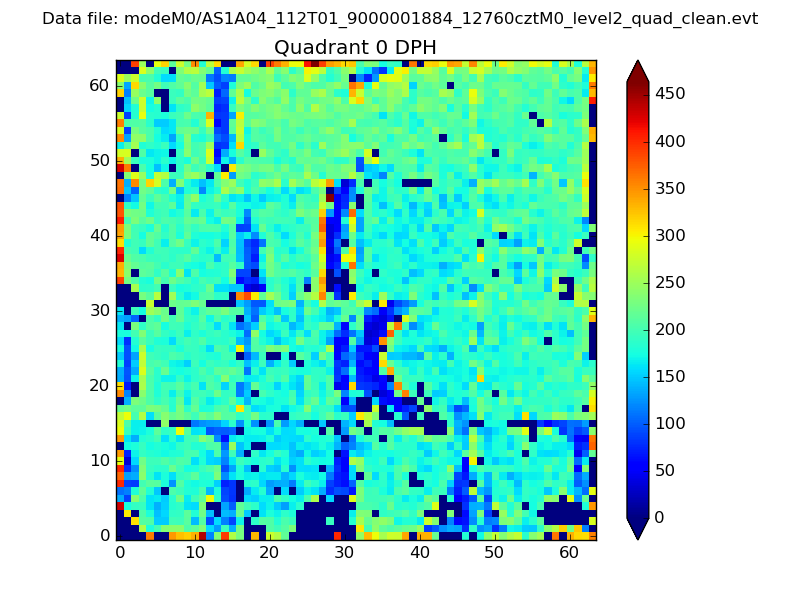 |
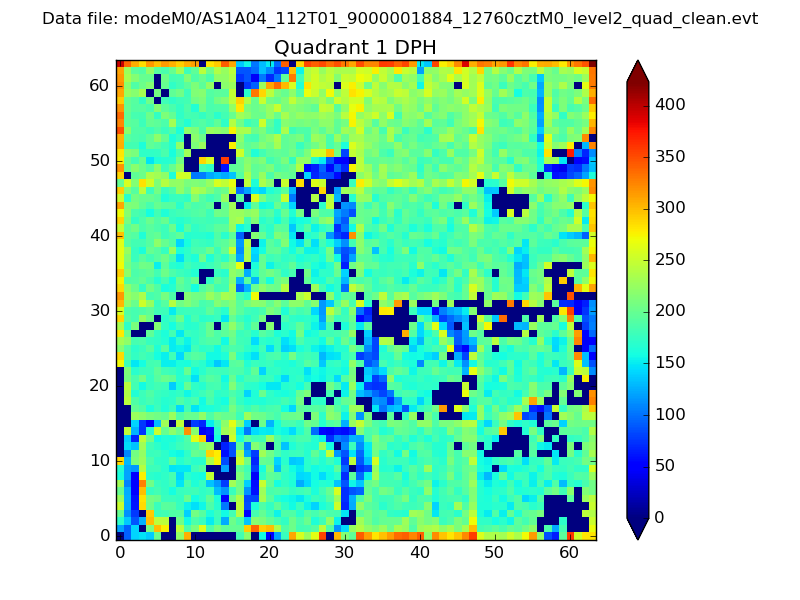 |
Quadrant B |
|---|---|---|---|
| Quadrant D | 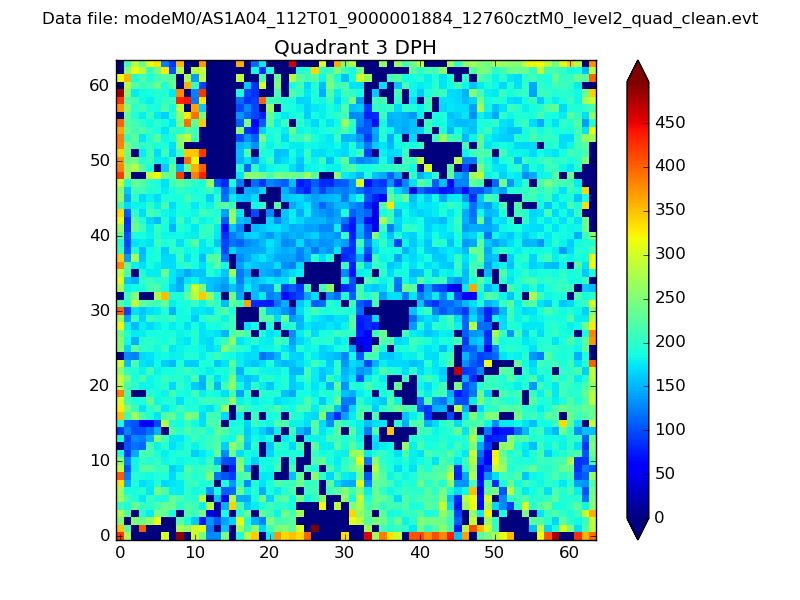 |
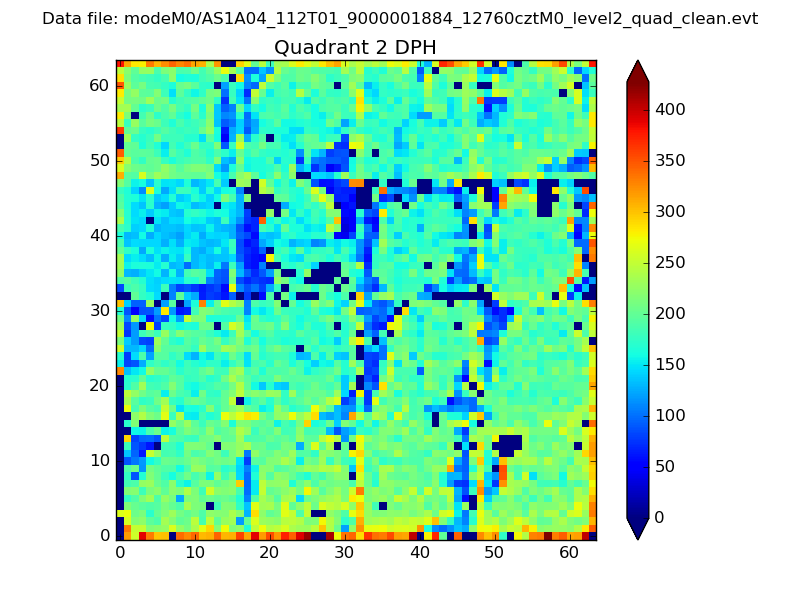 |
Quadrant C |
| Plot type | Count rate plots | Images |
|---|---|---|
| Comparison with Poisson distribution Blue bars denote a histogram of data divided into 1 sec bins. Red curve is a Poisson curve with rate = median count rate of data. |
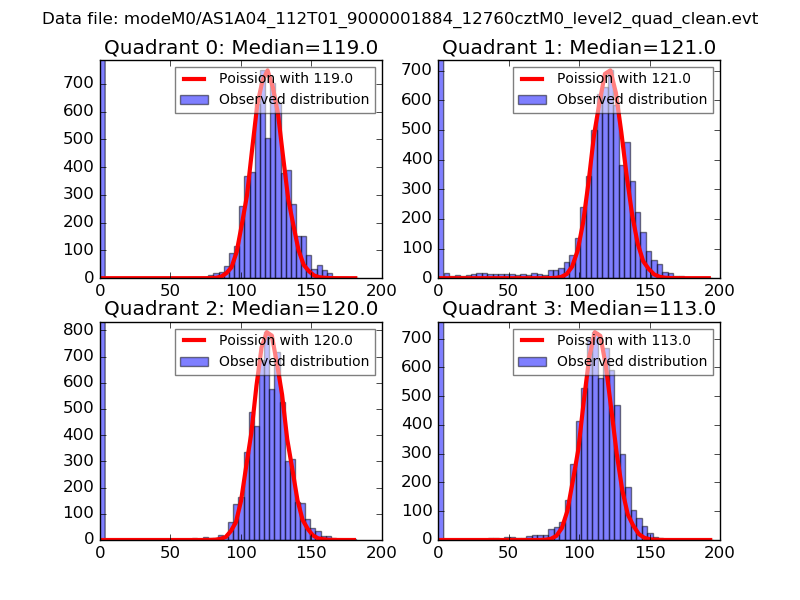 |
 |
| Quadrant-wise count rates Data is divided into 100 sec bins |
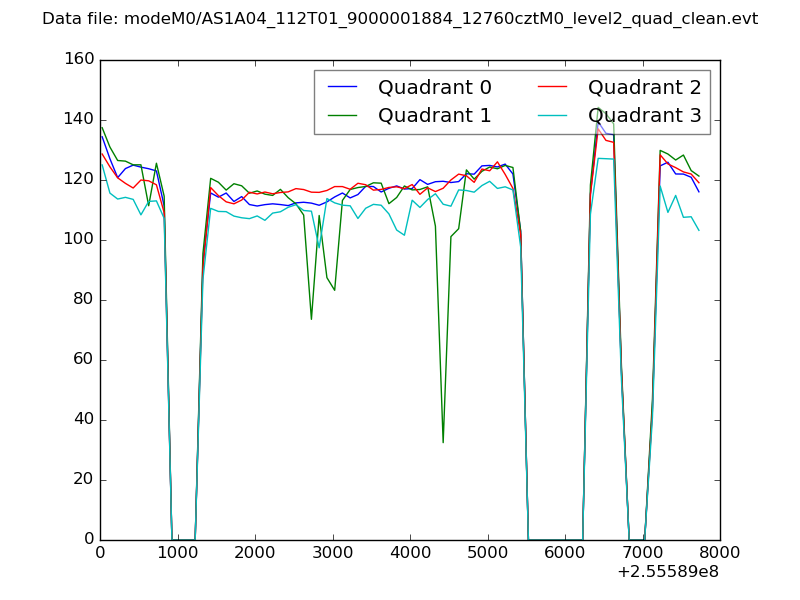 |
|
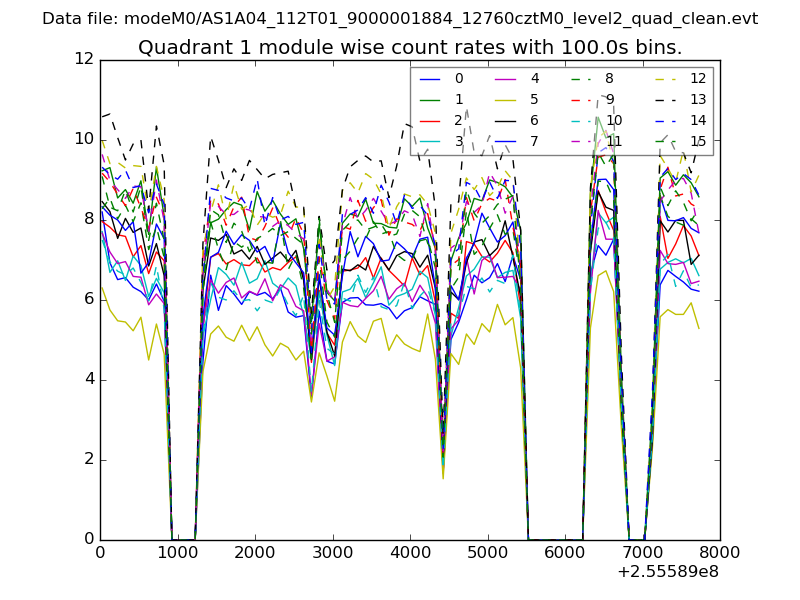
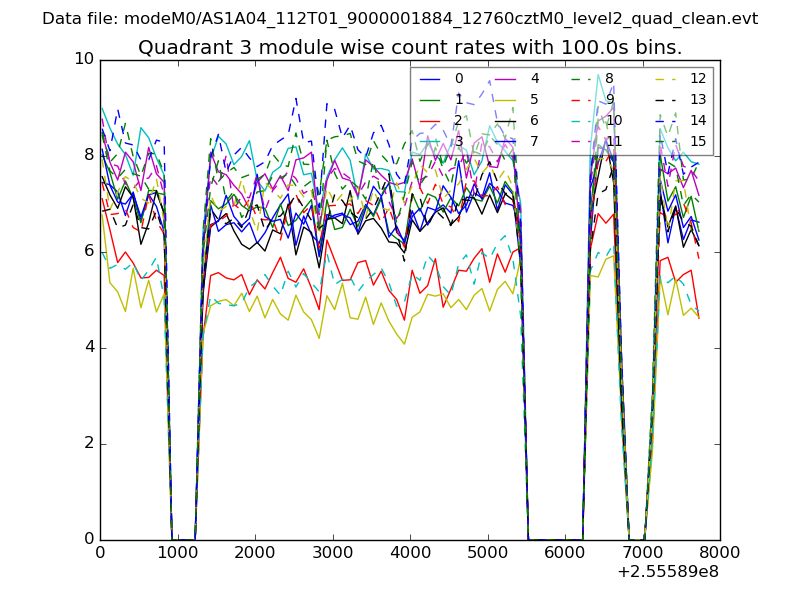
| Module-wise count rates for Quadrant A Data is divided into 100 sec bins |
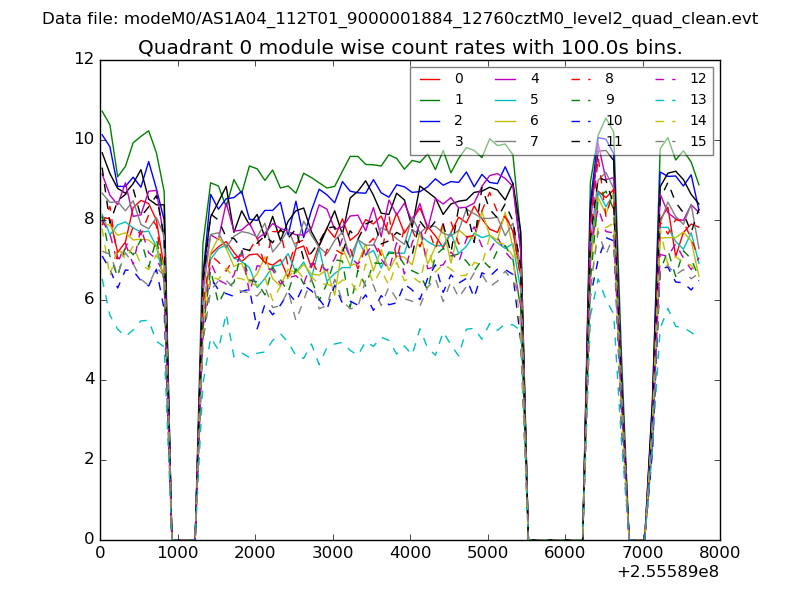 |
 |
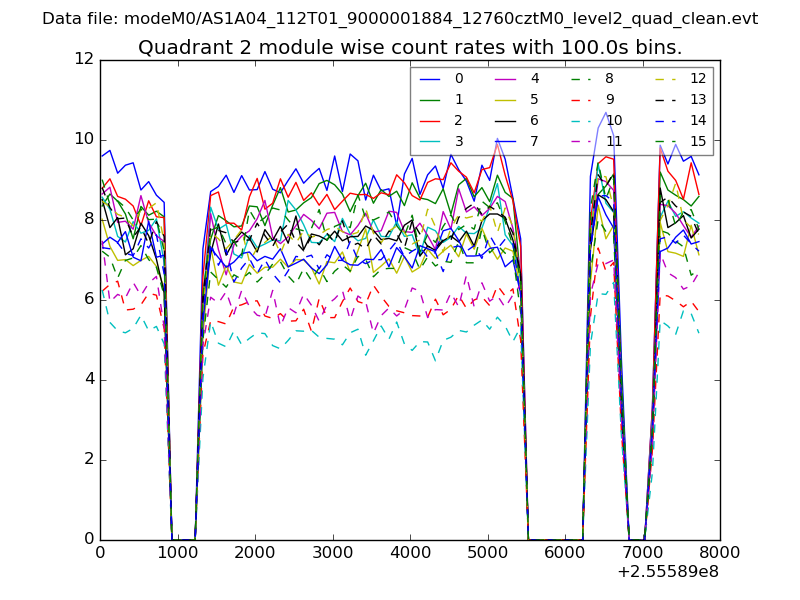
| Module-wise count rates for Quadrant B Data is divided into 100 sec bins |
 |
 |
| Module-wise count rates for Quadrant C Data is divided into 100 sec bins |
 |
 |
| Module-wise count rates for Quadrant D Data is divided into 100 sec bins |
 |
 |
| Parameter | Plot |
|---|---|
| CZT HV Monitor | 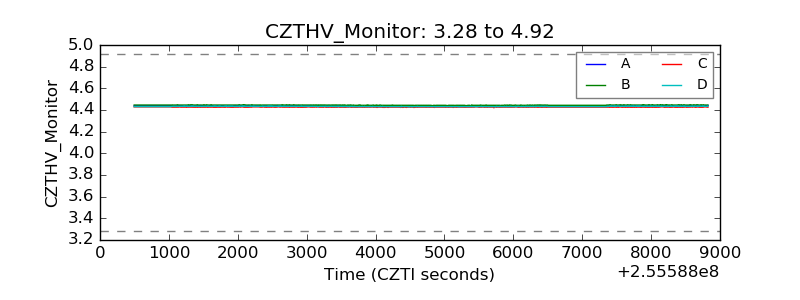 |
| D_VDD | 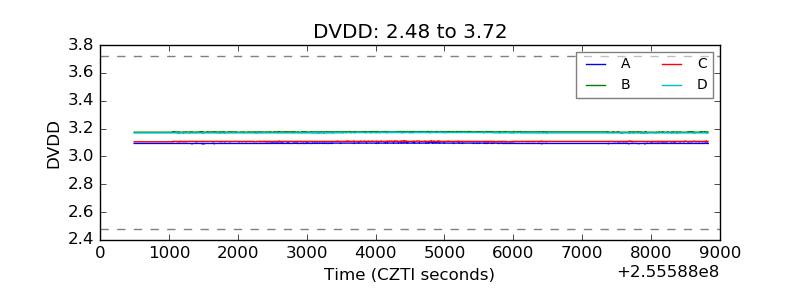 |
| Temperature 1 | 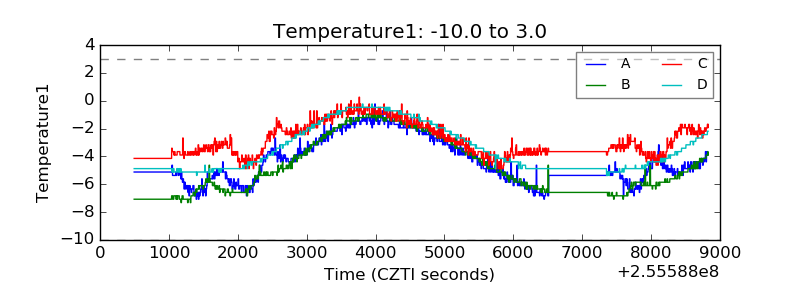 |
| Veto HV Monitor | 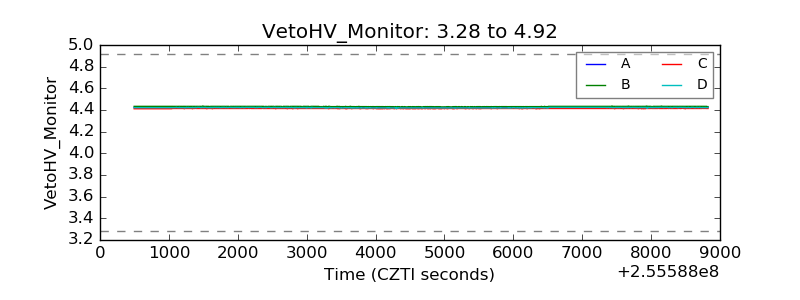 |
| Veto LLD |  |
| Alpha Counter | 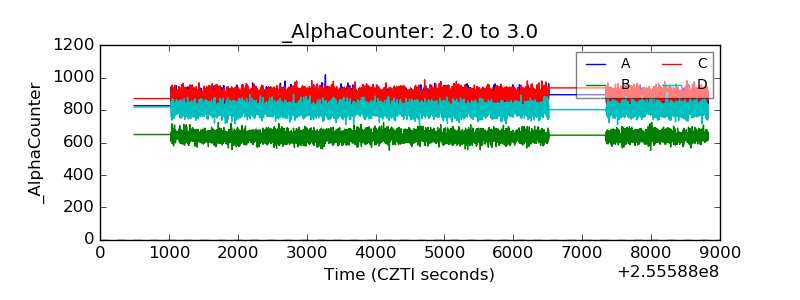 |
| _CPM_Rate | 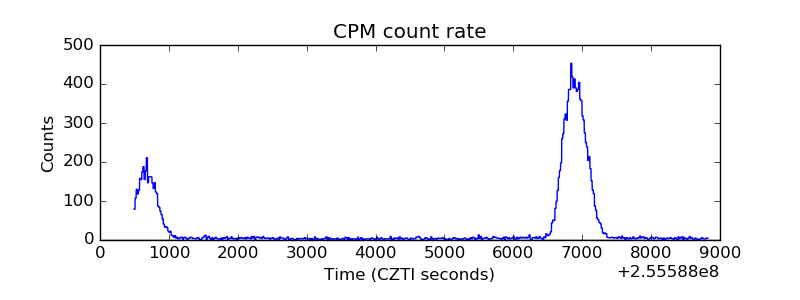 |
| CZT Counter | 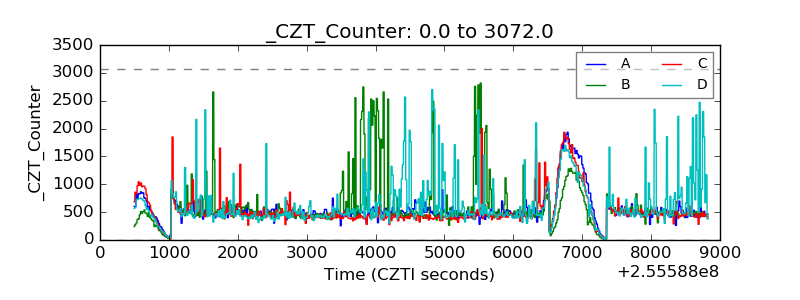 |
| +2.5 Volts monitor |  |
| +5 Volts monitor | 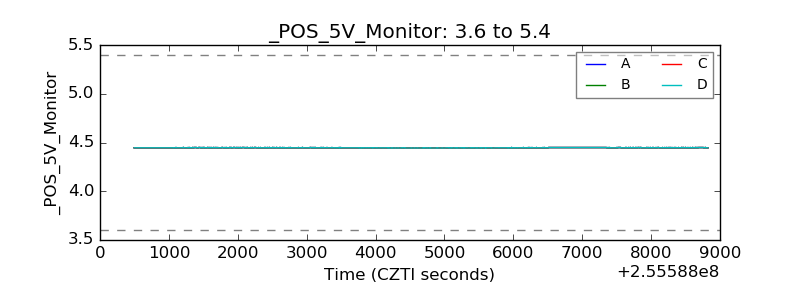 |
| _ROLL_ROT | 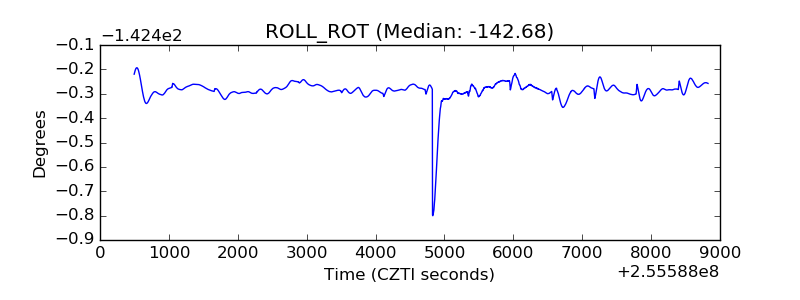 |
| _Roll_DEC | 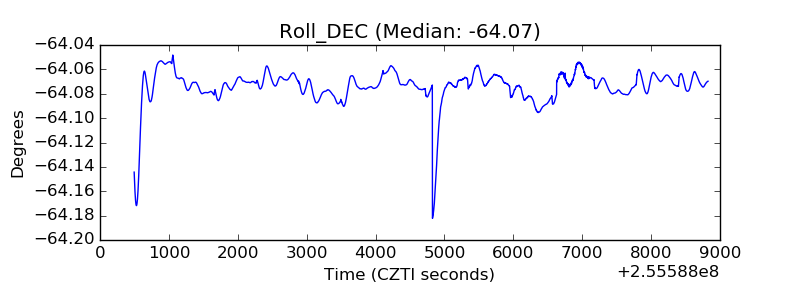 |
| _Roll_RA | 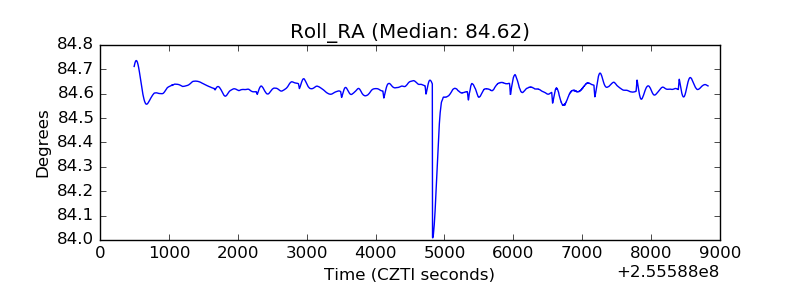 |
| Veto Counter | 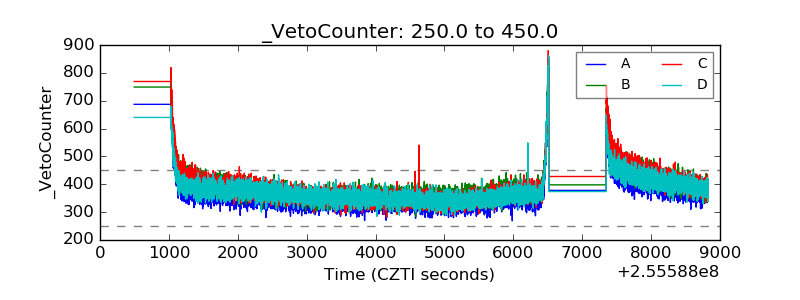 |