| Param | Original file | Final file |
|---|---|---|
| Filename | modeM0/AS1A04_112T01_9000001884_12761cztM0_level2.evt | modeM0/AS1A04_112T01_9000001884_12761cztM0_level2_quad_clean.evt |
| Size (bytes) | 527,238,720 | 111,611,520 |
| Size | 502.8 MB | 106.4 MB |
| Events in quadrant A | 3,572,790 | 738,237 |
| Events in quadrant B | 4,426,343 | 727,440 |
| Events in quadrant C | 3,434,457 | 736,099 |
| Events in quadrant D | 4,070,457 | 702,533 |
| Mode M0 | |||
|---|---|---|---|
| Quadrant | BADHDUFLAG | Total packets | Discarded packets |
| A | 0 | 14739 | 3 |
| B | 0 | 17454 | 2 |
| C | 0 | 14898 | 2 |
| D | 0 | 16712 | 2 |
| Mode SS | |||
|---|---|---|---|
| Quadrant | BADHDUFLAG | Total packets | Discarded packets |
| A | 0 | 142 | 0 |
| B | 0 | 142 | 0 |
| C | 0 | 142 | 0 |
| D | 0 | 142 | 0 |
| Mode M9 | |||
|---|---|---|---|
| Quadrant | BADHDUFLAG | Total packets | Discarded packets |
| A | 0 | 18 | 0 |
| B | 0 | 18 | 0 |
| C | 0 | 18 | 0 |
| D | 0 | 18 | 0 |
| Quadrant | Total seconds | Saturated seconds | Saturation percentage |
|---|---|---|---|
| A | 6821 | 105 | 1.539364% |
| B | 6821 | 499 | 7.315643% |
| C | 6821 | 155 | 2.272394% |
| D | 6821 | 236 | 3.459903% |
Noise dominated data is calculated using 1-second bins in cleaned event files. If a bin has >2000 counts, and if more than 50% of those come from <1% of pixels, then it is considered to be noise-dominated and hence unusable.
| Quadrant | # 1 sec bins | Bins with >0 counts | Bins with >2000 counts | High rate bins dominated by noise | Noise dominated (total time) | Noise dominated (detector-on time) | Marked lightcurve |
|---|---|---|---|---|---|---|---|
| A | 8653 | 6825 | 6 | 6 | 0.07% | 0.09% | 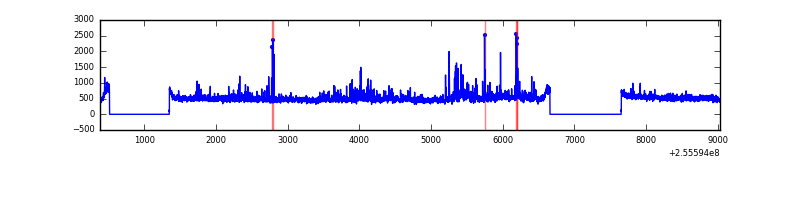 |
| B | 8653 | 6825 | 292 | 292 | 3.37% | 4.28% | 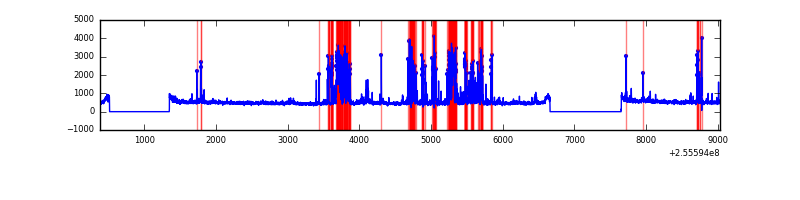 |
| C | 8653 | 6825 | 49 | 49 | 0.57% | 0.72% |  |
| D | 8653 | 6825 | 130 | 130 | 1.50% | 1.90% | 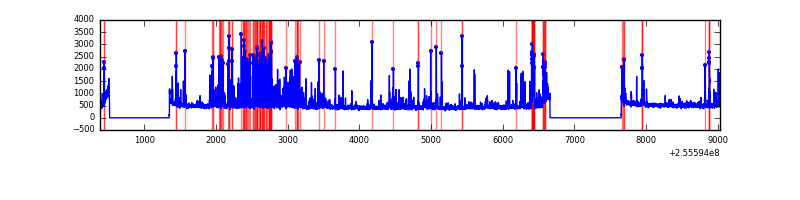 |
Top three noisy pixels from each quadrant. If the there are fewer than three noisy pixels in the level2.evt file, extra rows are filled as -1
| Pixel properties | Quadrant properties | ||||||
|---|---|---|---|---|---|---|---|
| Quadrant | DetID | PixID | Counts | Sigma | Mean | Median | Sigma |
| A | 15 | 239 | 244506 | 1467.15 | 818 | 799 | 166.1 |
| A | 12 | 189 | 86794 | 517.7 | 818 | 799 | 166.1 |
| A | 15 | 222 | 47773 | 282.79 | 818 | 799 | 166.1 |
| B | 4 | 239 | 1111787 | 7378.94 | 797 | 778 | 150.6 |
| B | 3 | 64 | 93319 | 614.63 | 797 | 778 | 150.6 |
| B | 0 | 214 | 21965 | 140.72 | 797 | 778 | 150.6 |
| C | 15 | 208 | 337035 | 1850.54 | 792 | 794 | 181.7 |
| C | 14 | 234 | 6716 | 32.59 | 792 | 794 | 181.7 |
| C | 13 | 61 | 5828 | 27.71 | 792 | 794 | 181.7 |
| D | 1 | 52 | 746030 | 3908.41 | 789 | 764 | 190.7 |
| D | 8 | 195 | 115095 | 599.59 | 789 | 764 | 190.7 |
| D | 2 | 136 | 87980 | 457.39 | 789 | 764 | 190.7 |
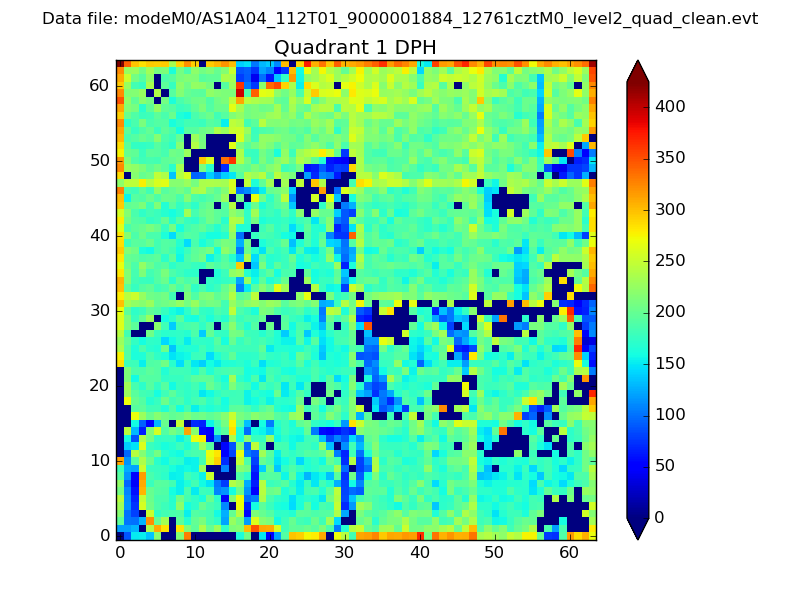
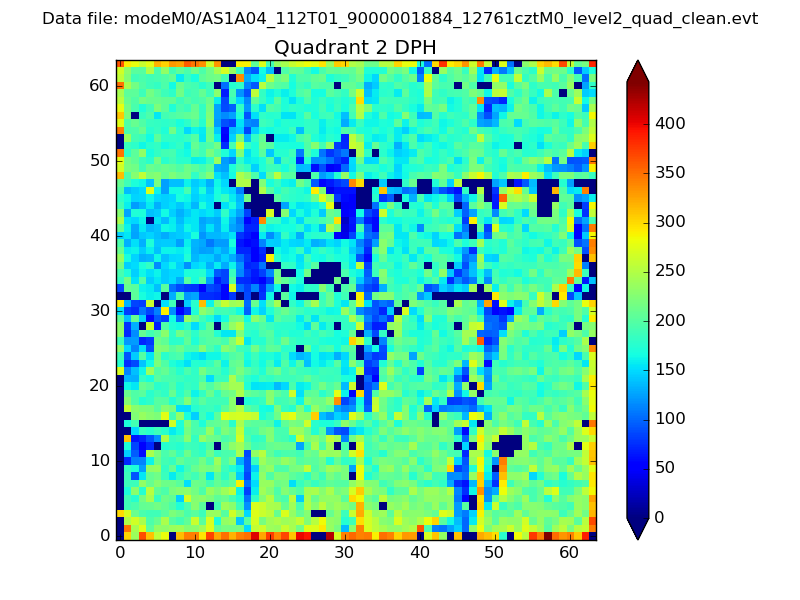
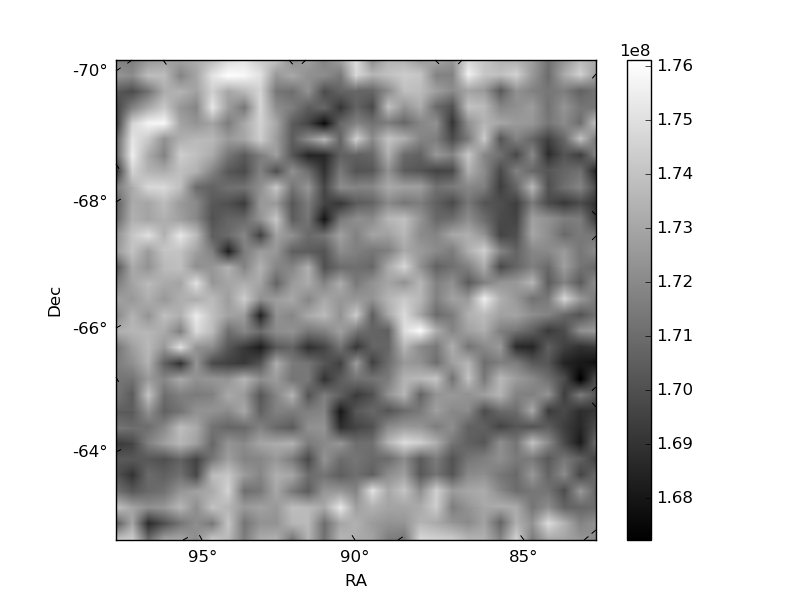
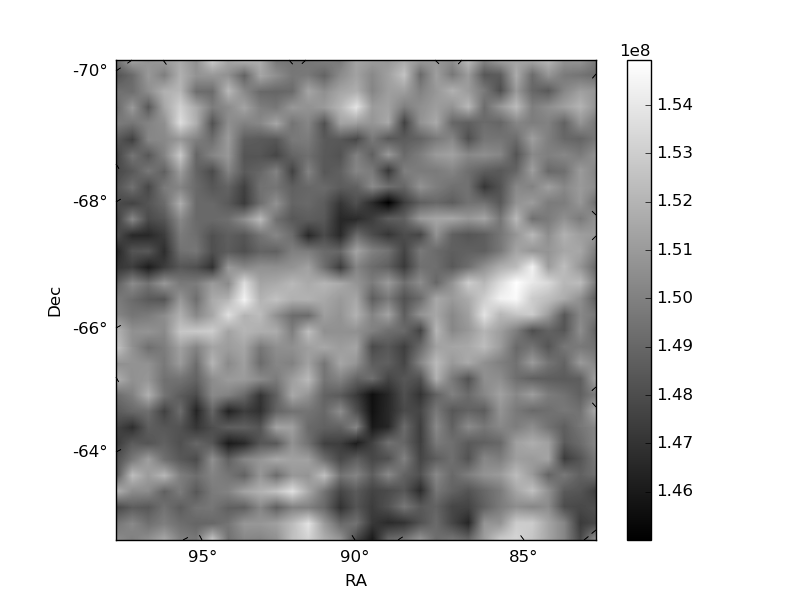
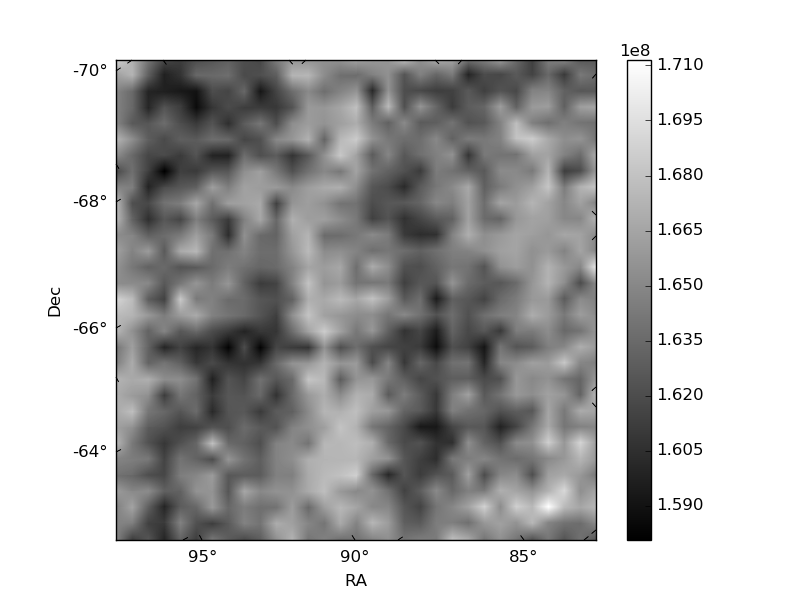
Histogram calculated using DETX and DETY for each event in the final _common_clean file
| Quadrant A | 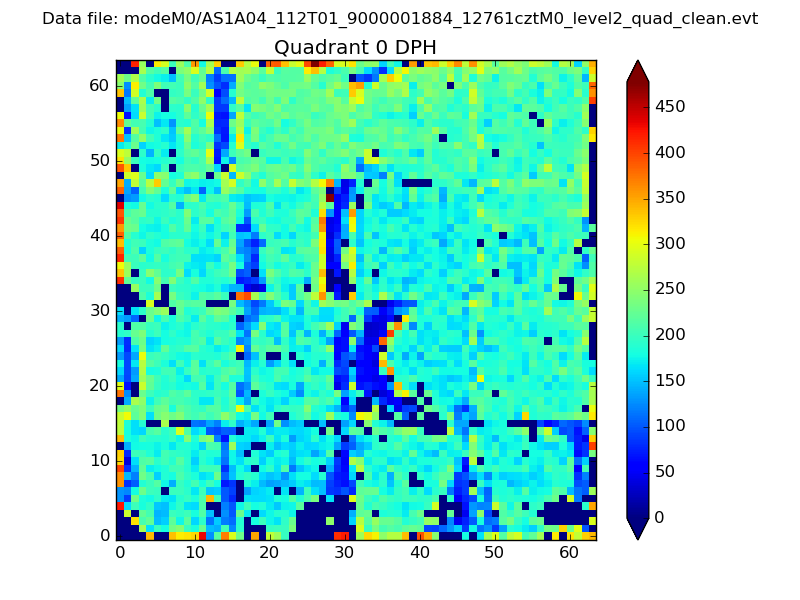 |
 |
Quadrant B |
|---|---|---|---|
| Quadrant D | 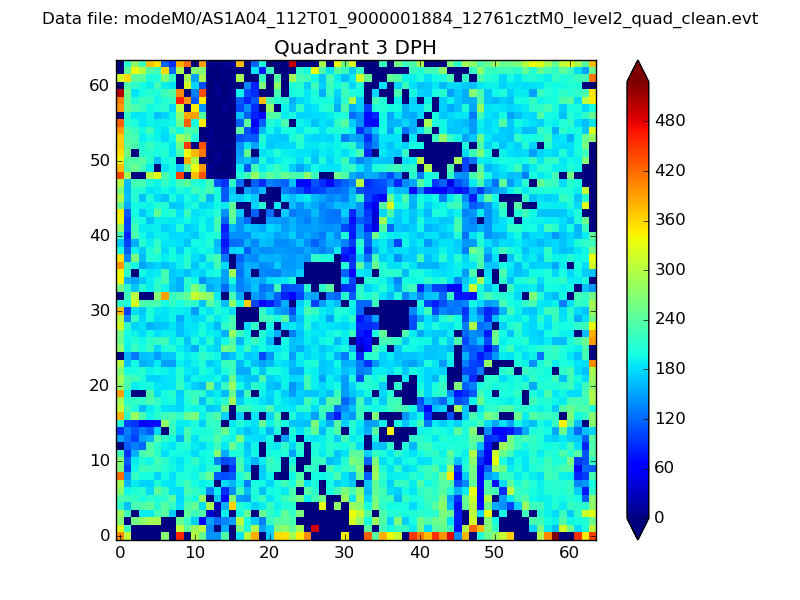 |
 |
Quadrant C |
| Plot type | Count rate plots | Images |
|---|---|---|
| Comparison with Poisson distribution Blue bars denote a histogram of data divided into 1 sec bins. Red curve is a Poisson curve with rate = median count rate of data. |
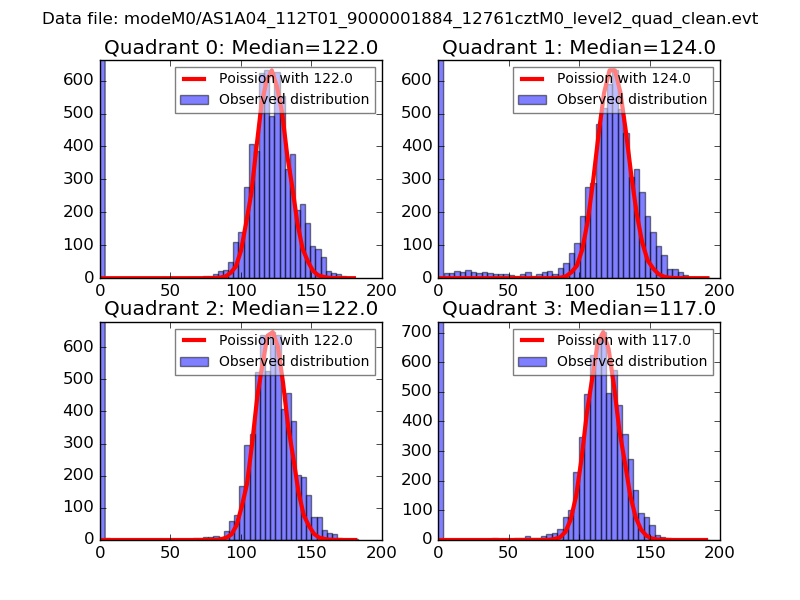 |
 |
| Quadrant-wise count rates Data is divided into 100 sec bins |
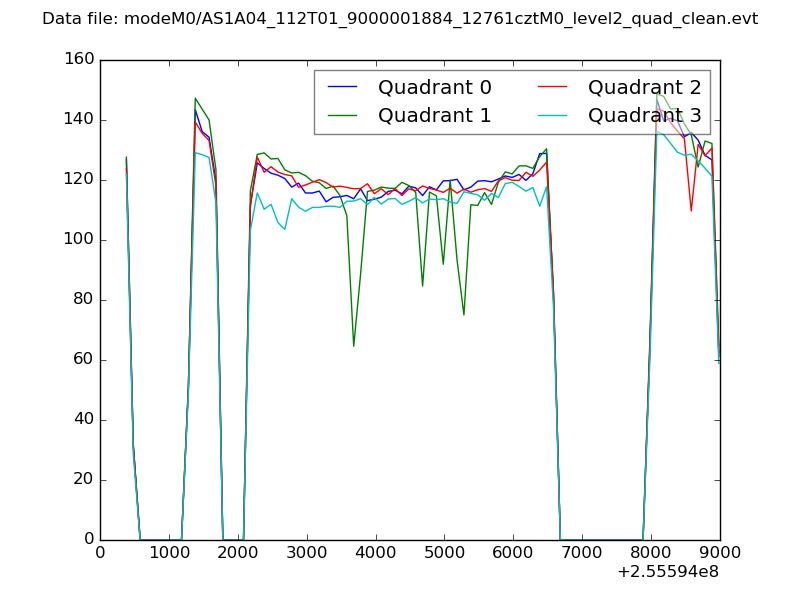 |
|
| Module-wise count rates for Quadrant A Data is divided into 100 sec bins |
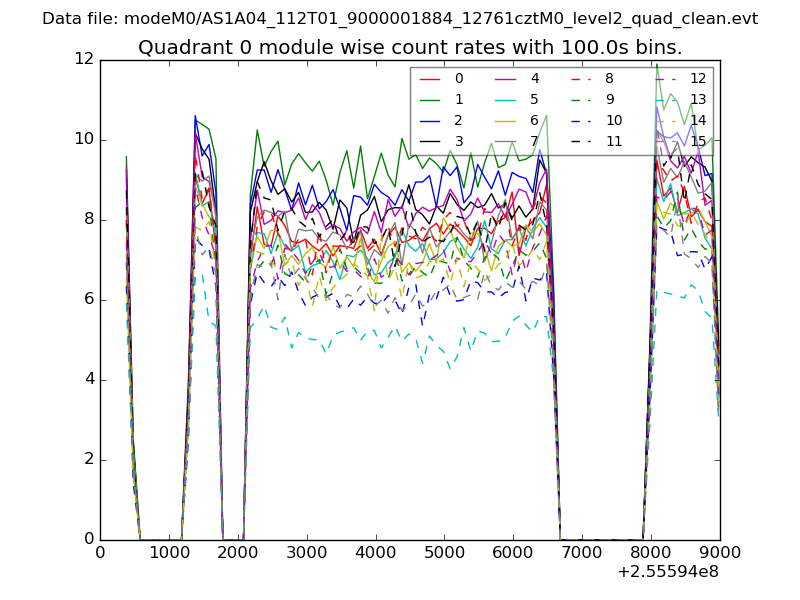 |
 |
| Module-wise count rates for Quadrant B Data is divided into 100 sec bins |
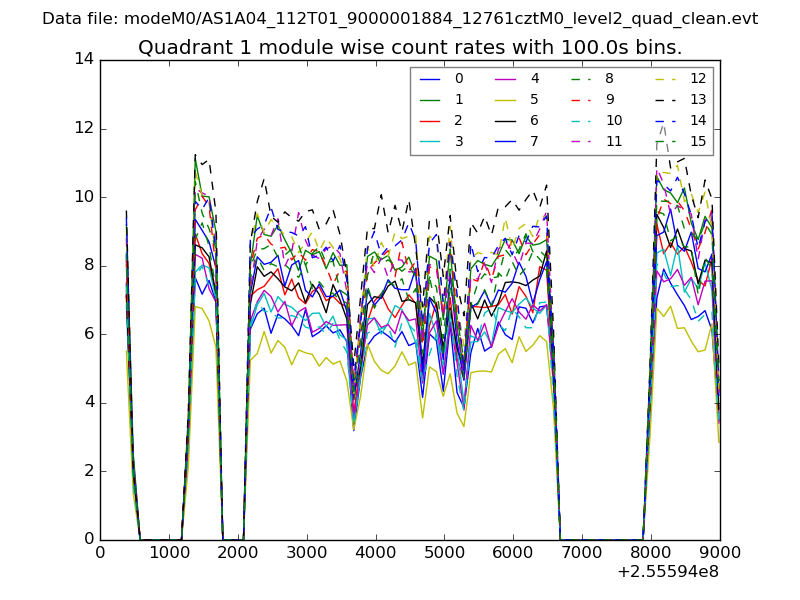 |
 |
| Module-wise count rates for Quadrant C Data is divided into 100 sec bins |
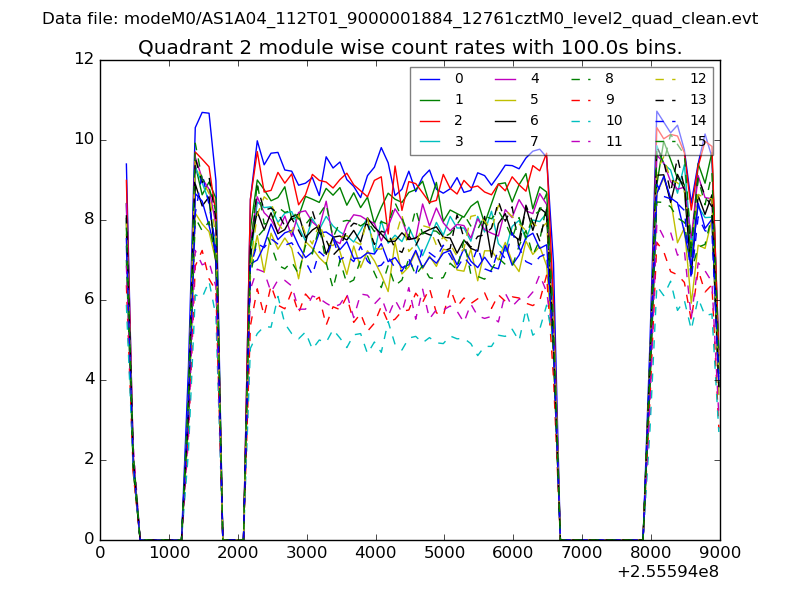 |
 |
| Module-wise count rates for Quadrant D Data is divided into 100 sec bins |
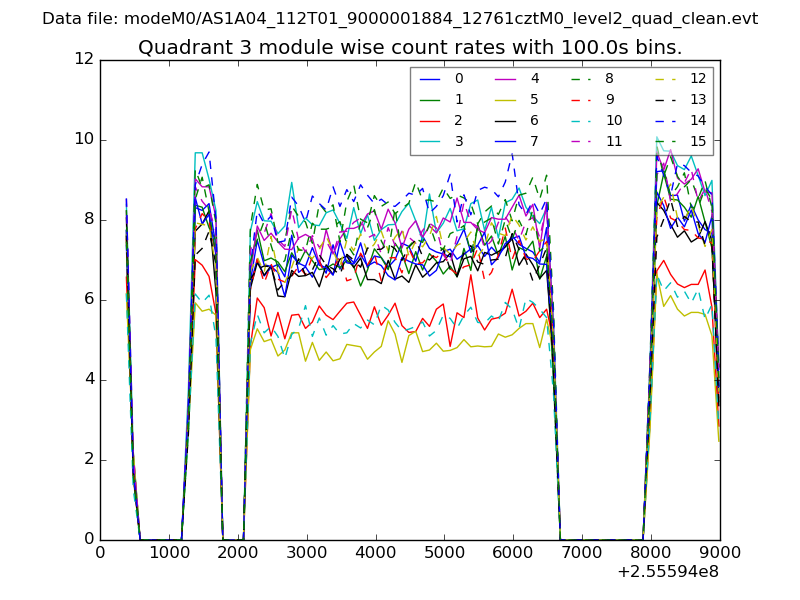 |
 |
| Parameter | Plot |
|---|---|
| CZT HV Monitor | 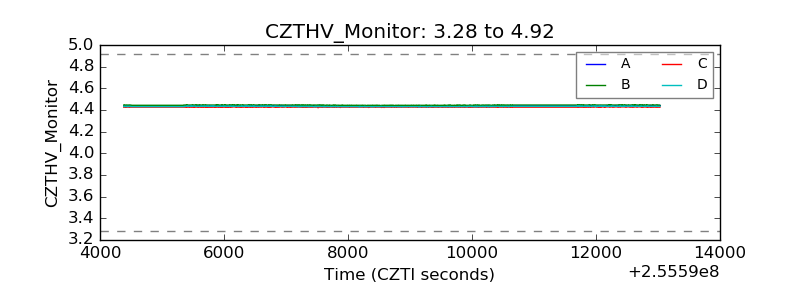 |
| D_VDD | 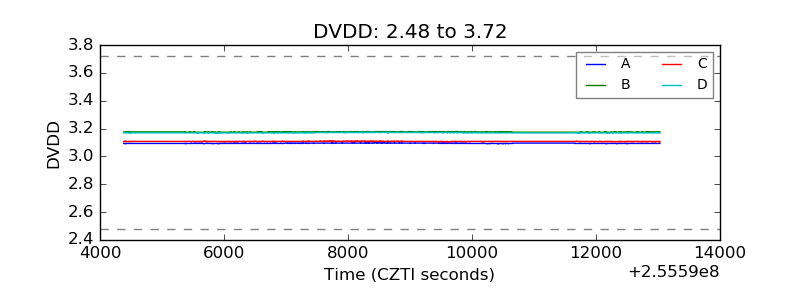 |
| Temperature 1 | 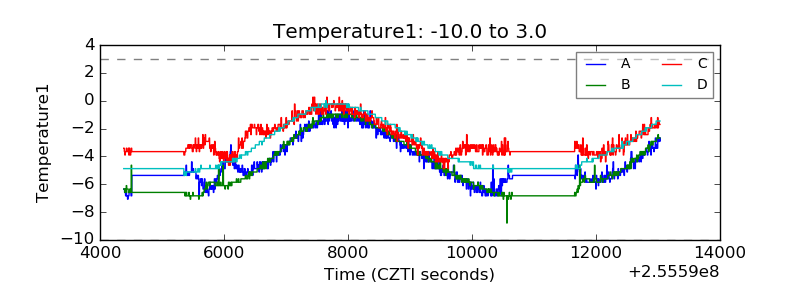 |
| Veto HV Monitor | 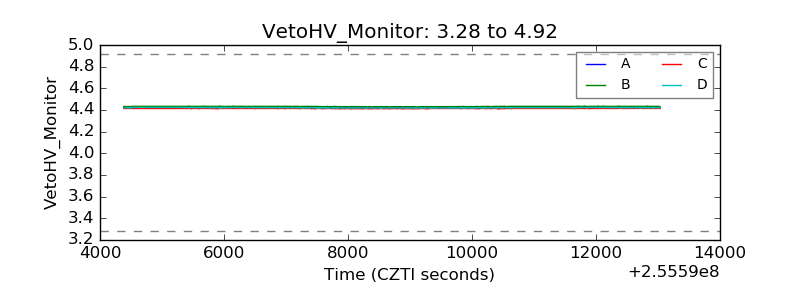 |
| Veto LLD | 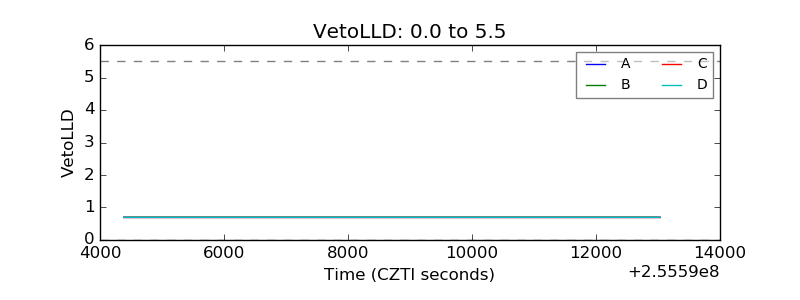 |
| Alpha Counter | 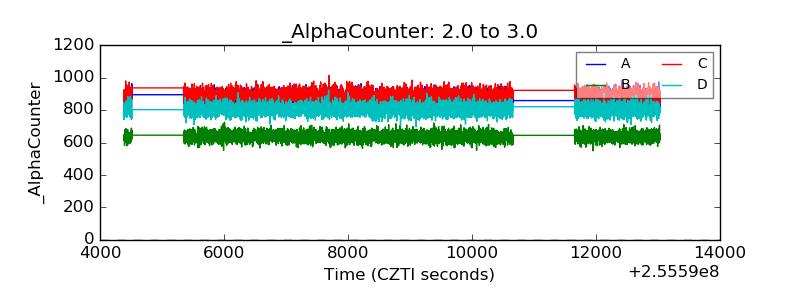 |
| _CPM_Rate | 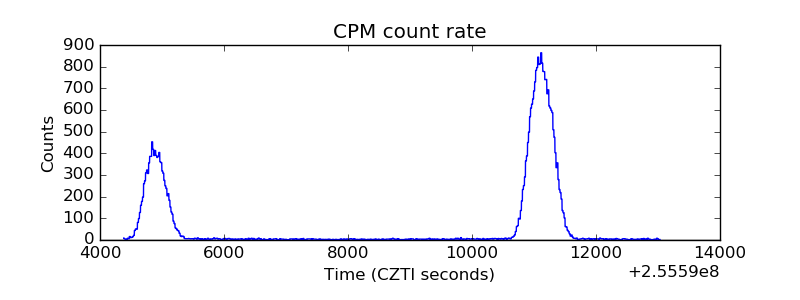 |
| CZT Counter | 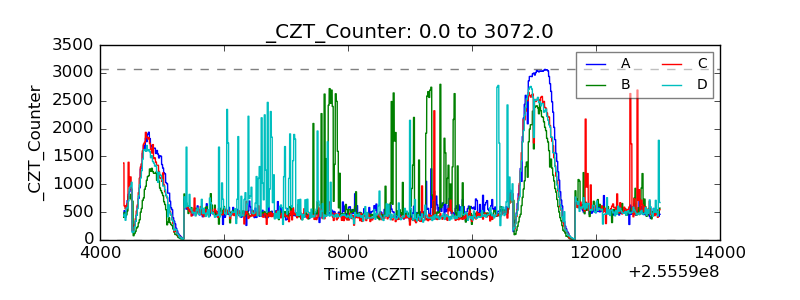 |
| +2.5 Volts monitor |  |
| +5 Volts monitor |  |
| _ROLL_ROT | 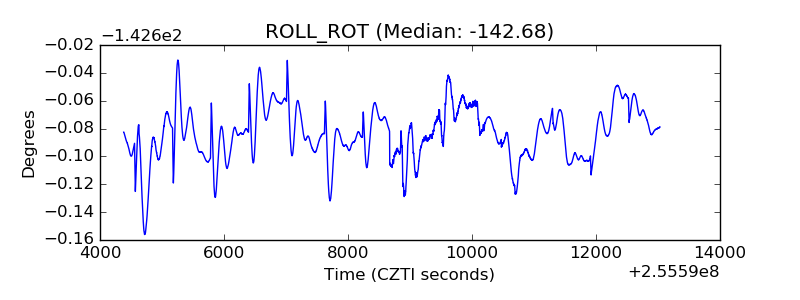 |
| _Roll_DEC | 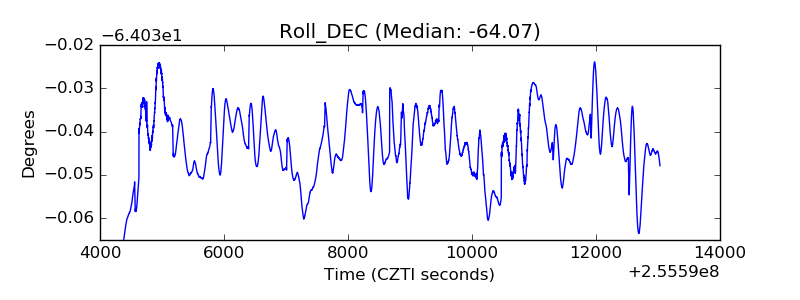 |
| _Roll_RA | 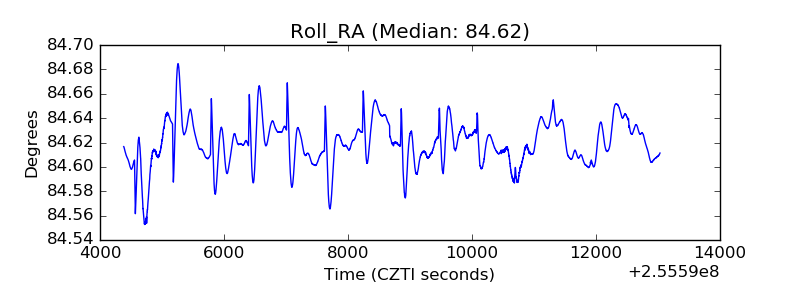 |
| Veto Counter | 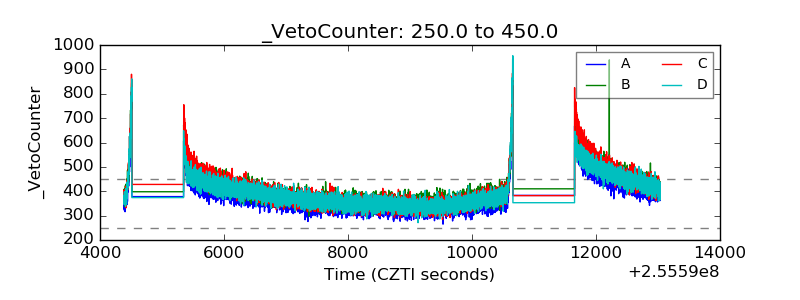 |