| Param | Original file | Final file |
|---|---|---|
| Filename | modeM0/AS1A04_112T01_9000001884_12765cztM0_level2.evt | modeM0/AS1A04_112T01_9000001884_12765cztM0_level2_quad_clean.evt |
| Size (bytes) | 529,323,840 | 127,572,480 |
| Size | 504.8 MB | 121.7 MB |
| Events in quadrant A | 3,214,204 | 893,491 |
| Events in quadrant B | 4,940,672 | 845,157 |
| Events in quadrant C | 3,375,080 | 864,241 |
| Events in quadrant D | 4,077,928 | 825,766 |
| Mode M0 | |||
|---|---|---|---|
| Quadrant | BADHDUFLAG | Total packets | Discarded packets |
| A | 0 | 13478 | 2 |
| B | 0 | 18775 | 1 |
| C | 0 | 14264 | 1 |
| D | 0 | 16239 | 1 |
| Mode SS | |||
|---|---|---|---|
| Quadrant | BADHDUFLAG | Total packets | Discarded packets |
| A | 0 | 126 | 0 |
| B | 0 | 126 | 0 |
| C | 0 | 126 | 0 |
| D | 0 | 126 | 0 |
| Mode M9 | |||
|---|---|---|---|
| Quadrant | BADHDUFLAG | Total packets | Discarded packets |
| A | 0 | 13 | 0 |
| B | 0 | 13 | 0 |
| C | 0 | 13 | 0 |
| D | 0 | 13 | 0 |
| Quadrant | Total seconds | Saturated seconds | Saturation percentage |
|---|---|---|---|
| A | 6236 | 71 | 1.138550% |
| B | 6236 | 742 | 11.898653% |
| C | 6236 | 106 | 1.699808% |
| D | 6236 | 251 | 4.025016% |
Noise dominated data is calculated using 1-second bins in cleaned event files. If a bin has >2000 counts, and if more than 50% of those come from <1% of pixels, then it is considered to be noise-dominated and hence unusable.
| Quadrant | # 1 sec bins | Bins with >0 counts | Bins with >2000 counts | High rate bins dominated by noise | Noise dominated (total time) | Noise dominated (detector-on time) | Marked lightcurve |
|---|---|---|---|---|---|---|---|
| A | 7492 | 6237 | 0 | 0 | 0.00% | 0.00% | 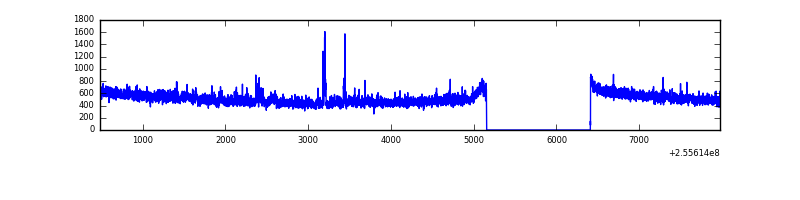 |
| B | 7492 | 6237 | 518 | 518 | 6.91% | 8.31% | 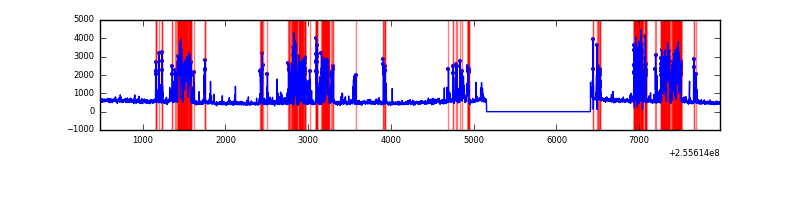 |
| C | 7492 | 6237 | 39 | 39 | 0.52% | 0.63% | 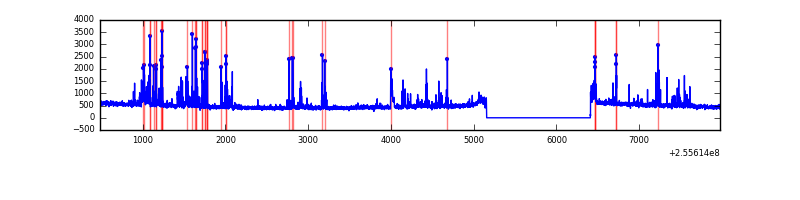 |
| D | 7492 | 6237 | 160 | 160 | 2.14% | 2.57% | 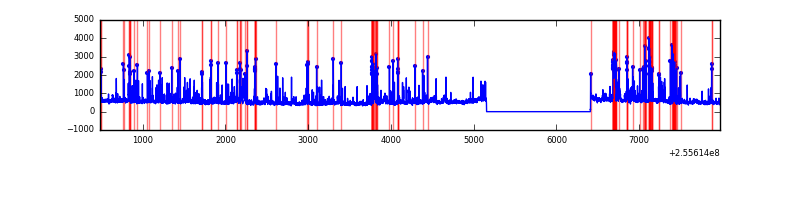 |
Top three noisy pixels from each quadrant. If the there are fewer than three noisy pixels in the level2.evt file, extra rows are filled as -1
| Pixel properties | Quadrant properties | ||||||
|---|---|---|---|---|---|---|---|
| Quadrant | DetID | PixID | Counts | Sigma | Mean | Median | Sigma |
| A | 12 | 189 | 108258 | 680.33 | 791 | 778 | 158.0 |
| A | 8 | 6 | 26460 | 162.56 | 791 | 778 | 158.0 |
| A | 15 | 239 | 16776 | 101.26 | 791 | 778 | 158.0 |
| B | 4 | 239 | 1708492 | 12418.59 | 744 | 727 | 137.5 |
| B | 0 | 85 | 199707 | 1446.95 | 744 | 727 | 137.5 |
| B | 3 | 64 | 27985 | 198.22 | 744 | 727 | 137.5 |
| C | 15 | 208 | 432955 | 2551.93 | 746 | 751 | 169.4 |
| C | 12 | 4 | 28219 | 162.18 | 746 | 751 | 169.4 |
| C | 14 | 234 | 7457 | 39.59 | 746 | 751 | 169.4 |
| D | 1 | 52 | 702294 | 3924.57 | 746 | 724 | 178.8 |
| D | 8 | 195 | 267579 | 1492.78 | 746 | 724 | 178.8 |
| D | 13 | 104 | 79770 | 442.18 | 746 | 724 | 178.8 |
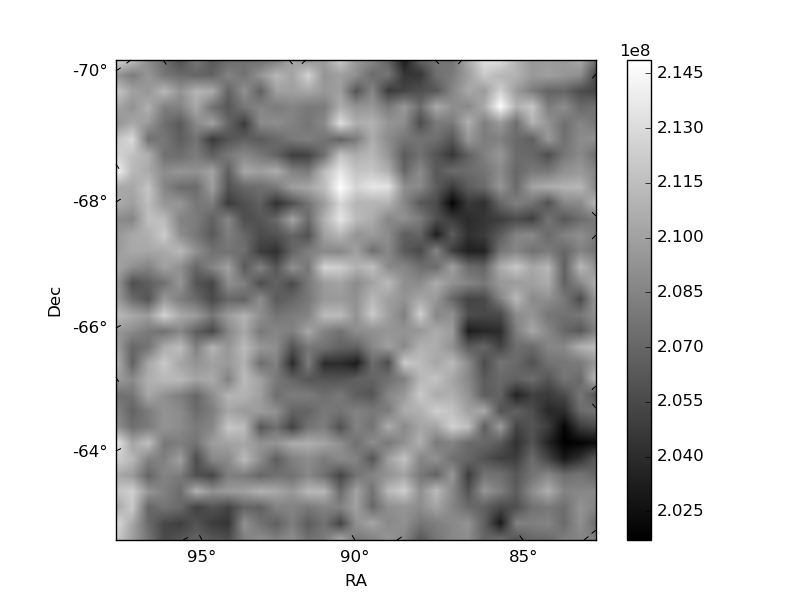
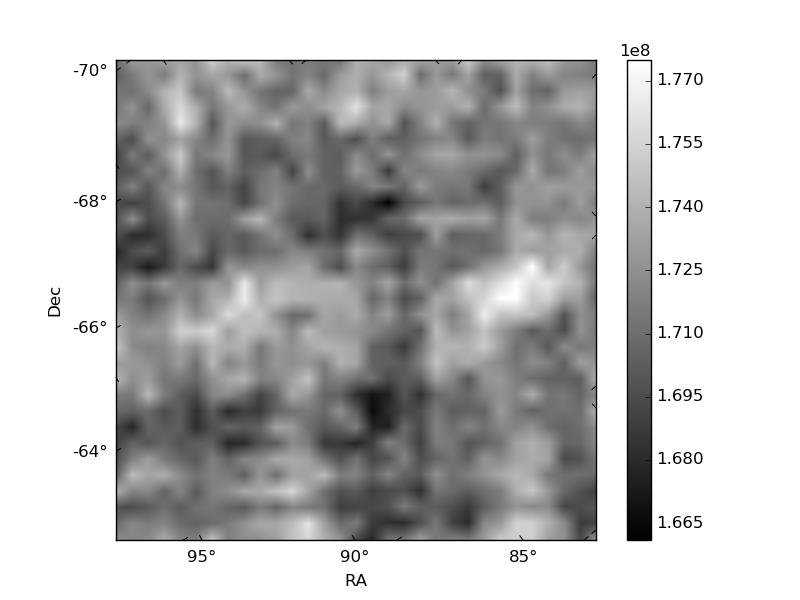
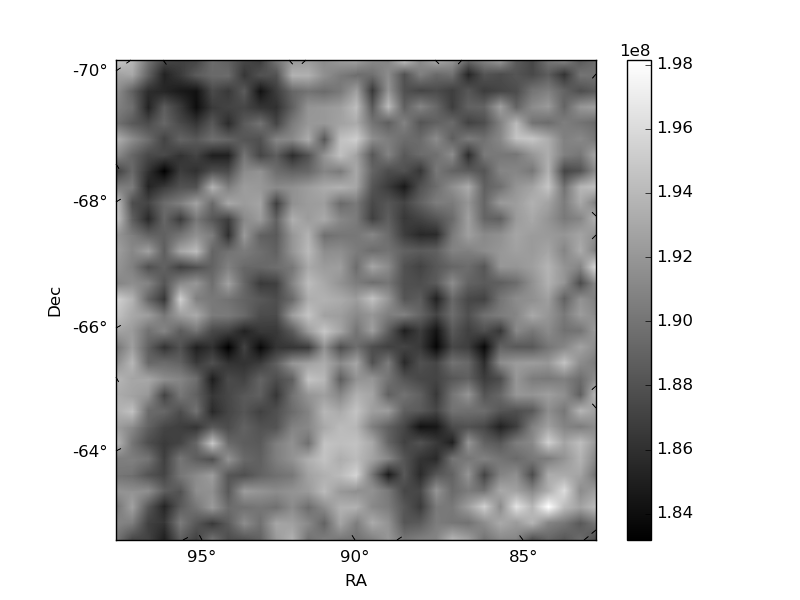
Histogram calculated using DETX and DETY for each event in the final _common_clean file
| Quadrant A | 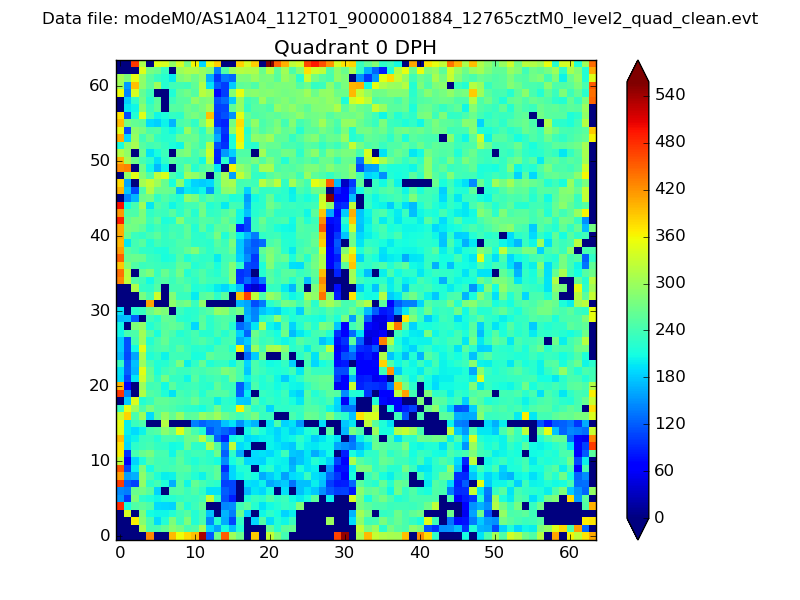 |
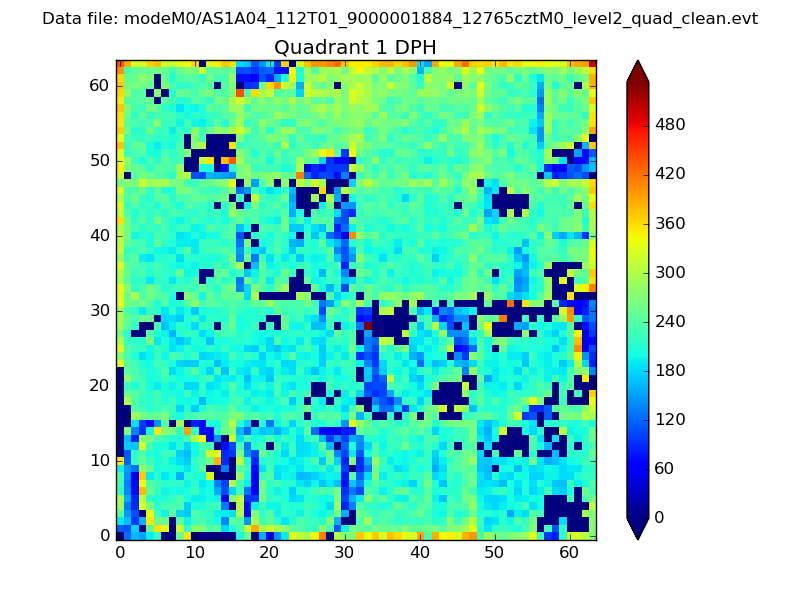 |
Quadrant B |
|---|---|---|---|
| Quadrant D | 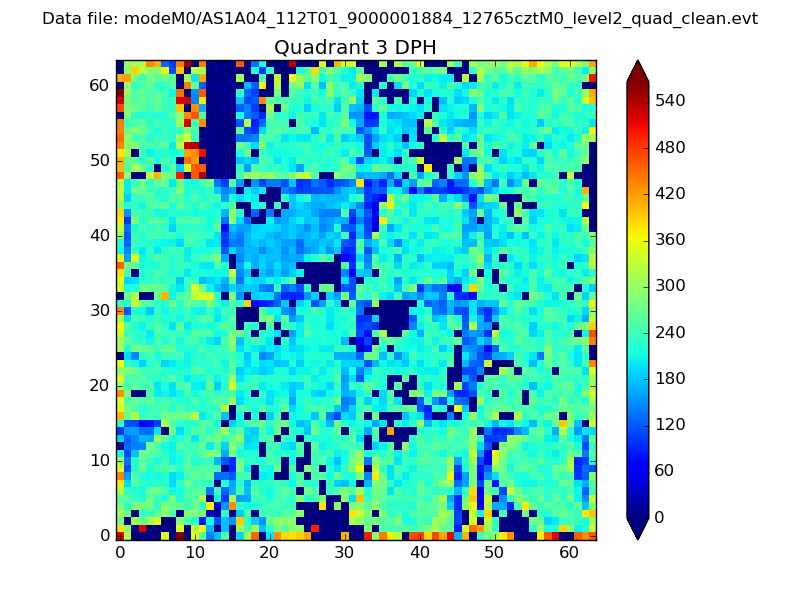 |
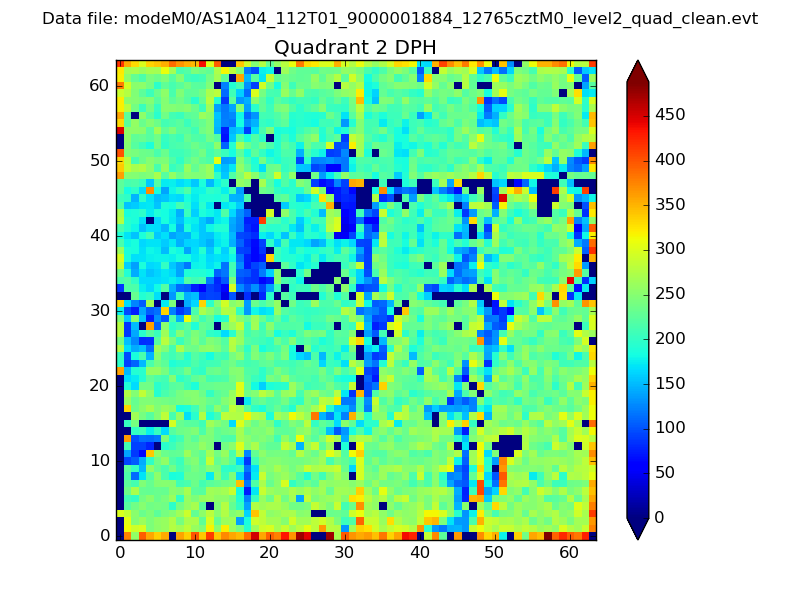 |
Quadrant C |
| Plot type | Count rate plots | Images |
|---|---|---|
| Comparison with Poisson distribution Blue bars denote a histogram of data divided into 1 sec bins. Red curve is a Poisson curve with rate = median count rate of data. |
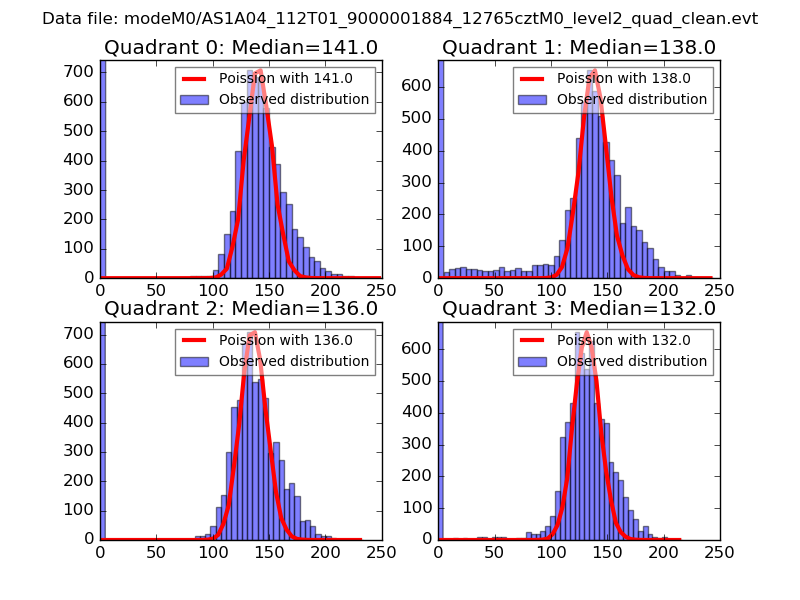 |
 |
| Quadrant-wise count rates Data is divided into 100 sec bins |
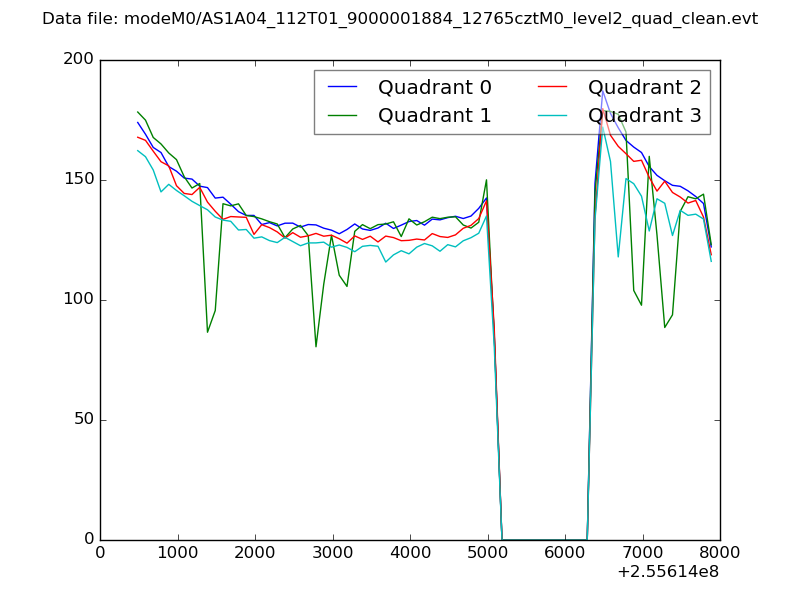 |
|
| Module-wise count rates for Quadrant A Data is divided into 100 sec bins |
 |
 |
| Module-wise count rates for Quadrant B Data is divided into 100 sec bins |
 |
 |
| Module-wise count rates for Quadrant C Data is divided into 100 sec bins |
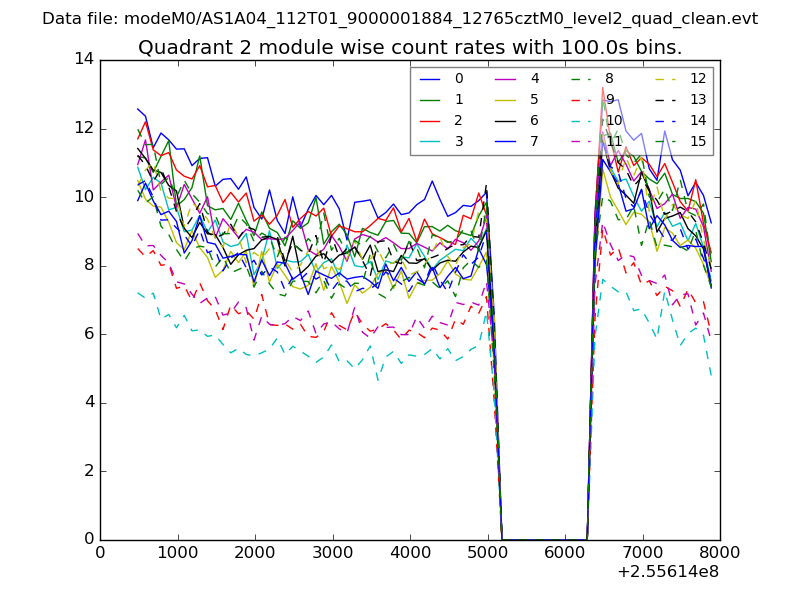 |
 |
| Module-wise count rates for Quadrant D Data is divided into 100 sec bins |
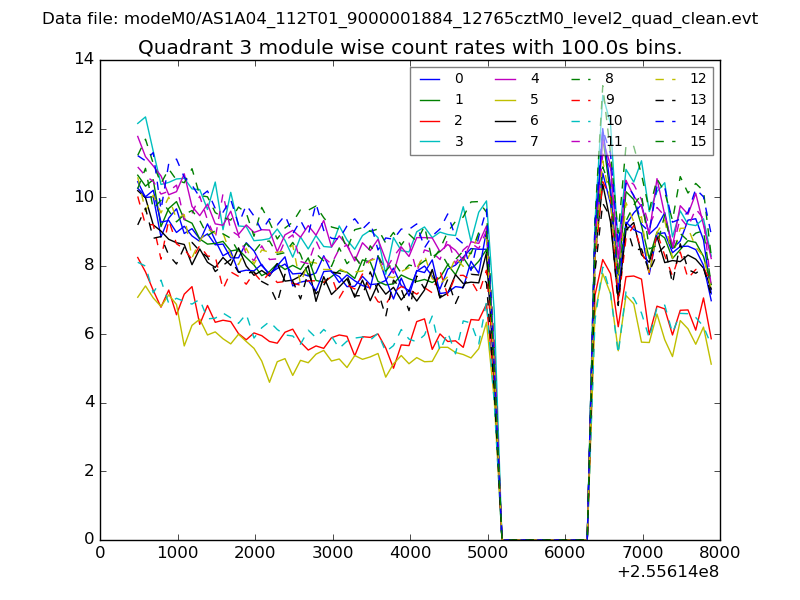 |
 |
| Parameter | Plot |
|---|---|
| CZT HV Monitor | 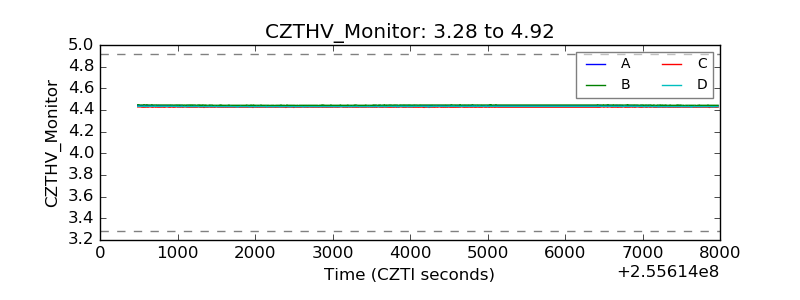 |
| D_VDD | 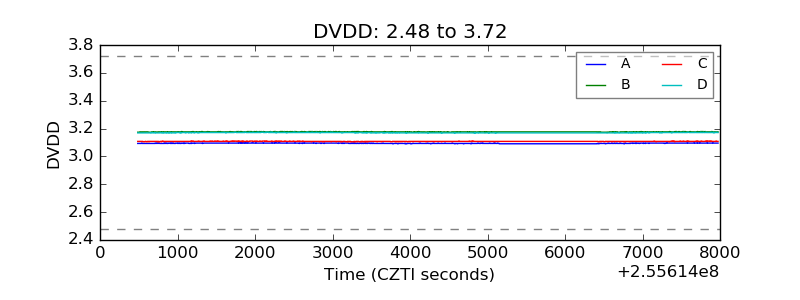 |
| Temperature 1 | 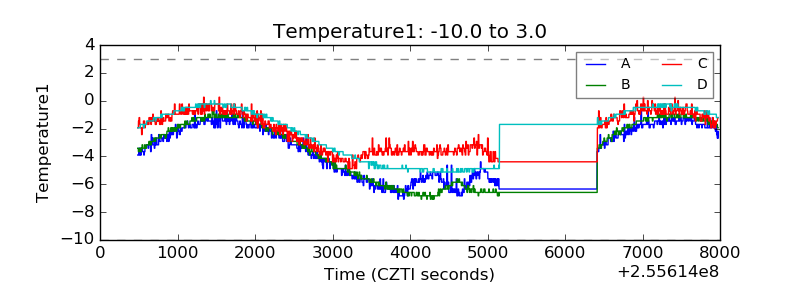 |
| Veto HV Monitor | 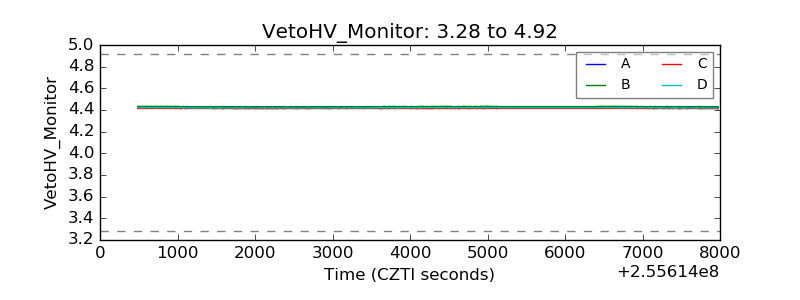 |
| Veto LLD | 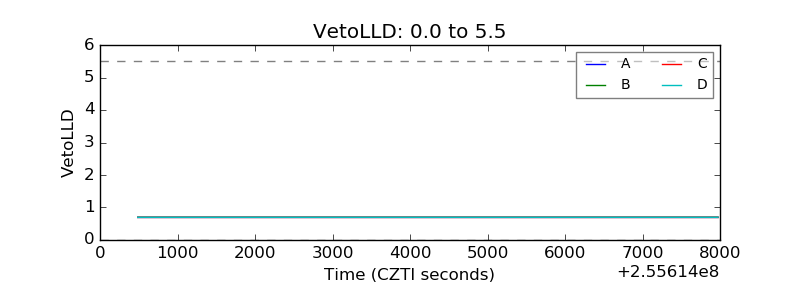 |
| Alpha Counter | 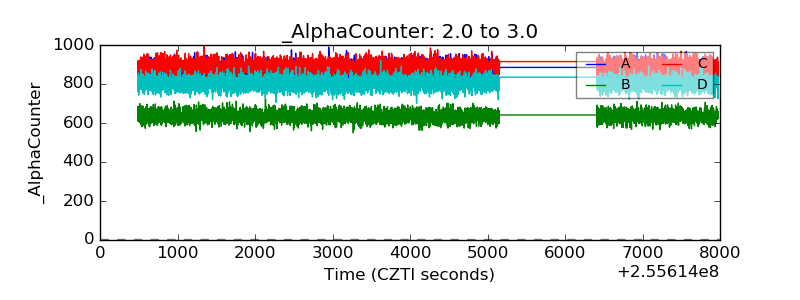 |
| _CPM_Rate | 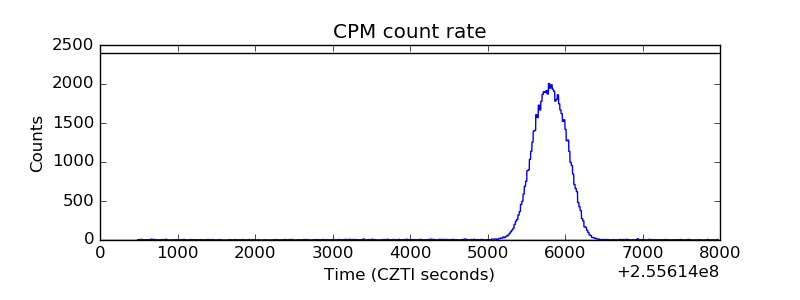 |
| CZT Counter | 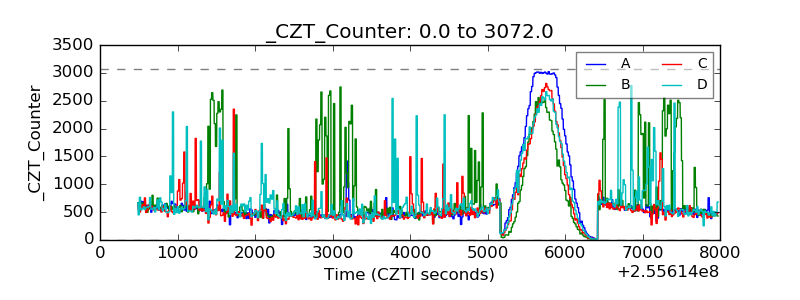 |
| +2.5 Volts monitor |  |
| +5 Volts monitor |  |
| _ROLL_ROT | 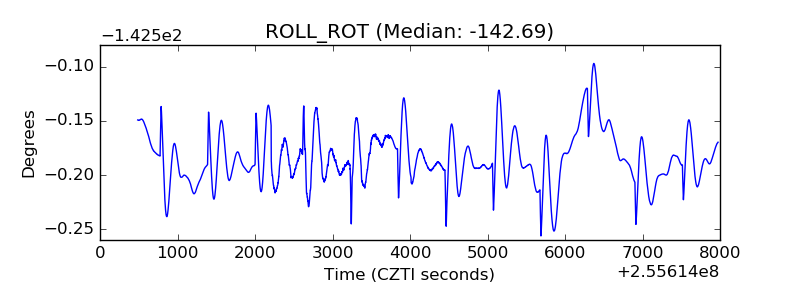 |
| _Roll_DEC | 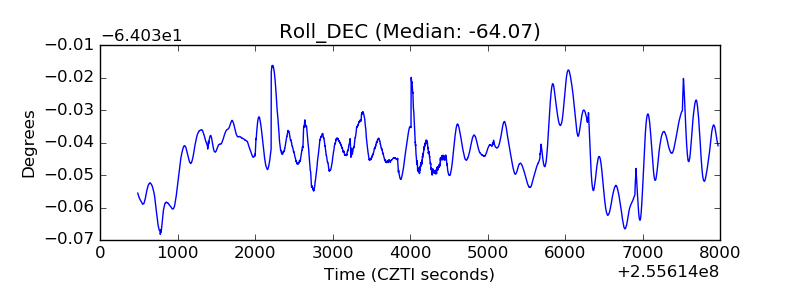 |
| _Roll_RA | 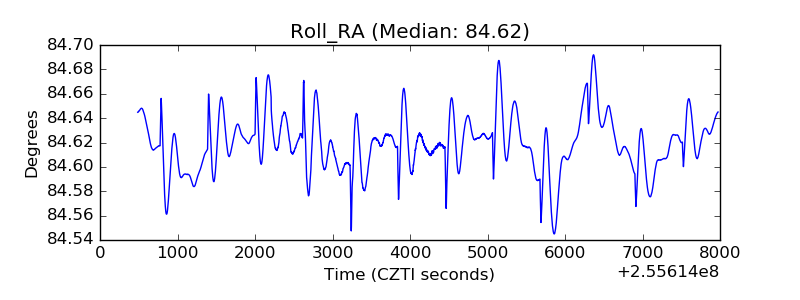 |
| Veto Counter | 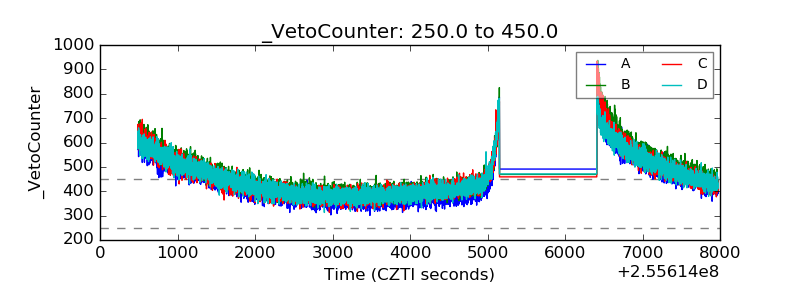 |