| Param | Original file | Final file |
|---|---|---|
| Filename | modeM0/AS1A04_112T01_9000001884_12766cztM0_level2.evt | modeM0/AS1A04_112T01_9000001884_12766cztM0_level2_quad_clean.evt |
| Size (bytes) | 510,917,760 | 117,593,280 |
| Size | 487.2 MB | 112.1 MB |
| Events in quadrant A | 3,230,447 | 821,413 |
| Events in quadrant B | 4,629,392 | 772,848 |
| Events in quadrant C | 3,084,010 | 794,236 |
| Events in quadrant D | 4,109,039 | 740,665 |
| Mode M0 | |||
|---|---|---|---|
| Quadrant | BADHDUFLAG | Total packets | Discarded packets |
| A | 0 | 13819 | 2 |
| B | 0 | 17796 | 1 |
| C | 0 | 13369 | 1 |
| D | 0 | 16397 | 1 |
| Mode SS | |||
|---|---|---|---|
| Quadrant | BADHDUFLAG | Total packets | Discarded packets |
| A | 0 | 126 | 0 |
| B | 0 | 126 | 0 |
| C | 0 | 126 | 0 |
| D | 0 | 126 | 0 |
| Mode M9 | |||
|---|---|---|---|
| Quadrant | BADHDUFLAG | Total packets | Discarded packets |
| A | 0 | 13 | 0 |
| B | 0 | 13 | 0 |
| C | 0 | 13 | 0 |
| D | 0 | 13 | 0 |
| Quadrant | Total seconds | Saturated seconds | Saturation percentage |
|---|---|---|---|
| A | 6189 | 74 | 1.195670% |
| B | 6189 | 679 | 10.971078% |
| C | 6189 | 70 | 1.131039% |
| D | 6189 | 400 | 6.463080% |
Noise dominated data is calculated using 1-second bins in cleaned event files. If a bin has >2000 counts, and if more than 50% of those come from <1% of pixels, then it is considered to be noise-dominated and hence unusable.
| Quadrant | # 1 sec bins | Bins with >0 counts | Bins with >2000 counts | High rate bins dominated by noise | Noise dominated (total time) | Noise dominated (detector-on time) | Marked lightcurve |
|---|---|---|---|---|---|---|---|
| A | 7490 | 6191 | 0 | 0 | 0.00% | 0.00% | 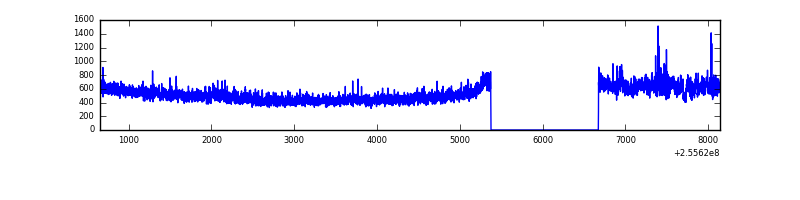 |
| B | 7490 | 6191 | 410 | 410 | 5.47% | 6.62% | 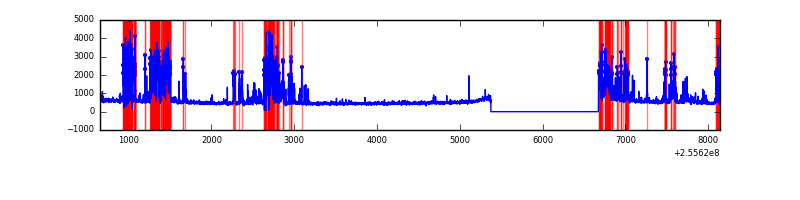 |
| C | 7490 | 6191 | 24 | 24 | 0.32% | 0.39% | 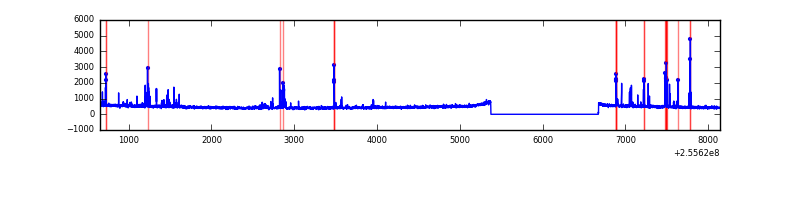 |
| D | 7490 | 6191 | 206 | 206 | 2.75% | 3.33% | 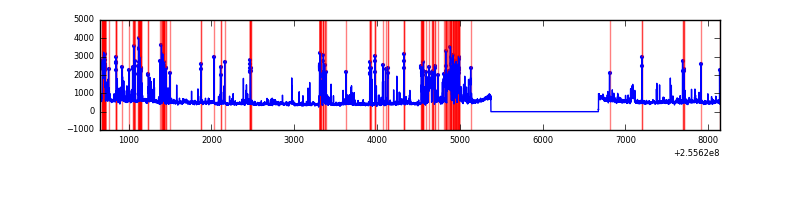 |
Top three noisy pixels from each quadrant. If the there are fewer than three noisy pixels in the level2.evt file, extra rows are filled as -1
| Pixel properties | Quadrant properties | ||||||
|---|---|---|---|---|---|---|---|
| Quadrant | DetID | PixID | Counts | Sigma | Mean | Median | Sigma |
| A | 0 | 23 | 130896 | 838.53 | 772 | 757 | 155.2 |
| A | 12 | 189 | 73290 | 467.35 | 772 | 757 | 155.2 |
| A | 8 | 6 | 29971 | 188.24 | 772 | 757 | 155.2 |
| B | 4 | 239 | 1469602 | 10788.82 | 728 | 713 | 136.1 |
| B | 0 | 85 | 194763 | 1425.27 | 728 | 713 | 136.1 |
| B | 3 | 64 | 37892 | 273.08 | 728 | 713 | 136.1 |
| C | 15 | 208 | 243343 | 1460.81 | 728 | 730 | 166.1 |
| C | 13 | 61 | 5443 | 28.38 | 728 | 730 | 166.1 |
| C | 8 | 222 | 2323 | 9.59 | 728 | 730 | 166.1 |
| D | 1 | 52 | 1160746 | 6842.93 | 713 | 694 | 169.5 |
| D | 8 | 195 | 85375 | 499.52 | 713 | 694 | 169.5 |
| D | 2 | 136 | 84343 | 493.43 | 713 | 694 | 169.5 |
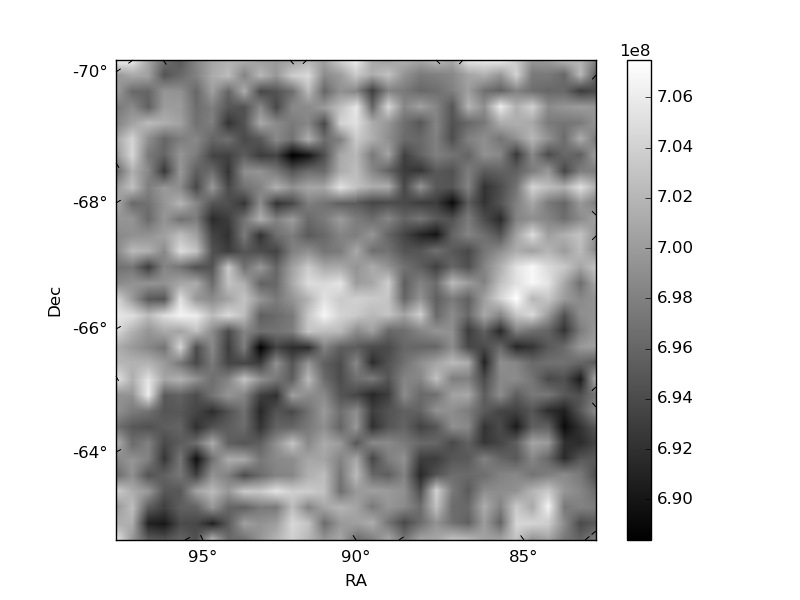
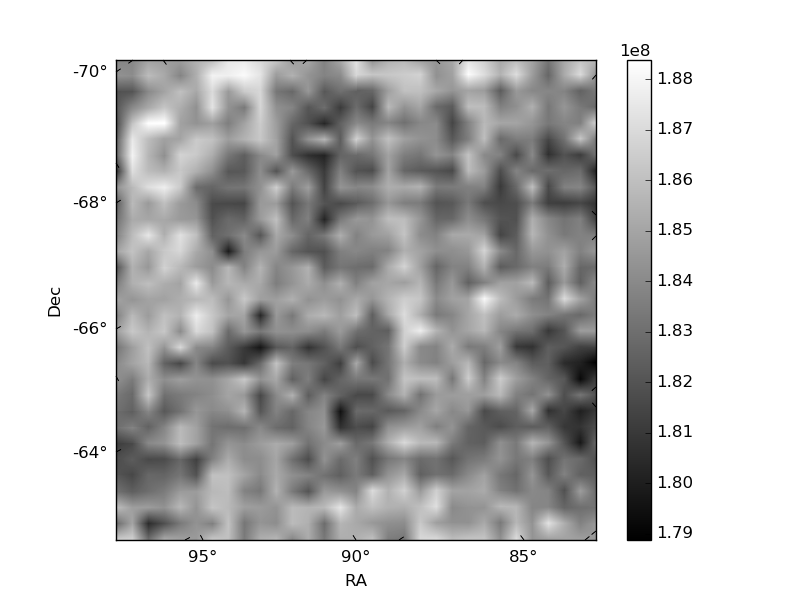
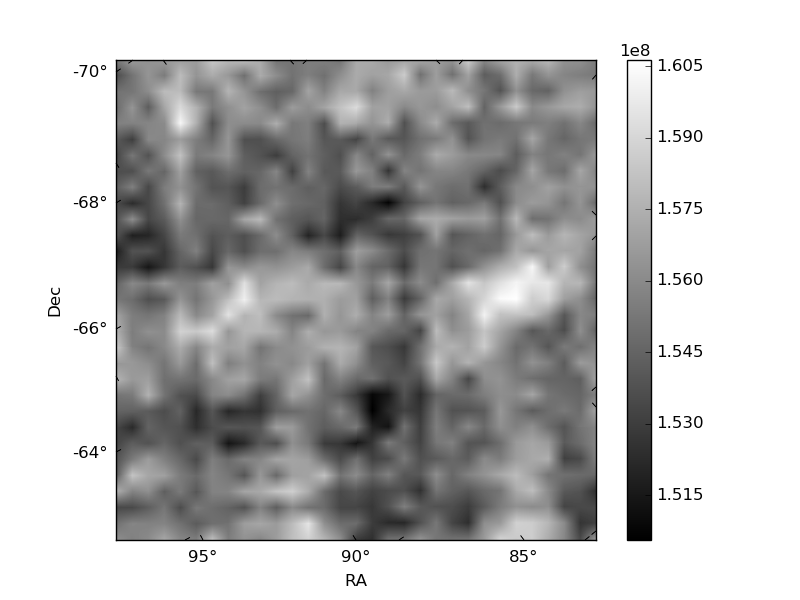
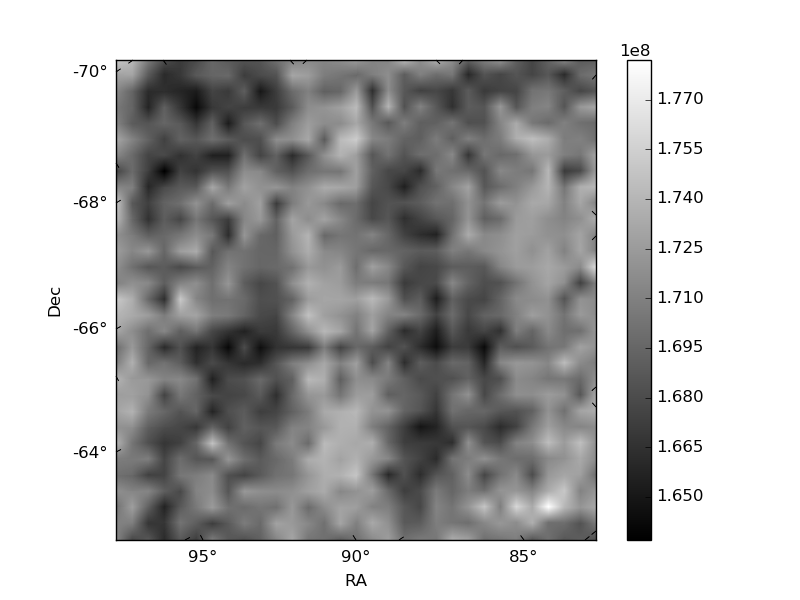
Histogram calculated using DETX and DETY for each event in the final _common_clean file
| Quadrant A | 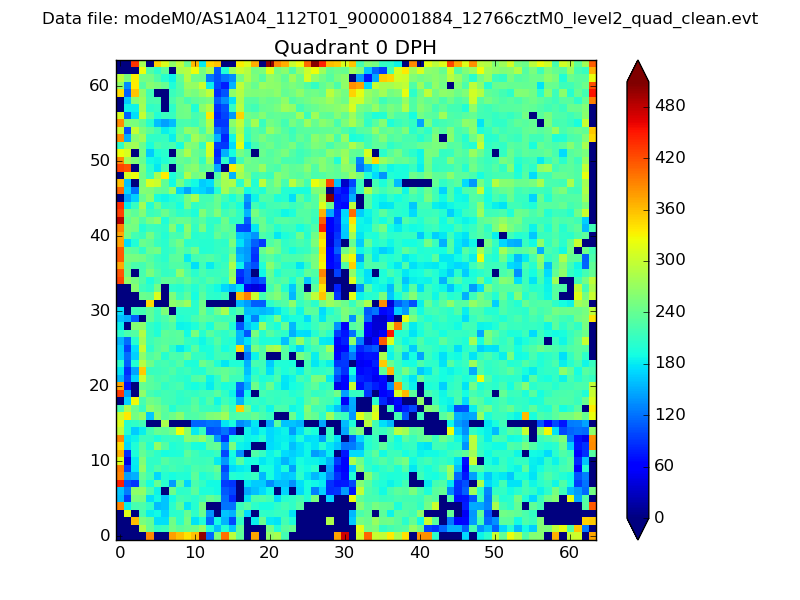 |
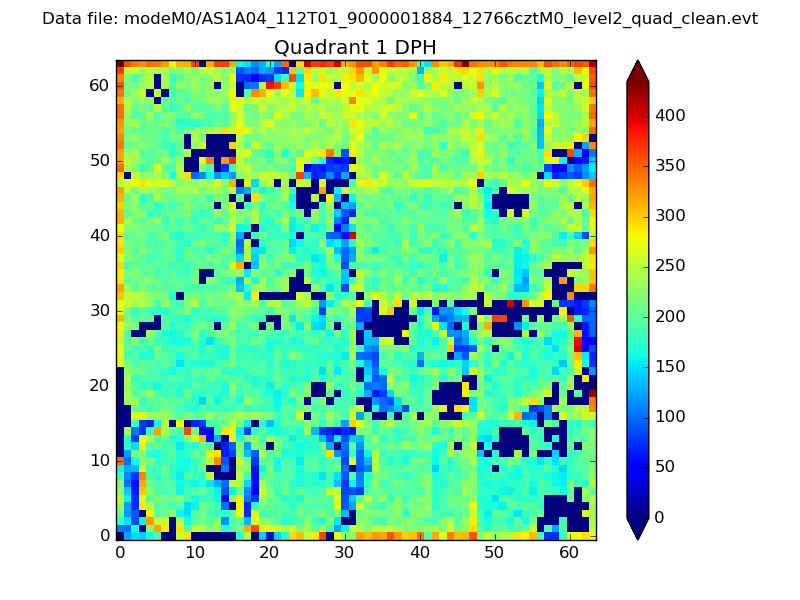 |
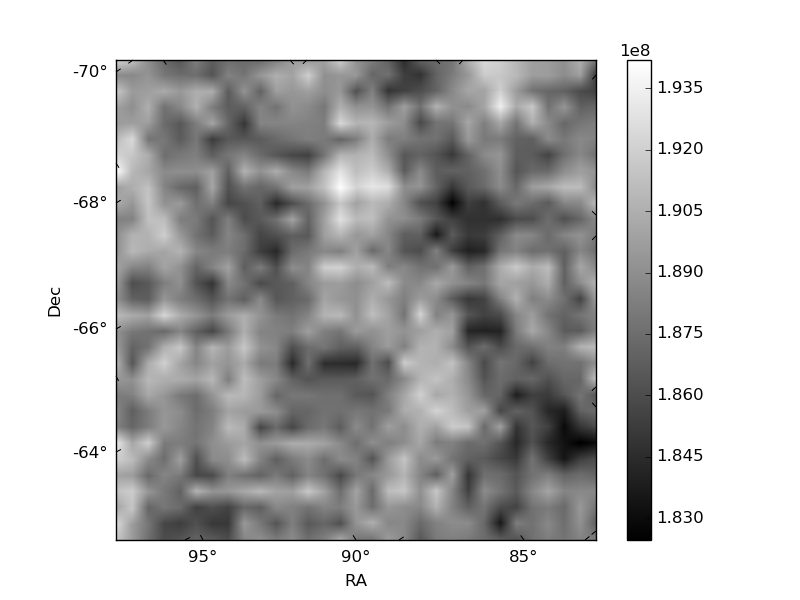
Quadrant B |
|---|---|---|---|
| Quadrant D | 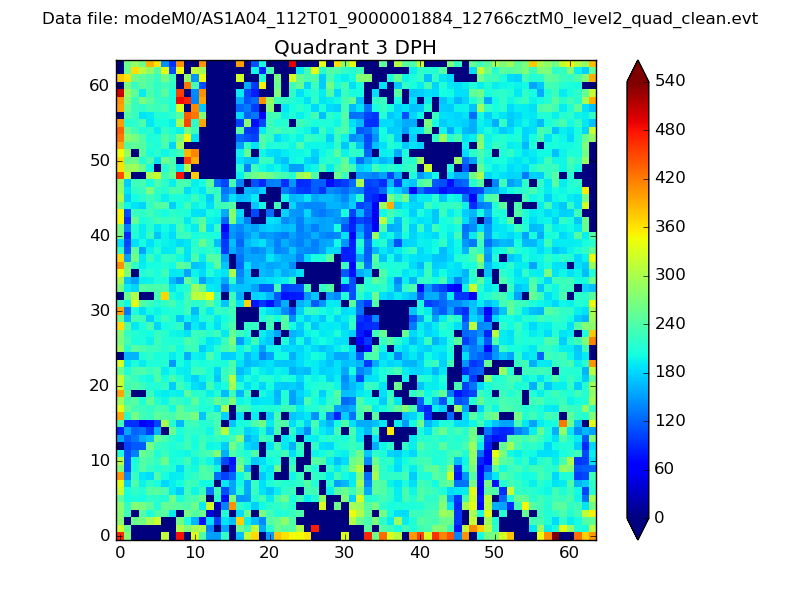 |
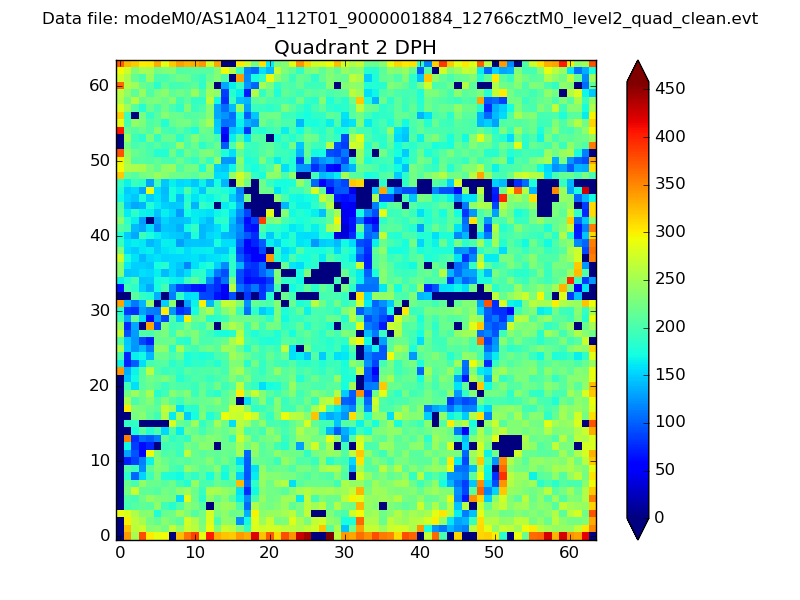 |
Quadrant C |
| Plot type | Count rate plots | Images |
|---|---|---|
| Comparison with Poisson distribution Blue bars denote a histogram of data divided into 1 sec bins. Red curve is a Poisson curve with rate = median count rate of data. |
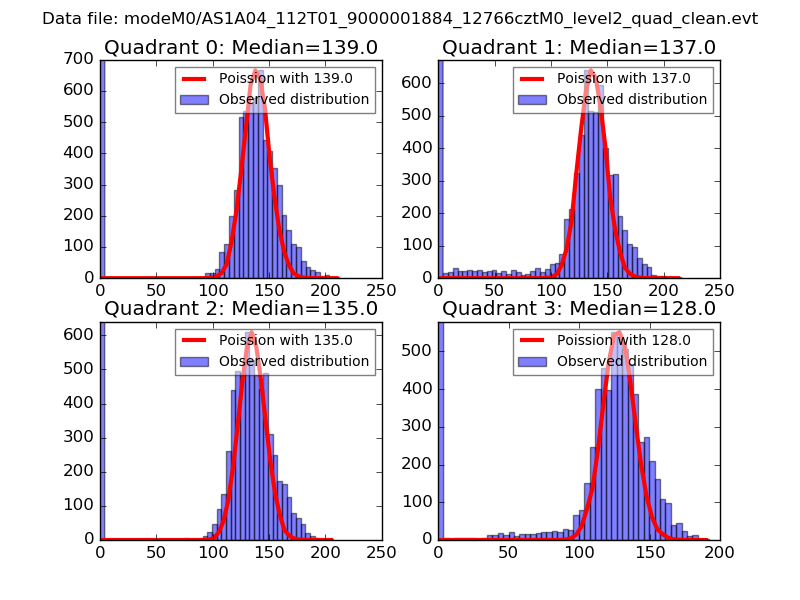 |
 |
| Quadrant-wise count rates Data is divided into 100 sec bins |
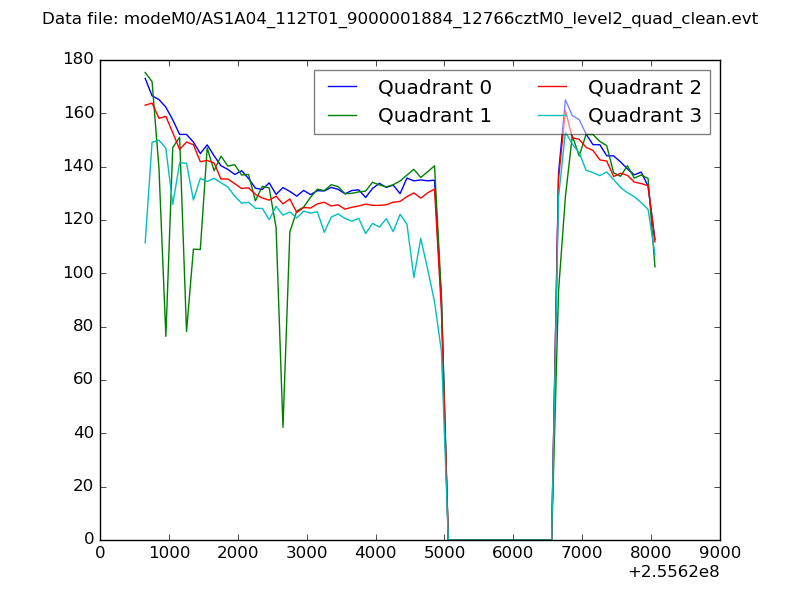 |
|
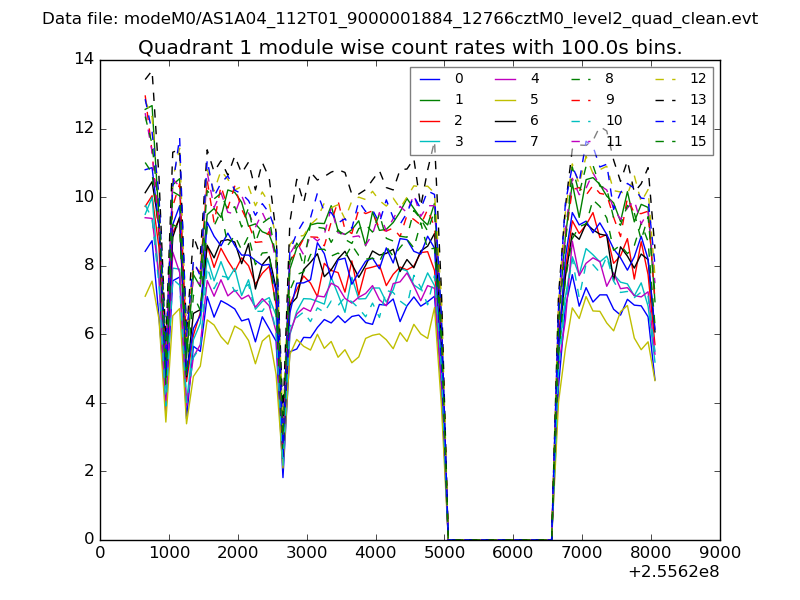
| Module-wise count rates for Quadrant A Data is divided into 100 sec bins |
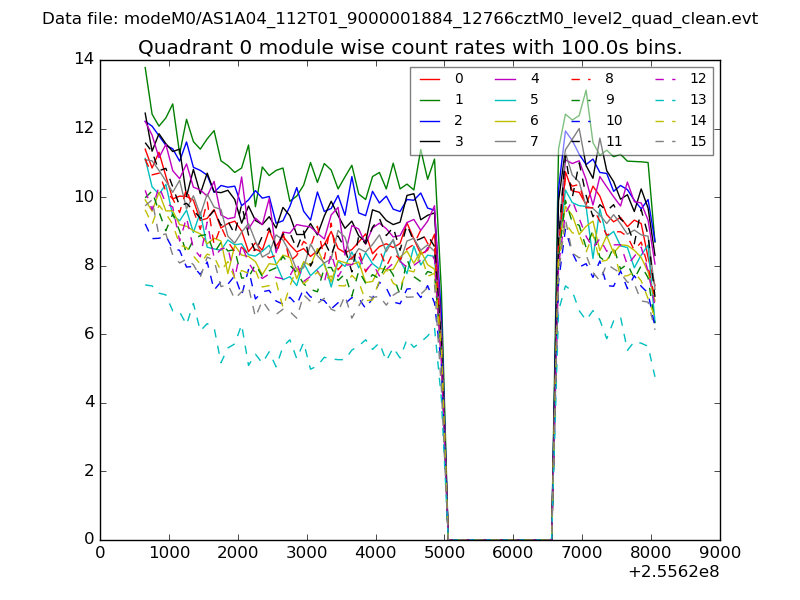 |
 |
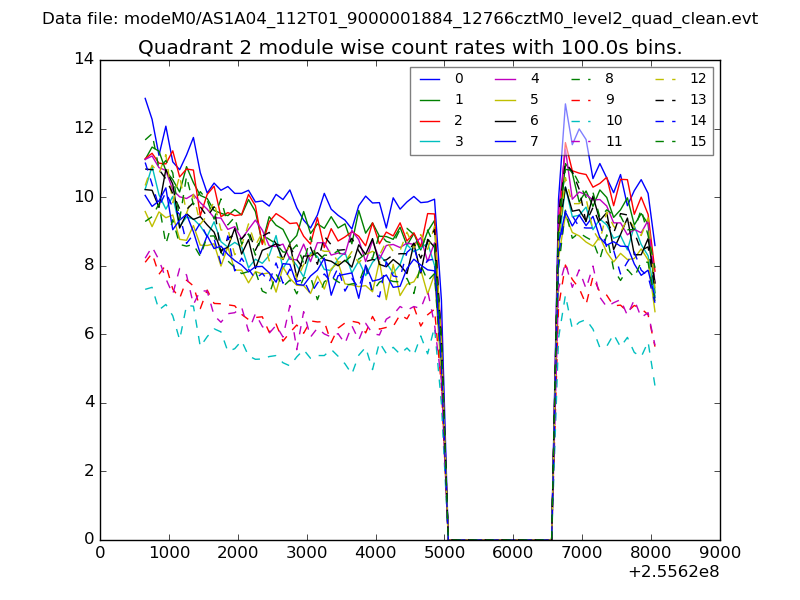
| Module-wise count rates for Quadrant B Data is divided into 100 sec bins |
 |
 |
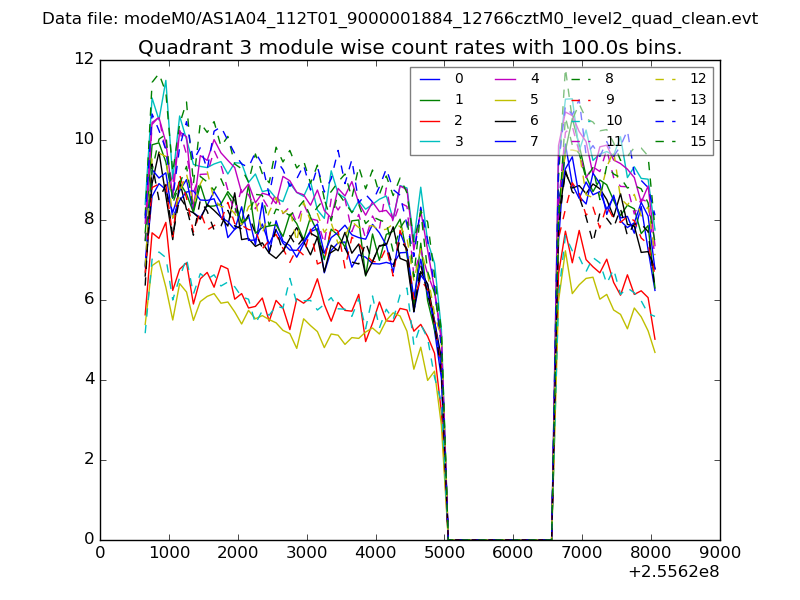
| Module-wise count rates for Quadrant C Data is divided into 100 sec bins |
 |
 |
| Module-wise count rates for Quadrant D Data is divided into 100 sec bins |
 |
 |
| Parameter | Plot |
|---|---|
| CZT HV Monitor | 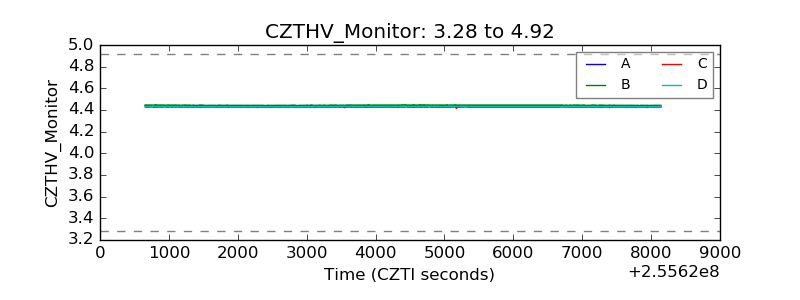 |
| D_VDD | 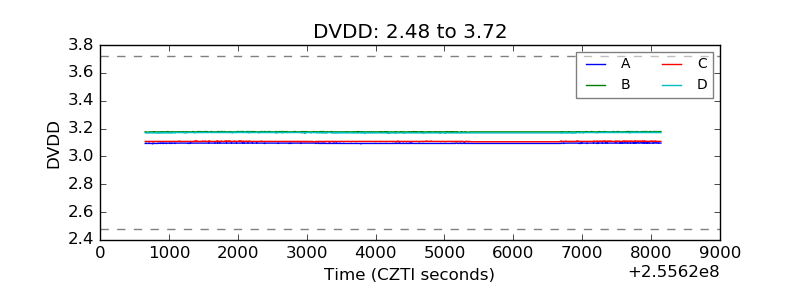 |
| Temperature 1 | 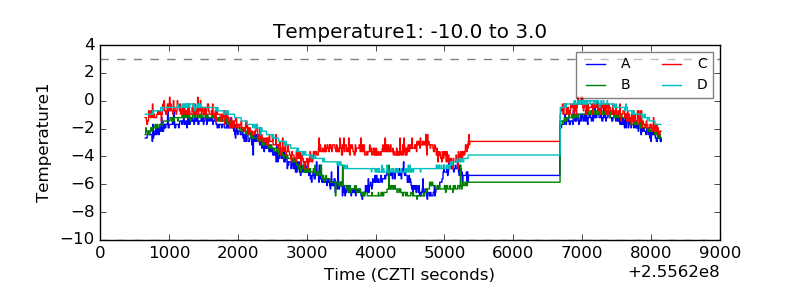 |
| Veto HV Monitor | 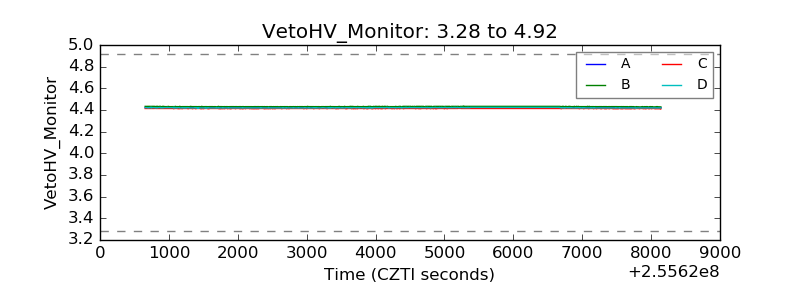 |
| Veto LLD | 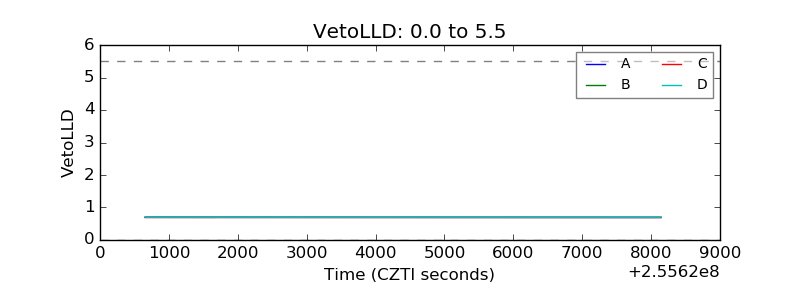 |
| Alpha Counter | 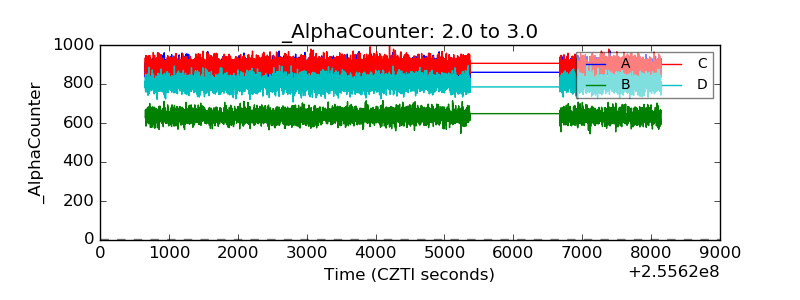 |
| _CPM_Rate | 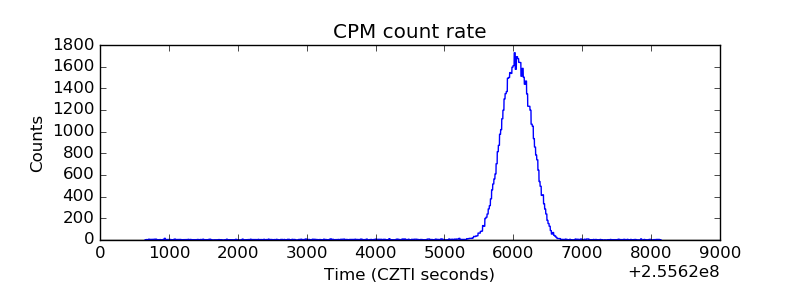 |
| CZT Counter | 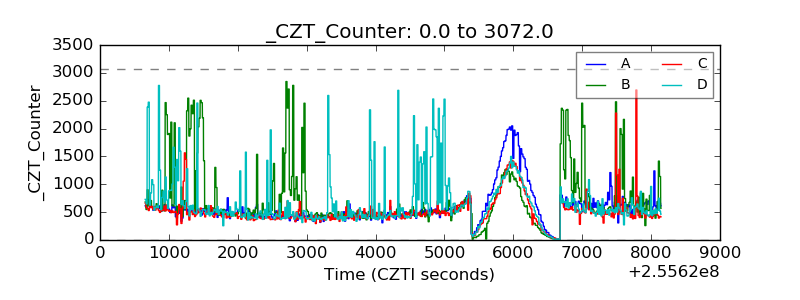 |
| +2.5 Volts monitor |  |
| +5 Volts monitor | 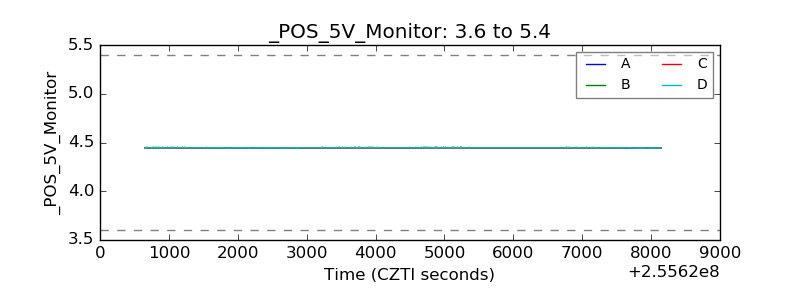 |
| _ROLL_ROT | 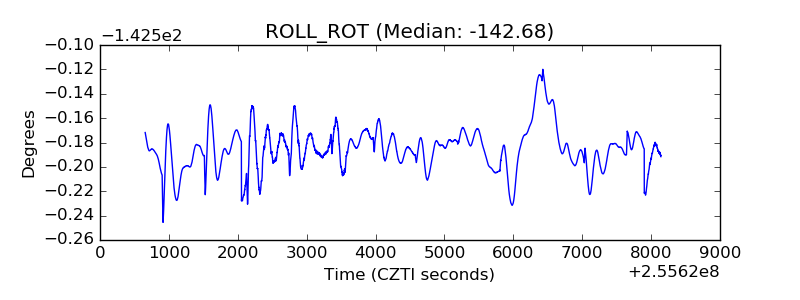 |
| _Roll_DEC | 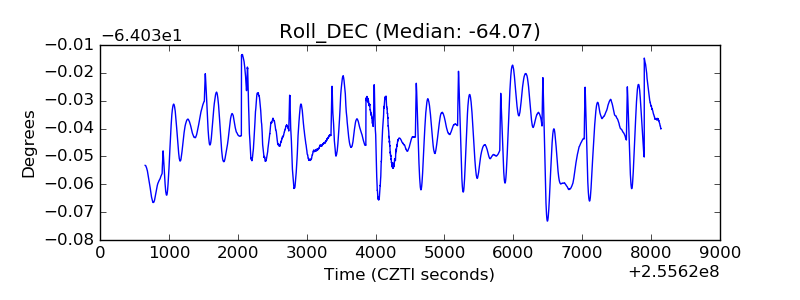 |
| _Roll_RA | 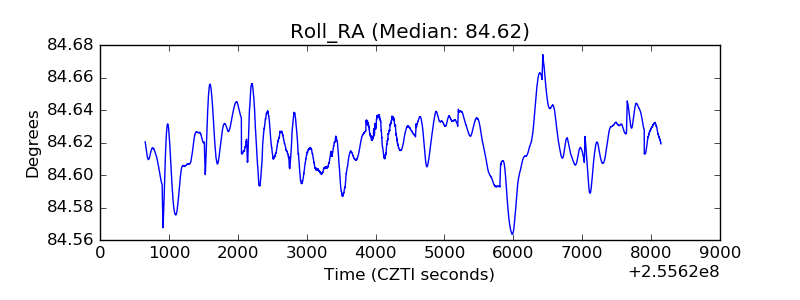 |
| Veto Counter | 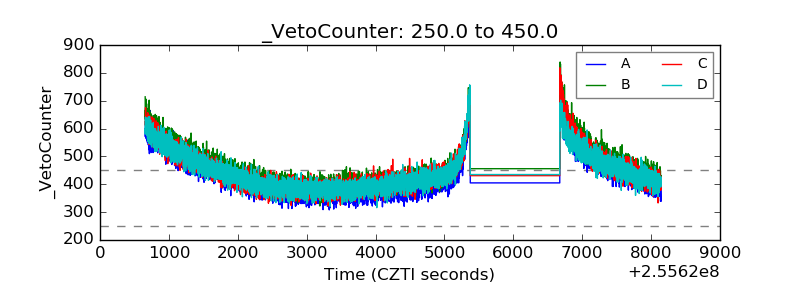 |