| Param | Original file | Final file |
|---|---|---|
| Filename | modeM0/AS1A04_112T01_9000001884_12768cztM0_level2.evt | modeM0/AS1A04_112T01_9000001884_12768cztM0_level2_quad_clean.evt |
| Size (bytes) | 232,940,160 | 41,567,040 |
| Size | 222.1 MB | 39.6 MB |
| Events in quadrant A | 1,045,721 | 302,878 |
| Events in quadrant B | 1,630,491 | 292,198 |
| Events in quadrant C | 967,830 | 296,277 |
| Events in quadrant D | 3,247,448 | 195,962 |
| Mode M0 | |||
|---|---|---|---|
| Quadrant | BADHDUFLAG | Total packets | Discarded packets |
| A | 0 | 4772 | 0 |
| B | 0 | 6371 | 0 |
| C | 0 | 4738 | 0 |
| D | 0 | 11333 | 0 |
| Mode SS | |||
|---|---|---|---|
| Quadrant | BADHDUFLAG | Total packets | Discarded packets |
| A | 0 | 48 | 0 |
| B | 0 | 48 | 0 |
| C | 0 | 48 | 0 |
| D | 0 | 48 | 0 |
| Quadrant | Total seconds | Saturated seconds | Saturation percentage |
|---|---|---|---|
| A | 2366 | 0 | 0.000000% |
| B | 2366 | 181 | 7.650042% |
| C | 2366 | 0 | 0.000000% |
| D | 2366 | 897 | 37.912088% |
Noise dominated data is calculated using 1-second bins in cleaned event files. If a bin has >2000 counts, and if more than 50% of those come from <1% of pixels, then it is considered to be noise-dominated and hence unusable.
| Quadrant | # 1 sec bins | Bins with >0 counts | Bins with >2000 counts | High rate bins dominated by noise | Noise dominated (total time) | Noise dominated (detector-on time) | Marked lightcurve |
|---|---|---|---|---|---|---|---|
| A | 2367 | 2367 | 0 | 0 | 0.00% | 0.00% | 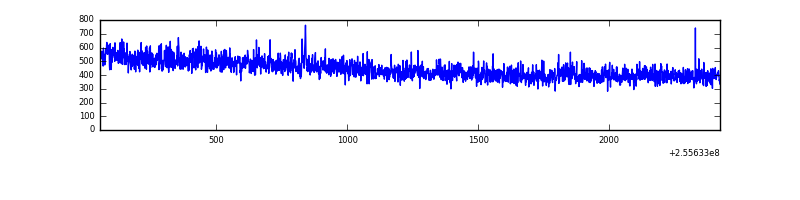 |
| B | 2367 | 2367 | 110 | 110 | 4.65% | 4.65% | 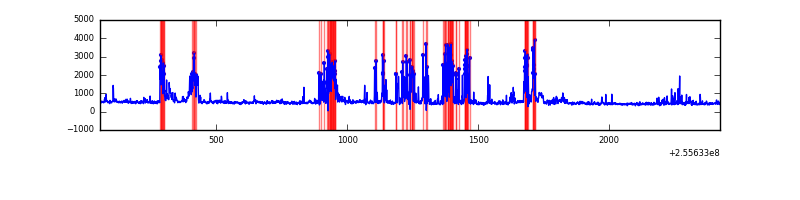 |
| C | 2367 | 2367 | 0 | 0 | 0.00% | 0.00% | 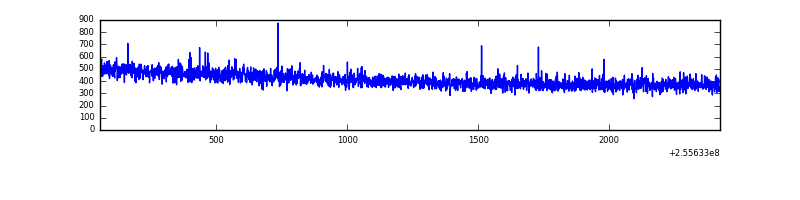 |
| D | 2367 | 2367 | 701 | 701 | 29.62% | 29.62% | 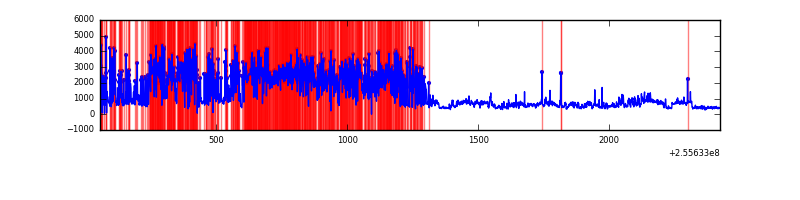 |
Top three noisy pixels from each quadrant. If the there are fewer than three noisy pixels in the level2.evt file, extra rows are filled as -1
| Pixel properties | Quadrant properties | ||||||
|---|---|---|---|---|---|---|---|
| Quadrant | DetID | PixID | Counts | Sigma | Mean | Median | Sigma |
| A | 12 | 189 | 13594 | 240.09 | 265 | 259 | 55.5 |
| A | 15 | 239 | 5916 | 101.85 | 265 | 259 | 55.5 |
| A | 8 | 15 | 4107 | 69.28 | 265 | 259 | 55.5 |
| B | 4 | 239 | 535136 | 10743.13 | 256 | 250 | 49.8 |
| B | 0 | 219 | 41023 | 818.92 | 256 | 250 | 49.8 |
| B | 0 | 85 | 40010 | 798.58 | 256 | 250 | 49.8 |
| C | 13 | 61 | 1835 | 27.09 | 247 | 248 | 58.6 |
| C | 15 | 208 | 1695 | 24.7 | 247 | 248 | 58.6 |
| C | 8 | 222 | 874 | 10.69 | 247 | 248 | 58.6 |
| D | 1 | 52 | 2191410 | 49070.91 | 177 | 171 | 44.7 |
| D | 10 | 157 | 212508 | 4755.1 | 177 | 171 | 44.7 |
| D | 8 | 195 | 102070 | 2281.94 | 177 | 171 | 44.7 |
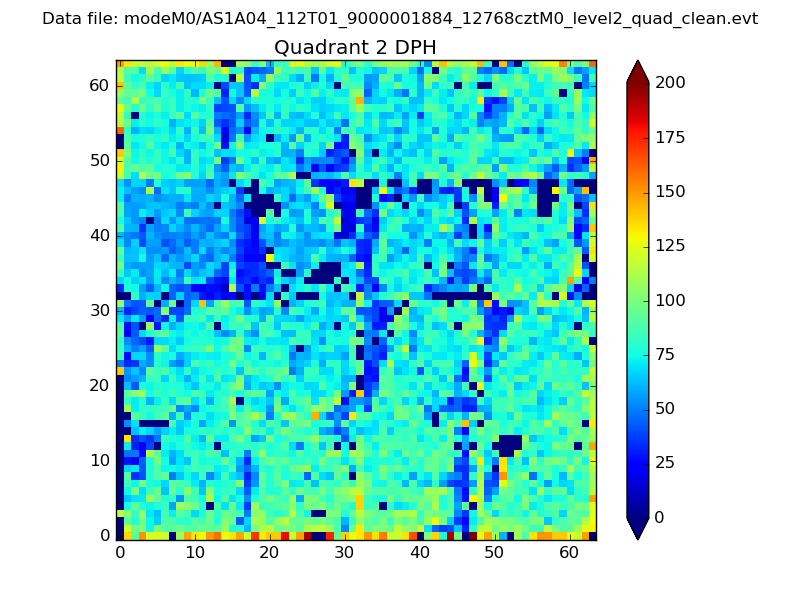
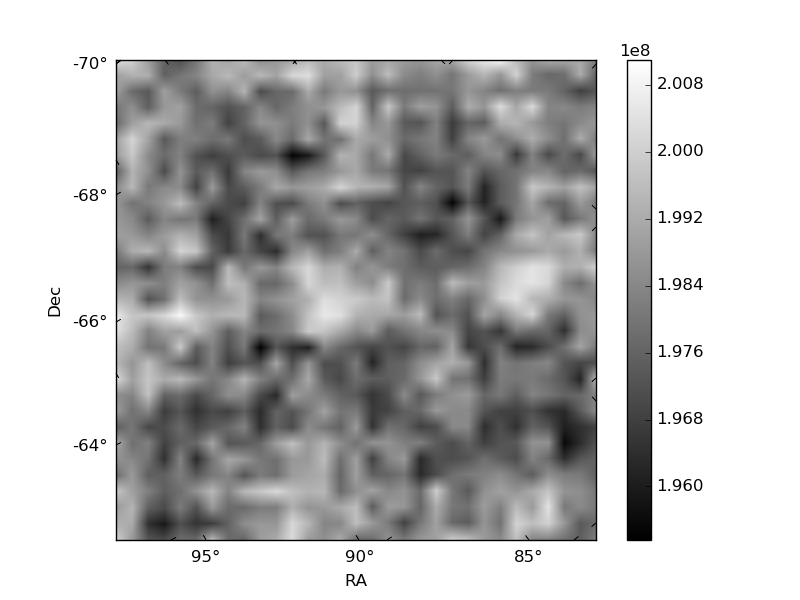
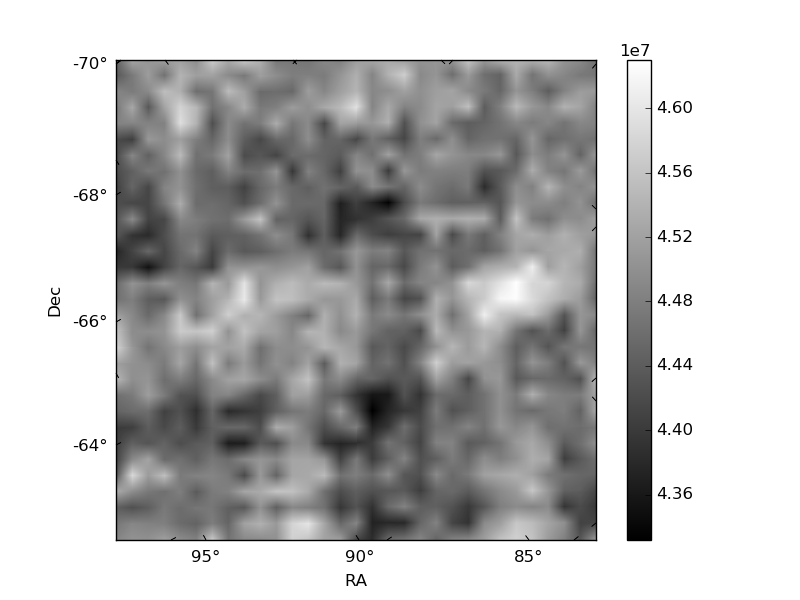
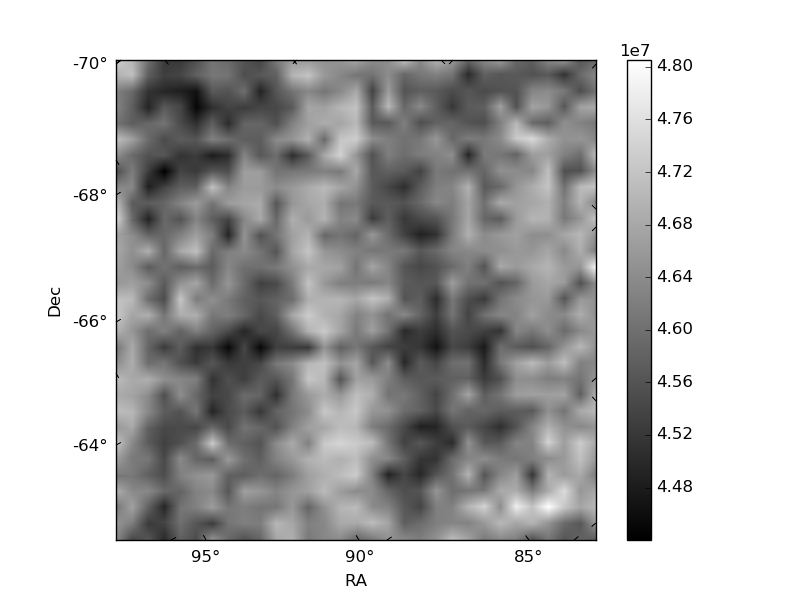
Histogram calculated using DETX and DETY for each event in the final _common_clean file
| Quadrant A | 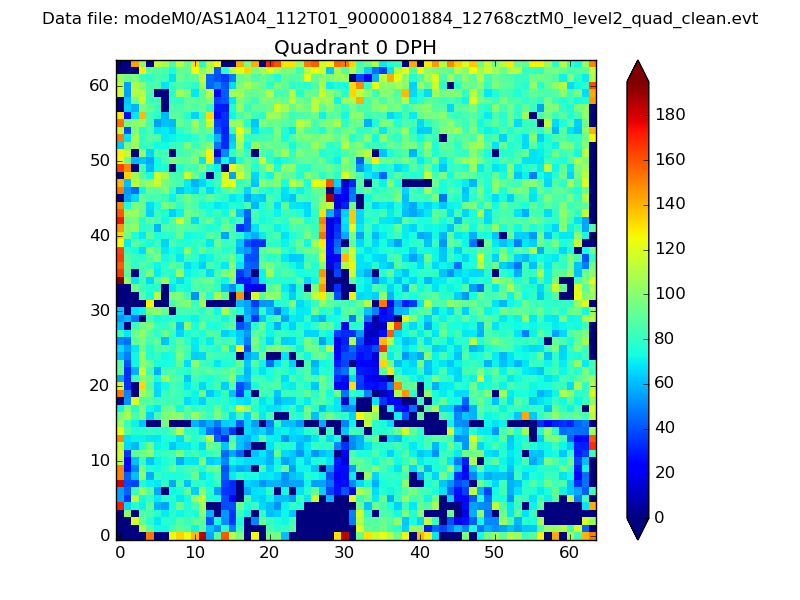 |
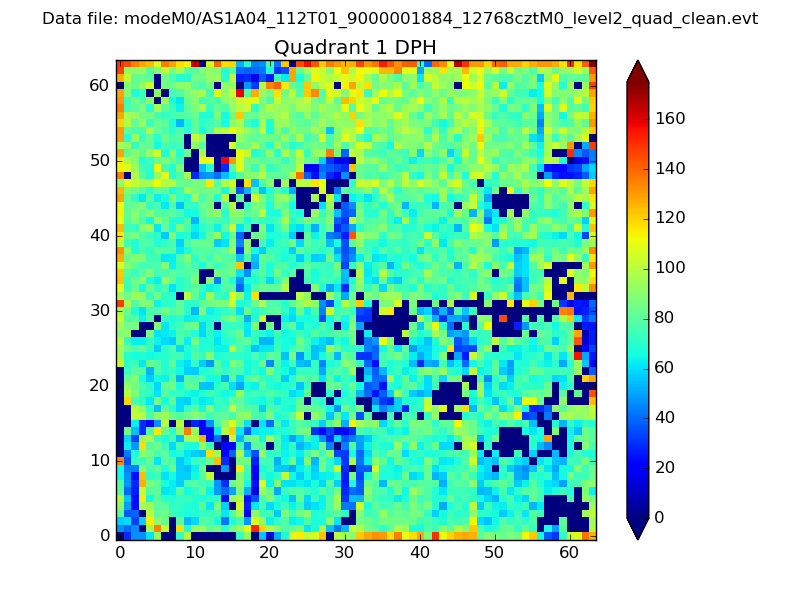 |
Quadrant B |
|---|---|---|---|
| Quadrant D | 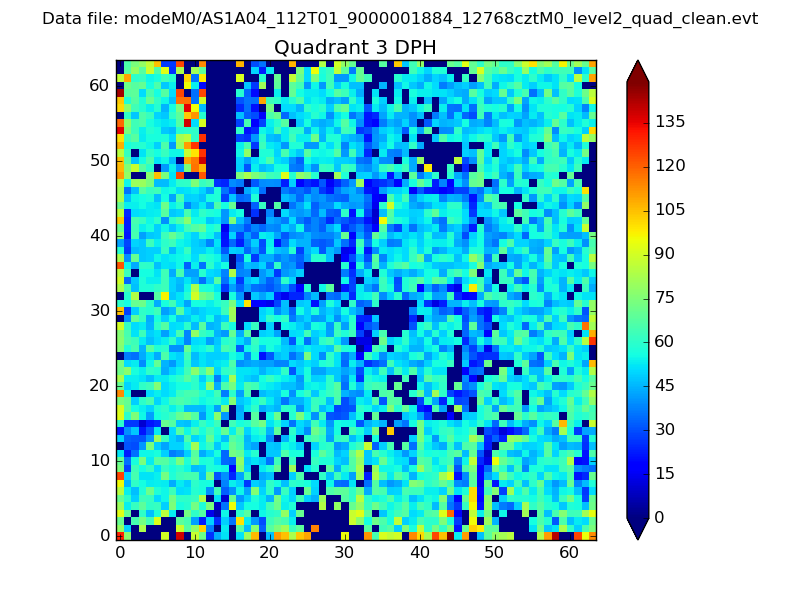 |
 |
Quadrant C |
| Plot type | Count rate plots | Images |
|---|---|---|
| Comparison with Poisson distribution Blue bars denote a histogram of data divided into 1 sec bins. Red curve is a Poisson curve with rate = median count rate of data. |
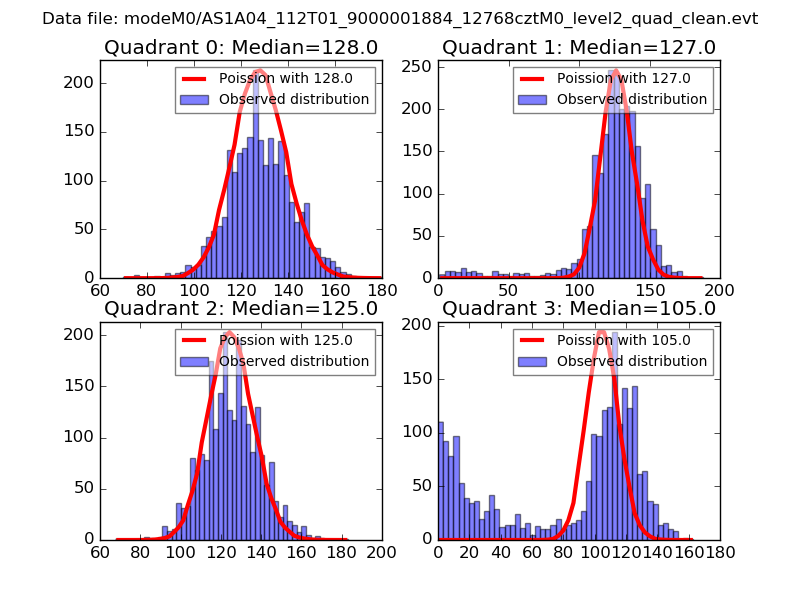 |
 |
| Quadrant-wise count rates Data is divided into 100 sec bins |
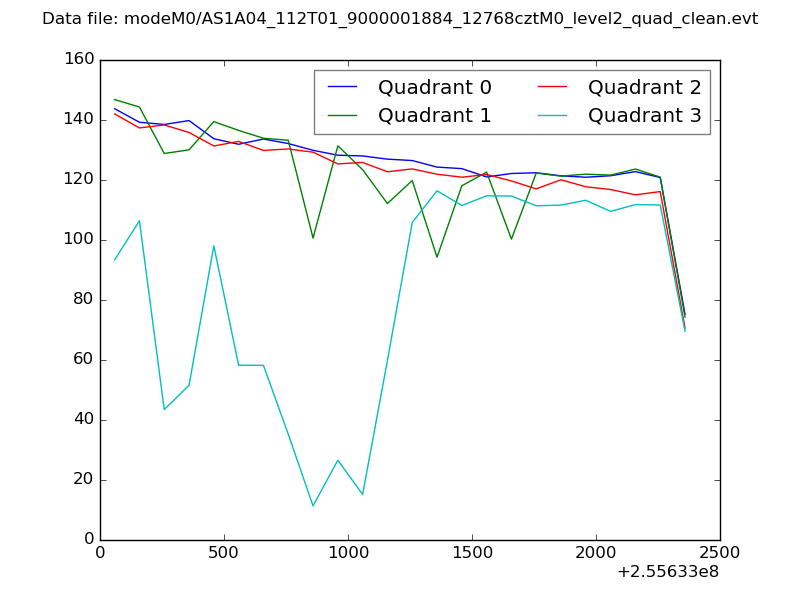 |
|
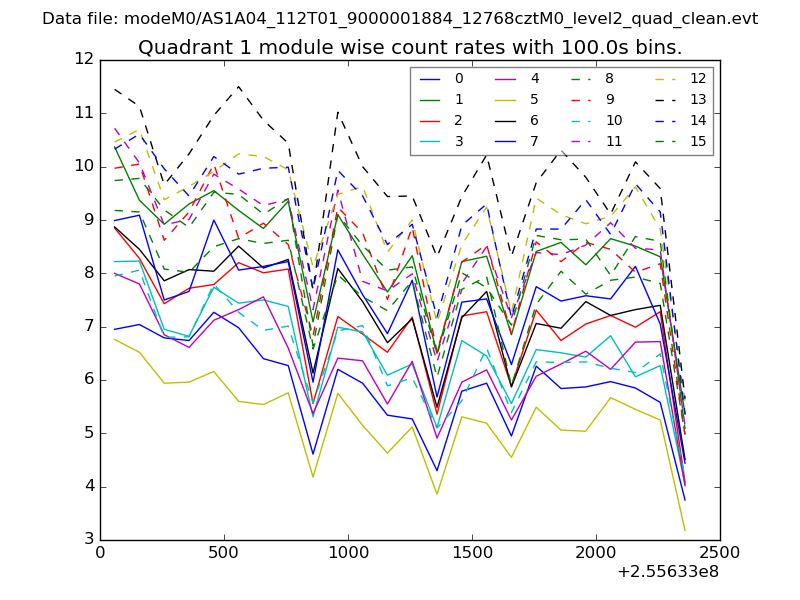
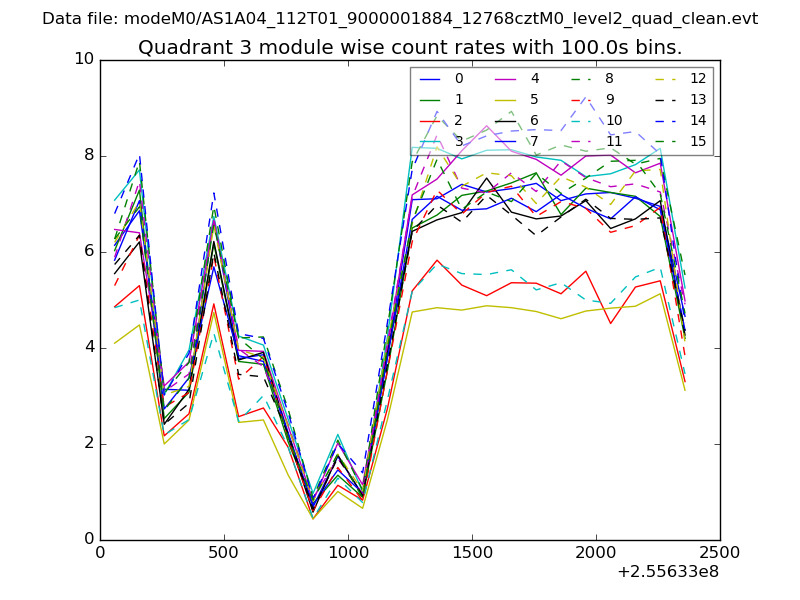
| Module-wise count rates for Quadrant A Data is divided into 100 sec bins |
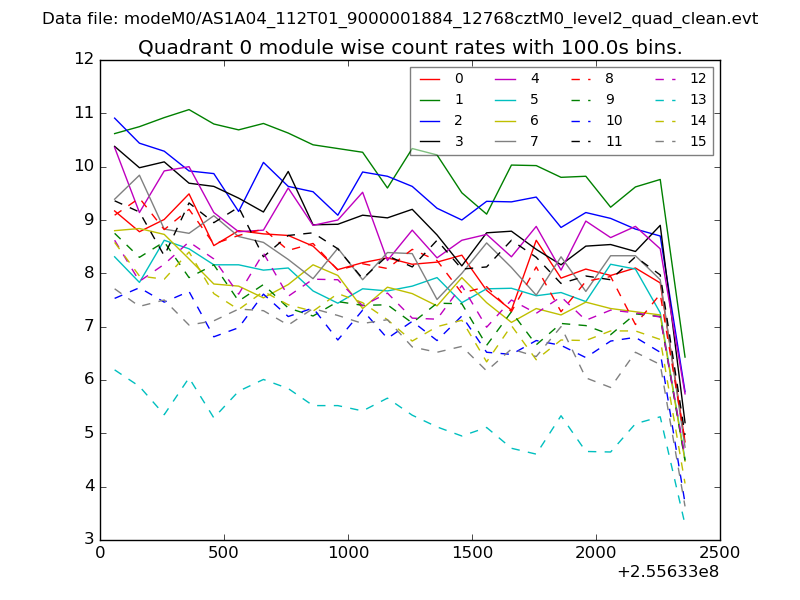 |
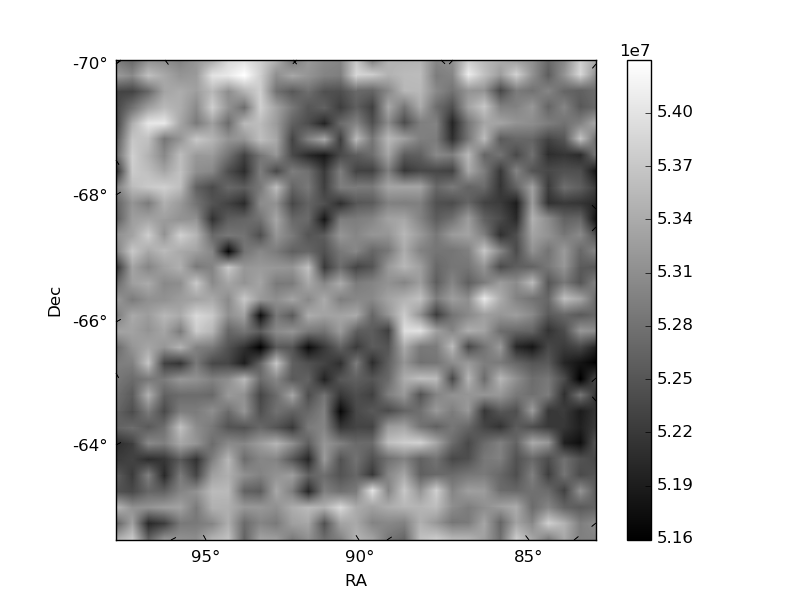 |
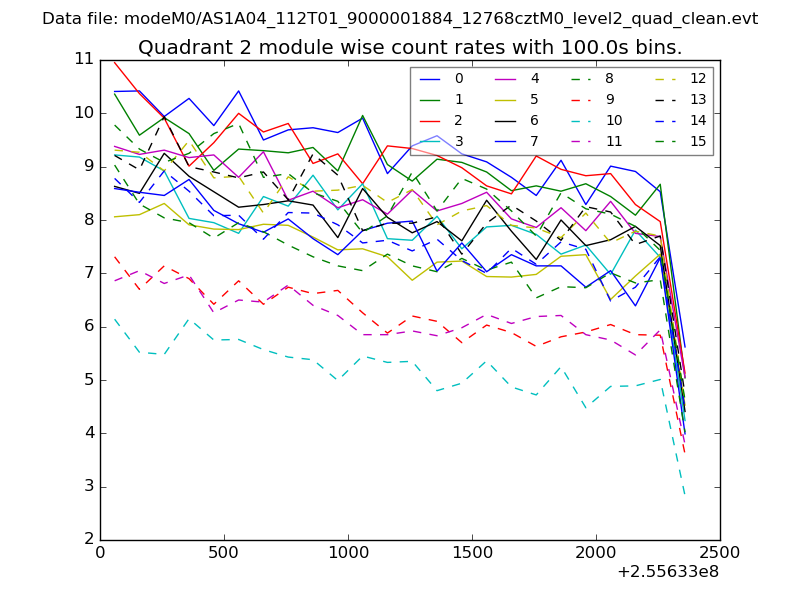
| Module-wise count rates for Quadrant B Data is divided into 100 sec bins |
 |
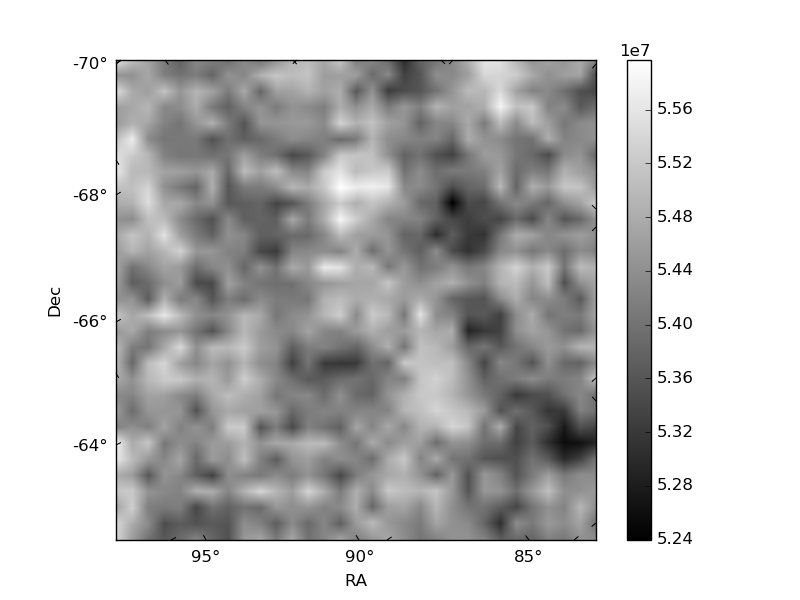 |
| Module-wise count rates for Quadrant C Data is divided into 100 sec bins |
 |
 |
| Module-wise count rates for Quadrant D Data is divided into 100 sec bins |
 |
 |
| Parameter | Plot |
|---|---|
| CZT HV Monitor | 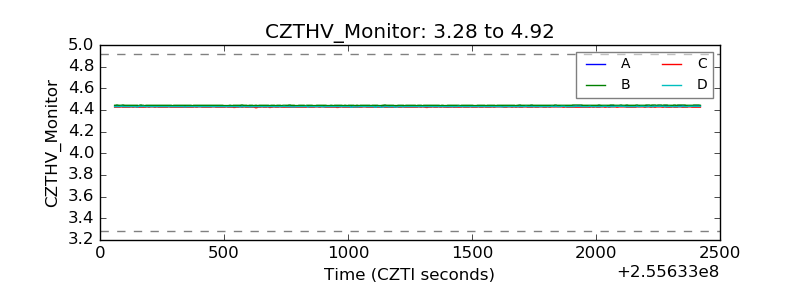 |
| D_VDD | 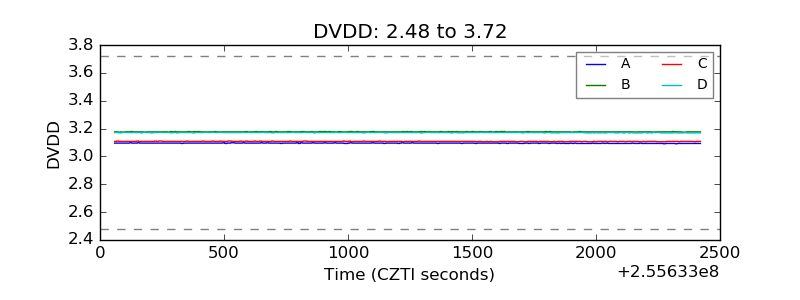 |
| Temperature 1 | 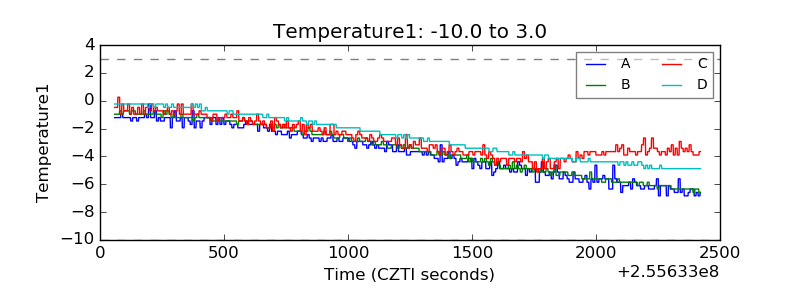 |
| Veto HV Monitor | 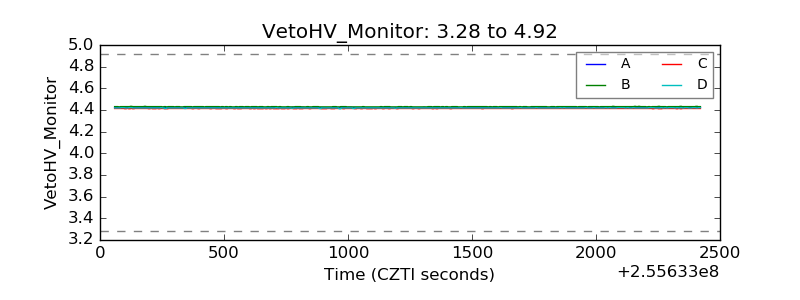 |
| Veto LLD | 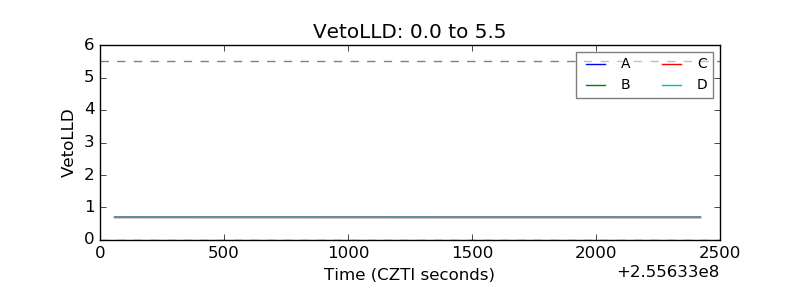 |
| Alpha Counter | 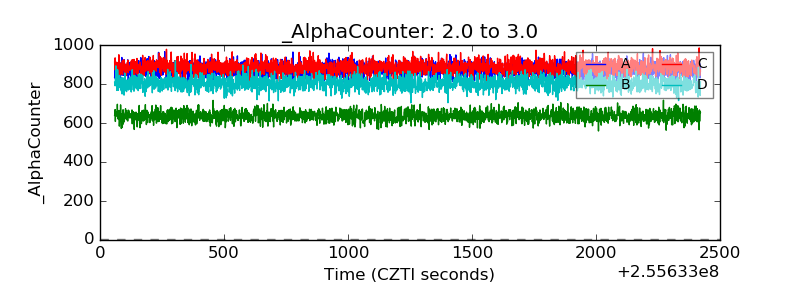 |
| _CPM_Rate | 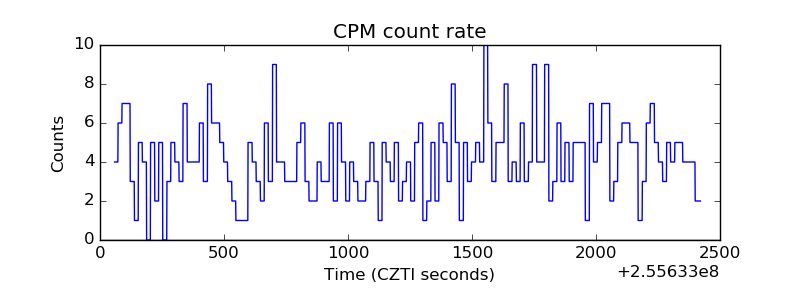 |
| CZT Counter | 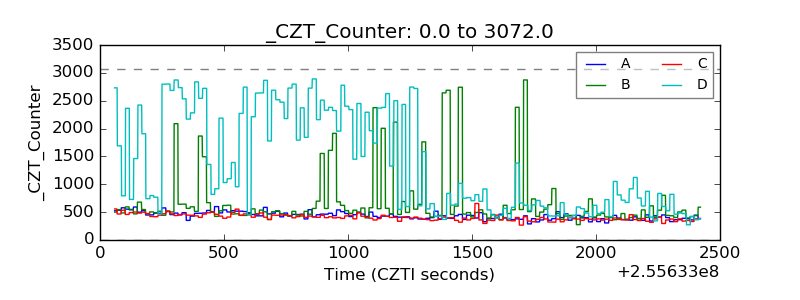 |
| +2.5 Volts monitor |  |
| +5 Volts monitor |  |
| _ROLL_ROT |  |
| _Roll_DEC | 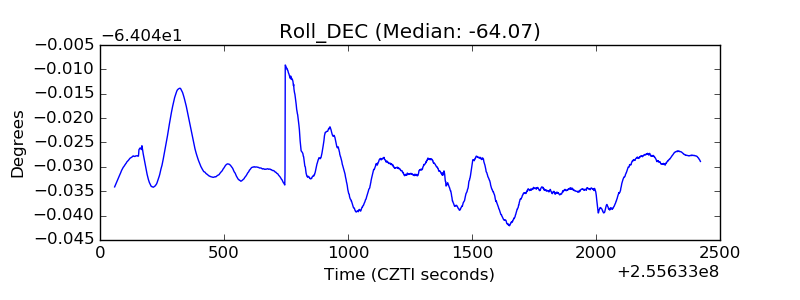 |
| _Roll_RA | 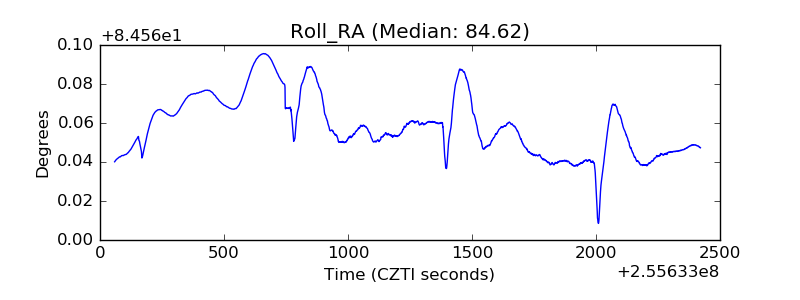 |
| Veto Counter | 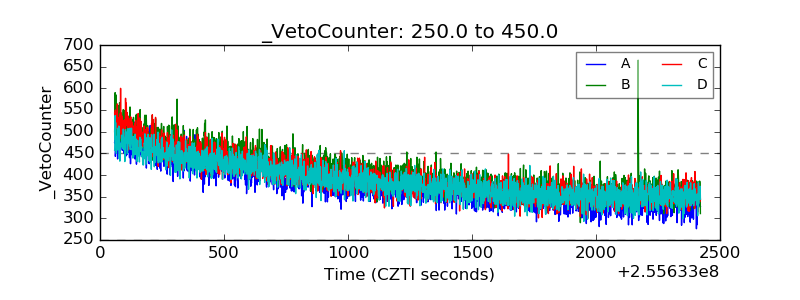 |