| Param | Original file | Final file |
|---|---|---|
| Filename | modeM0/AS1G08_071T01_9000001888cztM0_level2.fits | modeM0/AS1G08_071T01_9000001888cztM0_level2_quad_clean.evt |
| Size (bytes) | 2,947,322,880 | 2,929,132,800 |
| Size | 2.7 GB | 2.7 GB |
| Events in quadrant A | 18,132,424 | 17,847,999 |
| Events in quadrant B | 16,826,238 | 16,947,337 |
| Events in quadrant C | 17,873,286 | 17,202,056 |
| Events in quadrant D | 15,451,396 | 15,748,763 |
| Mode SS | |||
|---|---|---|---|
| Quadrant | BADHDUFLAG | Total packets | Discarded packets |
| A | 0 | 6240 | 0 |
| B | 0 | 6240 | 0 |
| C | 0 | 6240 | 0 |
| D | 0 | 6240 | 0 |
| Mode M9 | |||
|---|---|---|---|
| Quadrant | BADHDUFLAG | Total packets | Discarded packets |
| A | 0 | 503 | 0 |
| B | 0 | 503 | 0 |
| C | 0 | 503 | 0 |
| D | 0 | 503 | 0 |
| Mode M0 | |||
|---|---|---|---|
| Quadrant | BADHDUFLAG | Total packets | Discarded packets |
| A | 0 | 650293 | 0 |
| B | 0 | 806464 | 0 |
| C | 0 | 629962 | 0 |
| D | 0 | 716537 | 0 |
| Quadrant | Total seconds | Saturated seconds | Saturation percentage |
|---|---|---|---|
| A | 306147 | 3218 | 1.051129% |
| B | 306147 | 21401 | 6.990433% |
| C | 306147 | 2402 | 0.784590% |
| D | 306147 | 8141 | 2.659180% |
Noise dominated data is calculated using 1-second bins in cleaned event files. If a bin has >2000 counts, and if more than 50% of those come from <1% of pixels, then it is considered to be noise-dominated and hence unusable.
| Quadrant | # 1 sec bins | Bins with >0 counts | Bins with >2000 counts | High rate bins dominated by noise | Noise dominated (total time) | Noise dominated (detector-on time) | Marked lightcurve |
|---|---|---|---|---|---|---|---|
| A | 356848 | 306147 | 0 | 0 | 0.00% | 0.00% |  |
| B | 356848 | 305071 | 0 | 0 | 0.00% | 0.00% | 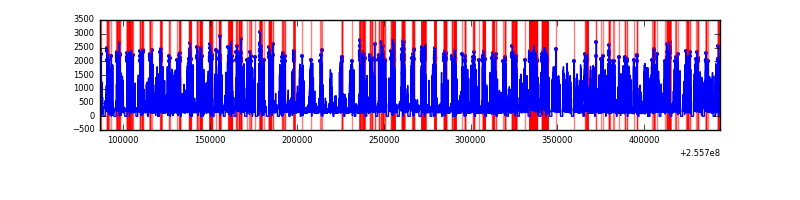 |
| C | 356848 | 306148 | 0 | 0 | 0.00% | 0.00% |  |
| D | 356848 | 306094 | 0 | 0 | 0.00% | 0.00% |  |
Top three noisy pixels from each quadrant. If the there are fewer than three noisy pixels in the level2.evt file, extra rows are filled as -1
| Pixel properties | Quadrant properties | ||||||
|---|---|---|---|---|---|---|---|
| Quadrant | DetID | PixID | Counts | Sigma | Mean | Median | Sigma |
| A | 0 | 29 | 17176 | 11.02 | 4720 | 4425 | 1157.4 |
| A | 7 | 110 | 14621 | 8.81 | 4720 | 4425 | 1157.4 |
| A | 9 | 19 | 13430 | 7.78 | 4720 | 4425 | 1157.4 |
| B | 2 | 9 | 14279 | 11.57 | 4437 | 4233 | 868.3 |
| B | 3 | 17 | 11178 | 8.0 | 4437 | 4233 | 868.3 |
| B | 14 | 254 | 11167 | 7.99 | 4437 | 4233 | 868.3 |
| C | 1 | 80 | 13365 | 7.46 | 4718 | 4401 | 1201.5 |
| C | 1 | 81 | 13113 | 7.25 | 4718 | 4401 | 1201.5 |
| C | 12 | 241 | 12714 | 6.92 | 4718 | 4401 | 1201.5 |
| D | 3 | 14 | 11274 | 6.25 | 4411 | 4021 | 1160.8 |
| D | 6 | 231 | 11236 | 6.22 | 4411 | 4021 | 1160.8 |
| D | 10 | 189 | 10792 | 5.83 | 4411 | 4021 | 1160.8 |
Histogram calculated using DETX and DETY for each event in the final _common_clean file
| Quadrant A | 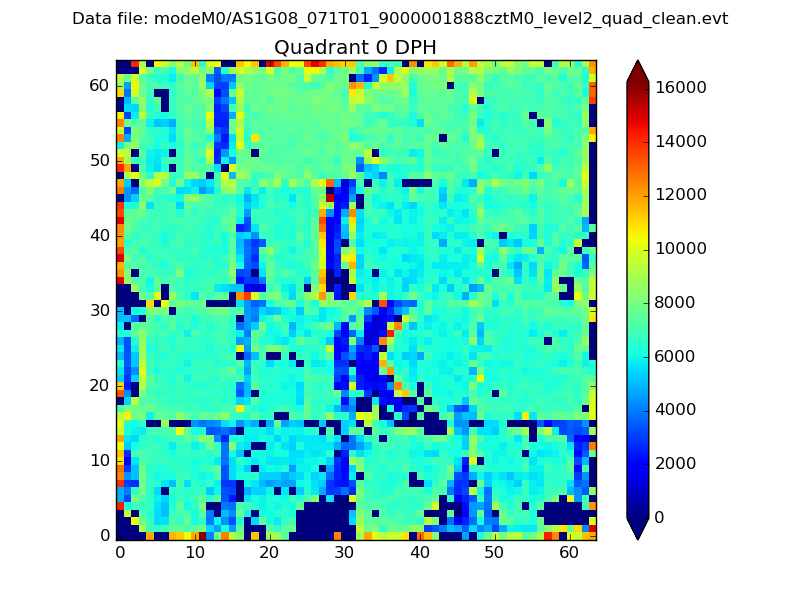 |
 |
Quadrant B |
|---|---|---|---|
| Quadrant D |  |
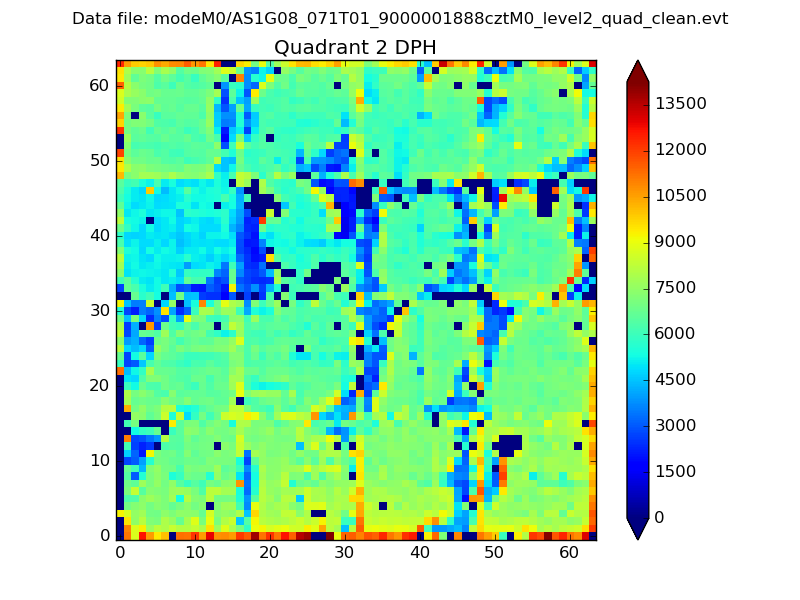 |
Quadrant C |
| Plot type | Count rate plots | Images |
|---|---|---|
| Comparison with Poisson distribution Blue bars denote a histogram of data divided into 1 sec bins. Red curve is a Poisson curve with rate = median count rate of data. |
 |
 |
| Quadrant-wise count rates Data is divided into 100 sec bins |
 |
|
| Module-wise count rates for Quadrant A Data is divided into 100 sec bins |
 |
 |
| Module-wise count rates for Quadrant B Data is divided into 100 sec bins |
 |
 |
| Module-wise count rates for Quadrant C Data is divided into 100 sec bins |
 |
 |
| Module-wise count rates for Quadrant D Data is divided into 100 sec bins |
 |
 |
| Parameter | Plot |
|---|---|
| CZT HV Monitor |  |
| D_VDD | 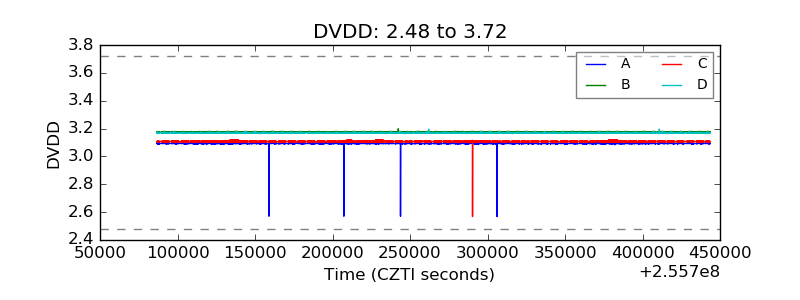 |
| Temperature 1 |  |
| Veto HV Monitor |  |
| Veto LLD |  |
| Alpha Counter |  |
| _CPM_Rate |  |
| CZT Counter |  |
| +2.5 Volts monitor |  |
| +5 Volts monitor |  |
| _ROLL_ROT |  |
| _Roll_DEC |  |
| _Roll_RA |  |
| Veto Counter |  |