| Param | Original file | Final file |
|---|---|---|
| Filename | modeM0/AS1G08_071T01_9000001888_12794cztM0_level2.evt | modeM0/AS1G08_071T01_9000001888_12794cztM0_level2_quad_clean.evt |
| Size (bytes) | 305,012,160 | 36,547,200 |
| Size | 290.9 MB | 34.9 MB |
| Events in quadrant A | 1,772,070 | 222,566 |
| Events in quadrant B | 2,184,664 | 219,462 |
| Events in quadrant C | 1,623,948 | 224,019 |
| Events in quadrant D | 3,439,652 | 214,455 |
| Mode SS | |||
|---|---|---|---|
| Quadrant | BADHDUFLAG | Total packets | Discarded packets |
| A | 0 | 66 | 0 |
| B | 0 | 66 | 0 |
| C | 0 | 66 | 0 |
| D | 0 | 66 | 0 |
| Mode M9 | |||
|---|---|---|---|
| Quadrant | BADHDUFLAG | Total packets | Discarded packets |
| A | 0 | 13 | 0 |
| B | 0 | 13 | 0 |
| C | 0 | 13 | 0 |
| D | 0 | 13 | 0 |
| Mode M0 | |||
|---|---|---|---|
| Quadrant | BADHDUFLAG | Total packets | Discarded packets |
| A | 0 | 7370 | 2 |
| B | 0 | 8702 | 1 |
| C | 0 | 6857 | 1 |
| D | 0 | 12239 | 1 |
| Quadrant | Total seconds | Saturated seconds | Saturation percentage |
|---|---|---|---|
| A | 3170 | 74 | 2.334385% |
| B | 3170 | 210 | 6.624606% |
| C | 3170 | 55 | 1.735016% |
| D | 3170 | 913 | 28.801262% |
Noise dominated data is calculated using 1-second bins in cleaned event files. If a bin has >2000 counts, and if more than 50% of those come from <1% of pixels, then it is considered to be noise-dominated and hence unusable.
| Quadrant | # 1 sec bins | Bins with >0 counts | Bins with >2000 counts | High rate bins dominated by noise | Noise dominated (total time) | Noise dominated (detector-on time) | Marked lightcurve |
|---|---|---|---|---|---|---|---|
| A | 4466 | 3172 | 1 | 1 | 0.02% | 0.03% | 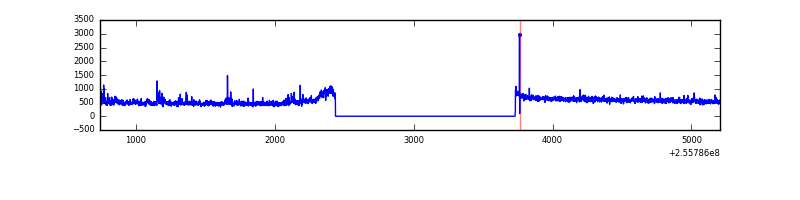 |
| B | 4466 | 3172 | 88 | 88 | 1.97% | 2.77% | 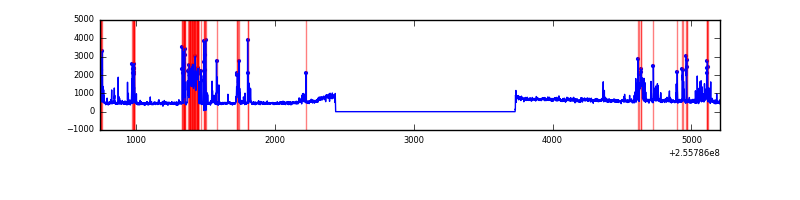 |
| C | 4466 | 3172 | 0 | 0 | 0.00% | 0.00% |  |
| D | 4466 | 3172 | 686 | 686 | 15.36% | 21.63% | 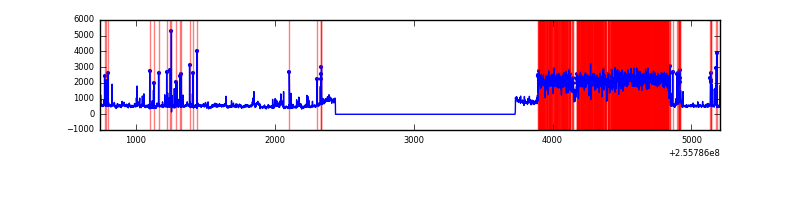 |
Top three noisy pixels from each quadrant. If the there are fewer than three noisy pixels in the level2.evt file, extra rows are filled as -1
| Pixel properties | Quadrant properties | ||||||
|---|---|---|---|---|---|---|---|
| Quadrant | DetID | PixID | Counts | Sigma | Mean | Median | Sigma |
| A | 12 | 189 | 94990 | 1091.61 | 427 | 419 | 86.6 |
| A | 8 | 15 | 16329 | 183.65 | 427 | 419 | 86.6 |
| A | 9 | 143 | 14003 | 156.8 | 427 | 419 | 86.6 |
| B | 4 | 239 | 478564 | 5974.34 | 421 | 411 | 80.0 |
| B | 0 | 219 | 36048 | 445.27 | 421 | 411 | 80.0 |
| B | 3 | 209 | 9209 | 109.93 | 421 | 411 | 80.0 |
| C | 13 | 61 | 3092 | 27.77 | 416 | 419 | 96.2 |
| C | 7 | 235 | 1174 | 7.85 | 416 | 419 | 96.2 |
| C | 3 | 202 | 1015 | 6.19 | 416 | 419 | 96.2 |
| D | 1 | 52 | 1826882 | 20317.92 | 374 | 363 | 89.9 |
| D | 8 | 195 | 146086 | 1621.0 | 374 | 363 | 89.9 |
| D | 13 | 172 | 22792 | 249.5 | 374 | 363 | 89.9 |
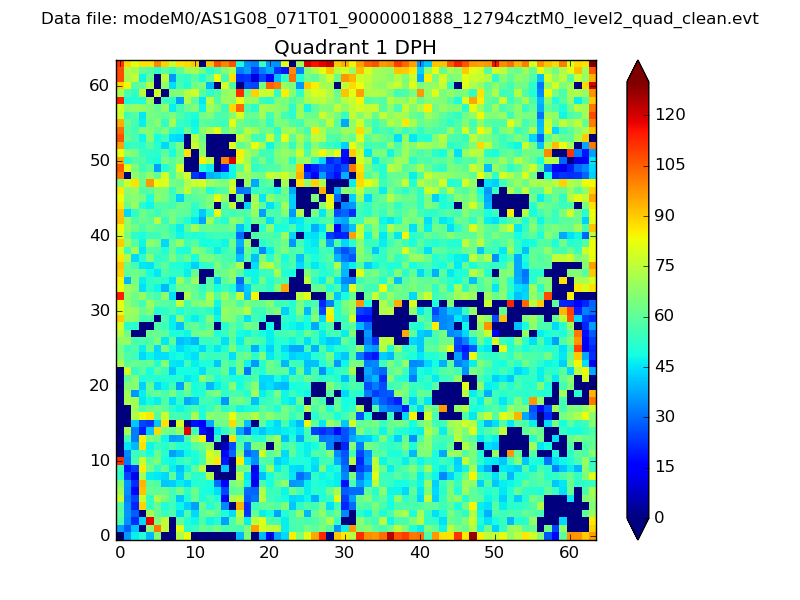
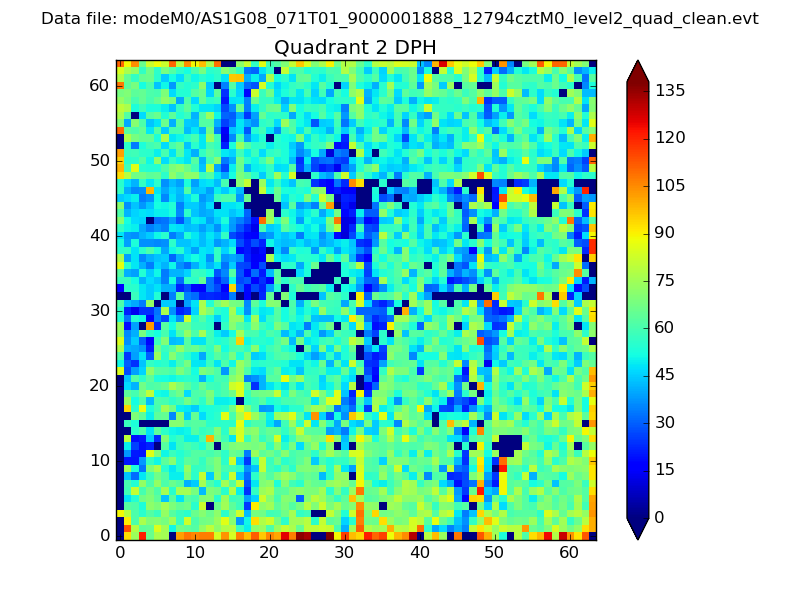
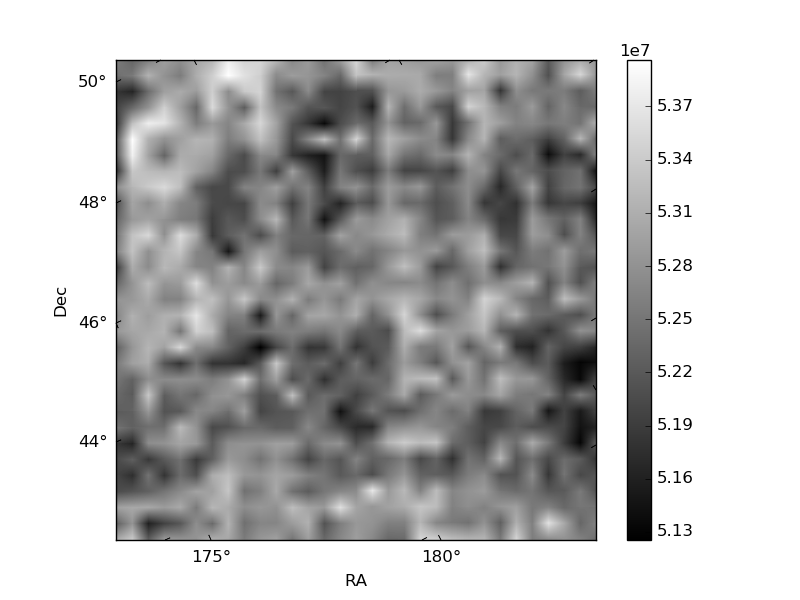
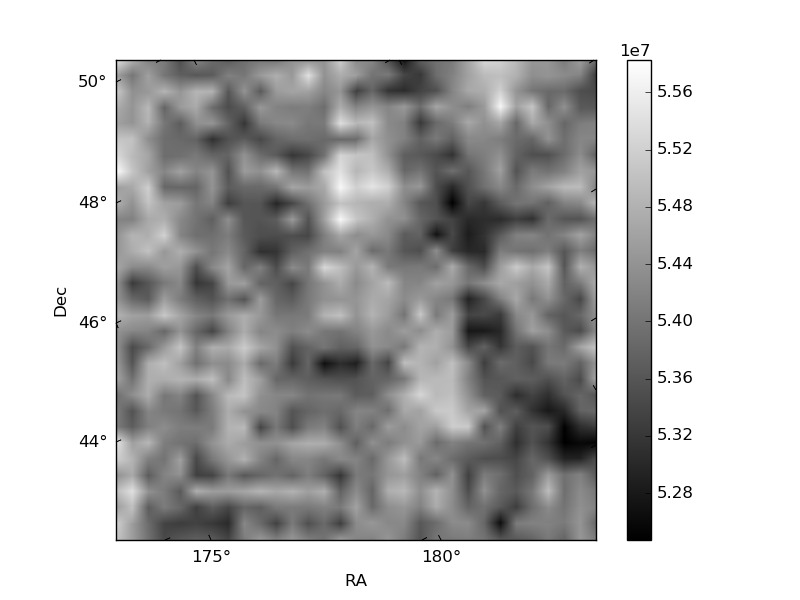
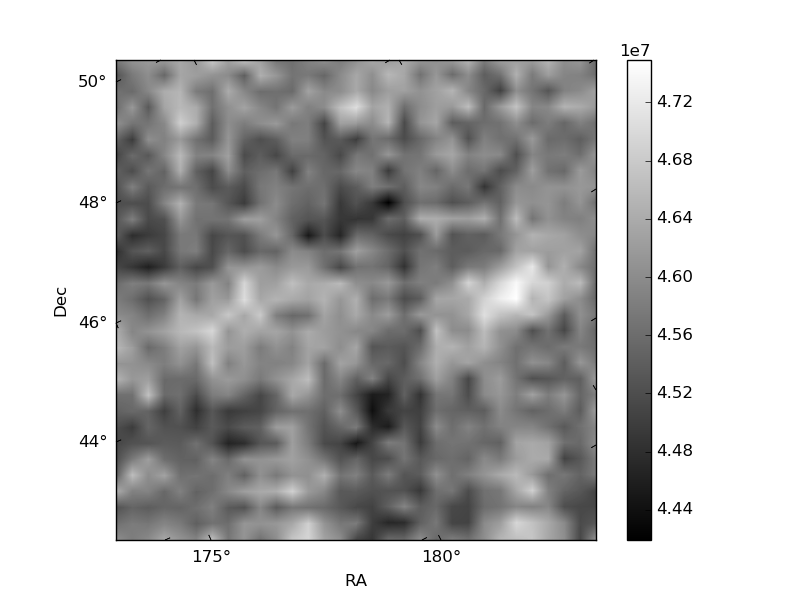
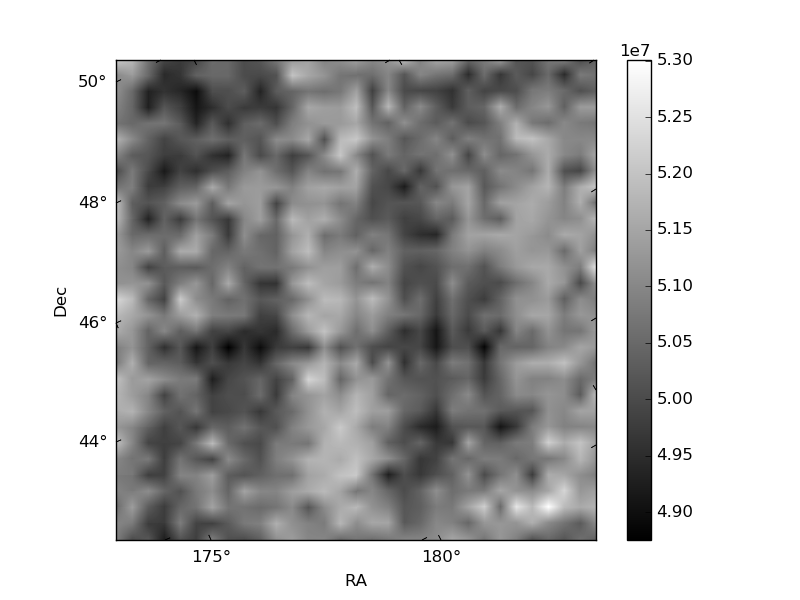
Histogram calculated using DETX and DETY for each event in the final _common_clean file
| Quadrant A | 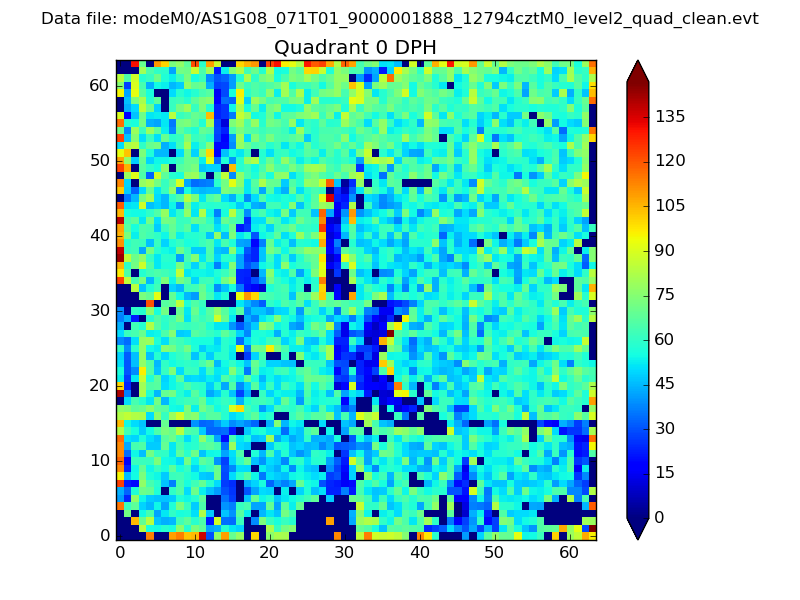 |
 |
Quadrant B |
|---|---|---|---|
| Quadrant D | 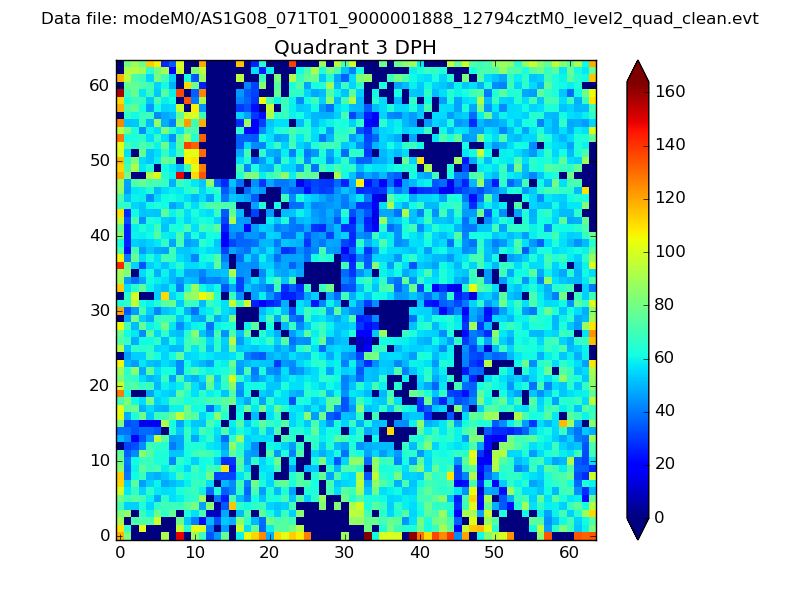 |
 |
Quadrant C |
| Plot type | Count rate plots | Images |
|---|---|---|
| Comparison with Poisson distribution Blue bars denote a histogram of data divided into 1 sec bins. Red curve is a Poisson curve with rate = median count rate of data. |
 |
 |
| Quadrant-wise count rates Data is divided into 100 sec bins |
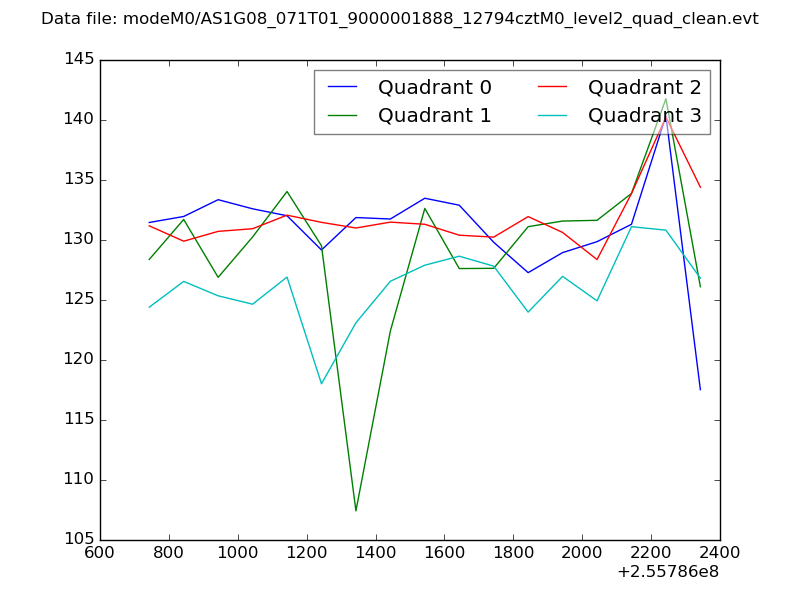 |
|
| Module-wise count rates for Quadrant A Data is divided into 100 sec bins |
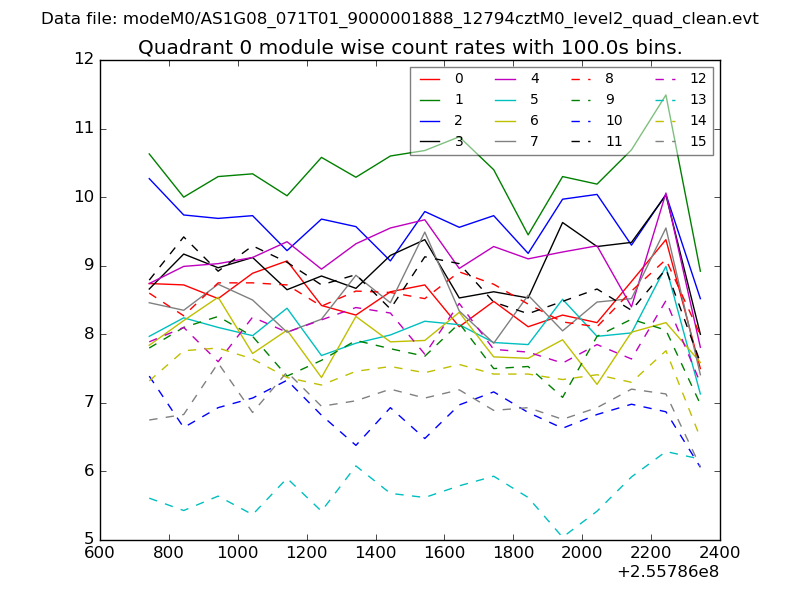 |
 |
| Module-wise count rates for Quadrant B Data is divided into 100 sec bins |
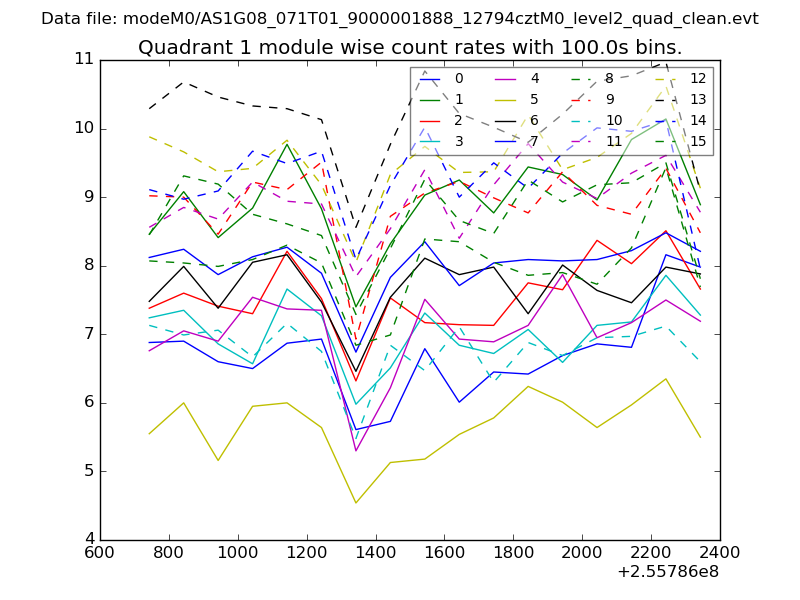 |
 |
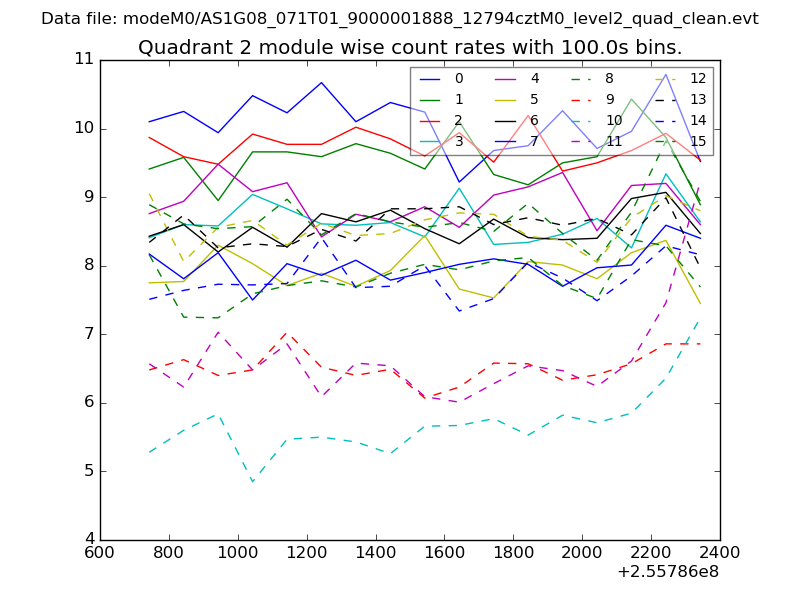
| Module-wise count rates for Quadrant C Data is divided into 100 sec bins |
 |
 |
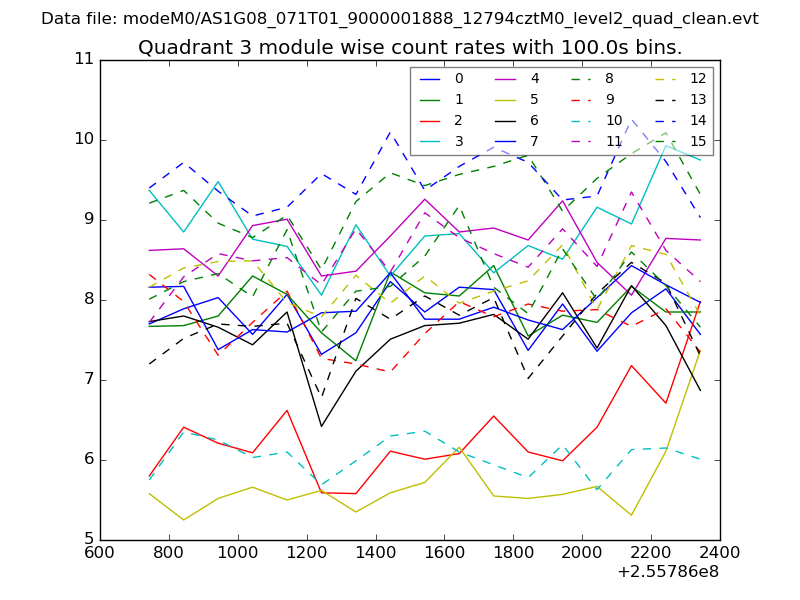
| Module-wise count rates for Quadrant D Data is divided into 100 sec bins |
 |
 |
| Parameter | Plot |
|---|---|
| CZT HV Monitor | 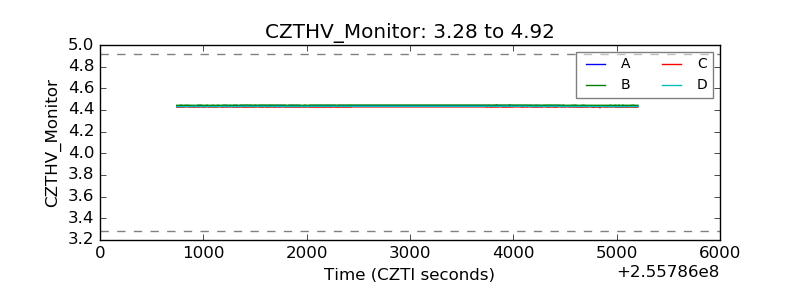 |
| D_VDD | 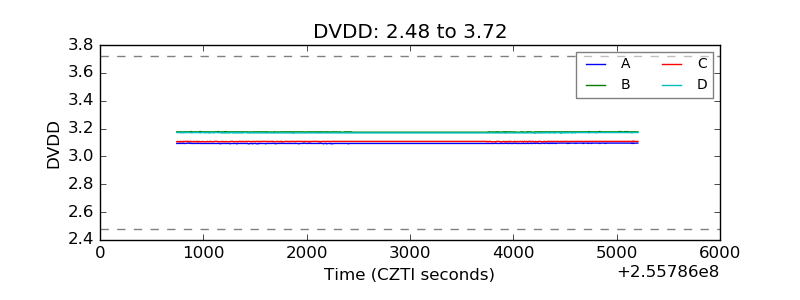 |
| Temperature 1 | 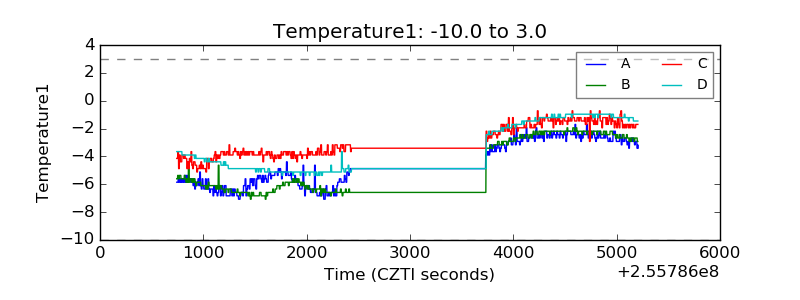 |
| Veto HV Monitor | 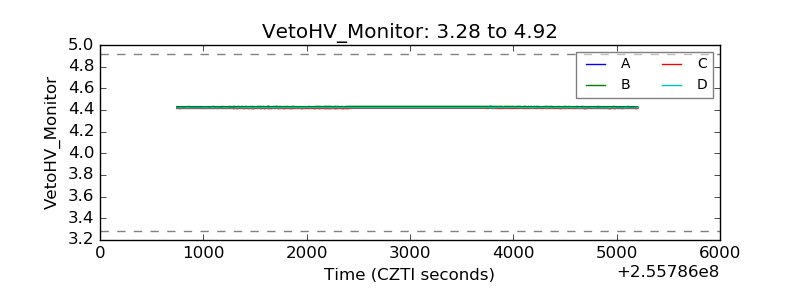 |
| Veto LLD | 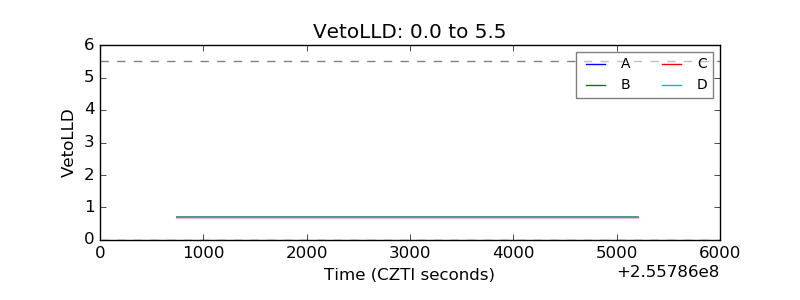 |
| Alpha Counter | 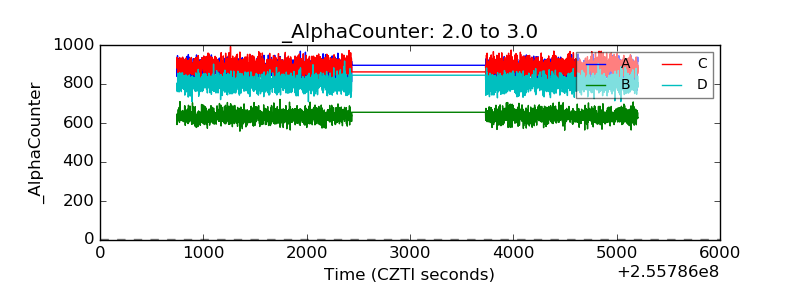 |
| _CPM_Rate | 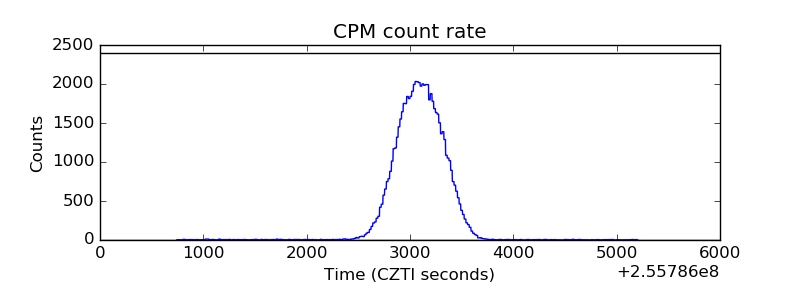 |
| CZT Counter | 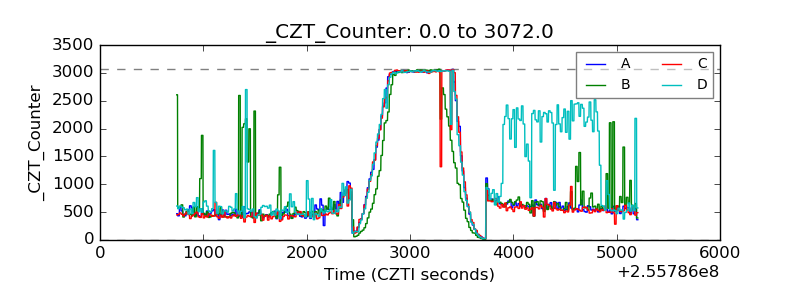 |
| +2.5 Volts monitor | 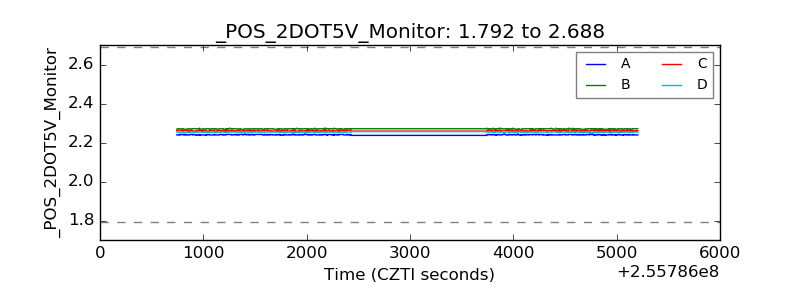 |
| +5 Volts monitor | 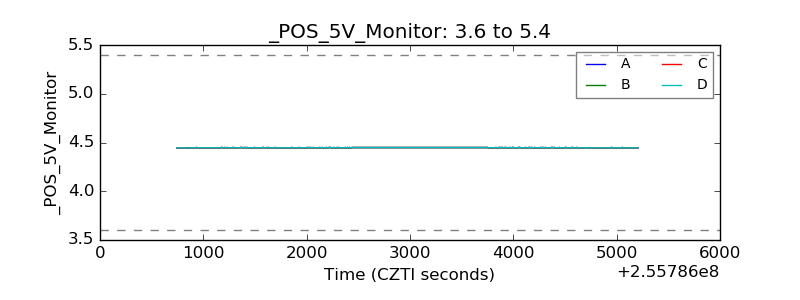 |
| _ROLL_ROT | 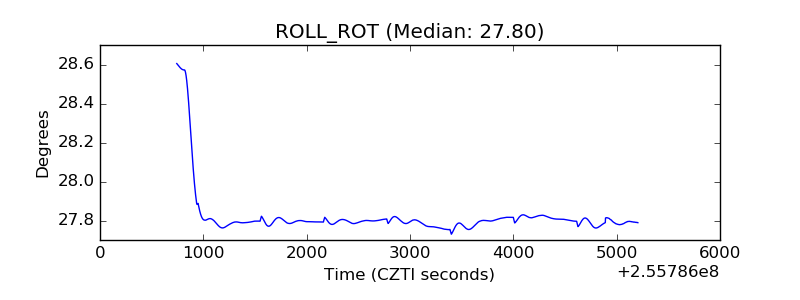 |
| _Roll_DEC | 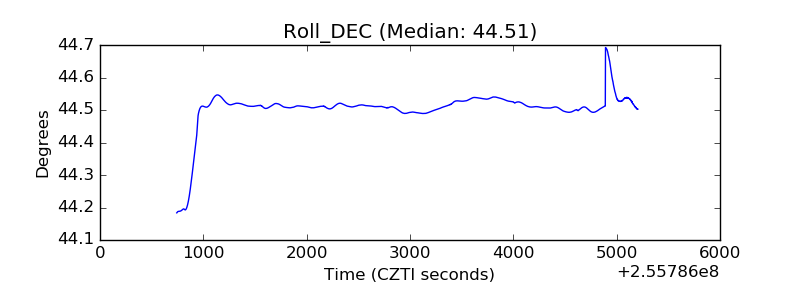 |
| _Roll_RA | 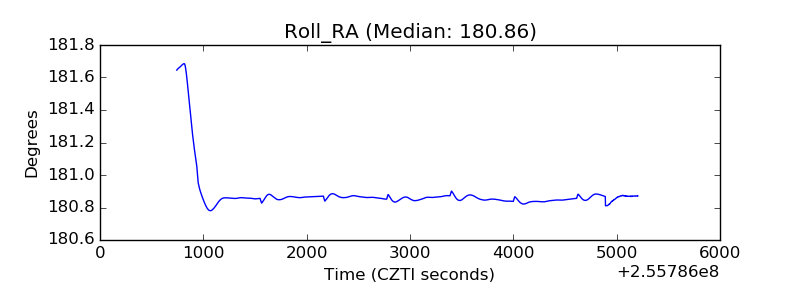 |
| Veto Counter | 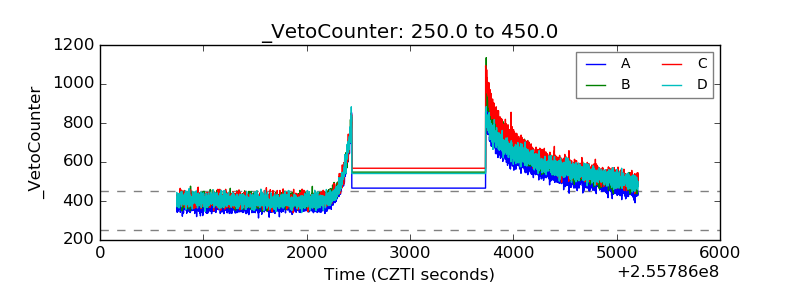 |