| Param | Original file | Final file |
|---|---|---|
| Filename | modeM0/AS1G08_071T01_9000001888_12801cztM0_level2.evt | modeM0/AS1G08_071T01_9000001888_12801cztM0_level2_quad_clean.evt |
| Size (bytes) | 540,815,040 | 103,184,640 |
| Size | 515.8 MB | 98.4 MB |
| Events in quadrant A | 3,719,369 | 658,309 |
| Events in quadrant B | 4,827,950 | 642,769 |
| Events in quadrant C | 3,391,739 | 668,361 |
| Events in quadrant D | 3,927,854 | 630,944 |
| Mode SS | |||
|---|---|---|---|
| Quadrant | BADHDUFLAG | Total packets | Discarded packets |
| A | 0 | 154 | 0 |
| B | 0 | 154 | 0 |
| C | 0 | 154 | 0 |
| D | 0 | 154 | 0 |
| Mode M9 | |||
|---|---|---|---|
| Quadrant | BADHDUFLAG | Total packets | Discarded packets |
| A | 0 | 7 | 0 |
| B | 0 | 7 | 0 |
| C | 0 | 7 | 0 |
| D | 0 | 7 | 0 |
| Mode M0 | |||
|---|---|---|---|
| Quadrant | BADHDUFLAG | Total packets | Discarded packets |
| A | 0 | 16297 | 3 |
| B | 0 | 19458 | 2 |
| C | 0 | 15584 | 2 |
| D | 0 | 17207 | 2 |
| Quadrant | Total seconds | Saturated seconds | Saturation percentage |
|---|---|---|---|
| A | 7537 | 113 | 1.499270% |
| B | 7537 | 518 | 6.872761% |
| C | 7537 | 81 | 1.074698% |
| D | 7537 | 221 | 2.932201% |
Noise dominated data is calculated using 1-second bins in cleaned event files. If a bin has >2000 counts, and if more than 50% of those come from <1% of pixels, then it is considered to be noise-dominated and hence unusable.
| Quadrant | # 1 sec bins | Bins with >0 counts | Bins with >2000 counts | High rate bins dominated by noise | Noise dominated (total time) | Noise dominated (detector-on time) | Marked lightcurve |
|---|---|---|---|---|---|---|---|
| A | 8228 | 7541 | 6 | 6 | 0.07% | 0.08% | 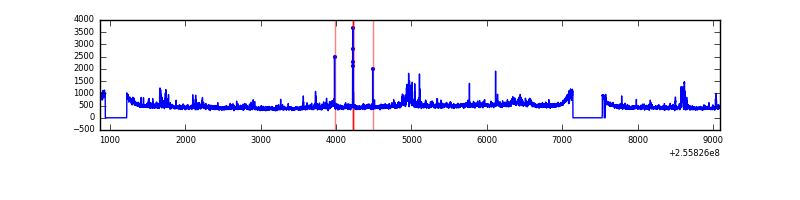 |
| B | 8228 | 7541 | 267 | 267 | 3.25% | 3.54% | 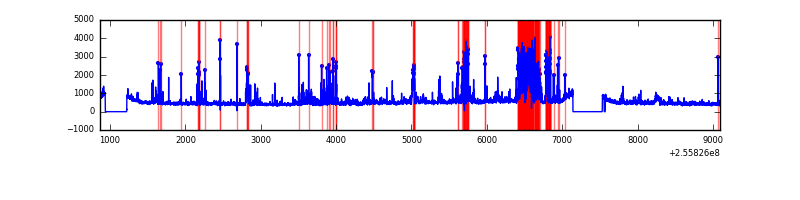 |
| C | 8228 | 7541 | 1 | 1 | 0.01% | 0.01% | 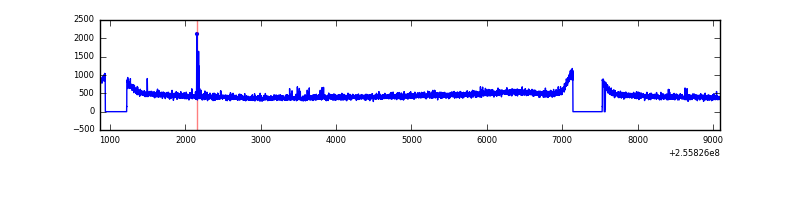 |
| D | 8228 | 7541 | 117 | 117 | 1.42% | 1.55% | 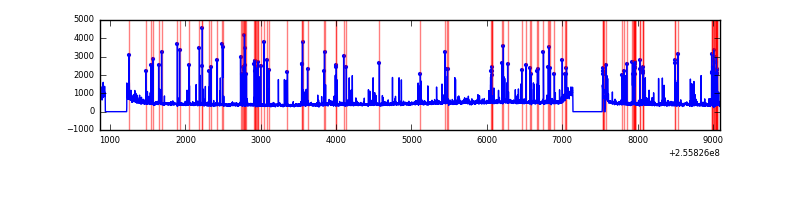 |
Top three noisy pixels from each quadrant. If the there are fewer than three noisy pixels in the level2.evt file, extra rows are filled as -1
| Pixel properties | Quadrant properties | ||||||
|---|---|---|---|---|---|---|---|
| Quadrant | DetID | PixID | Counts | Sigma | Mean | Median | Sigma |
| A | 12 | 189 | 191496 | 1066.38 | 878 | 858 | 178.8 |
| A | 8 | 15 | 135722 | 754.4 | 878 | 858 | 178.8 |
| A | 13 | 248 | 15118 | 79.77 | 878 | 858 | 178.8 |
| B | 4 | 239 | 834890 | 5024.49 | 856 | 835 | 166.0 |
| B | 10 | 245 | 330203 | 1984.17 | 856 | 835 | 166.0 |
| B | 0 | 214 | 76202 | 454.02 | 856 | 835 | 166.0 |
| C | 14 | 234 | 11231 | 51.37 | 864 | 867 | 201.7 |
| C | 13 | 61 | 6220 | 26.53 | 864 | 867 | 201.7 |
| C | 15 | 208 | 5223 | 21.59 | 864 | 867 | 201.7 |
| D | 8 | 195 | 369435 | 1799.5 | 845 | 819 | 204.8 |
| D | 1 | 52 | 266245 | 1295.75 | 845 | 819 | 204.8 |
| D | 10 | 253 | 46773 | 224.34 | 845 | 819 | 204.8 |
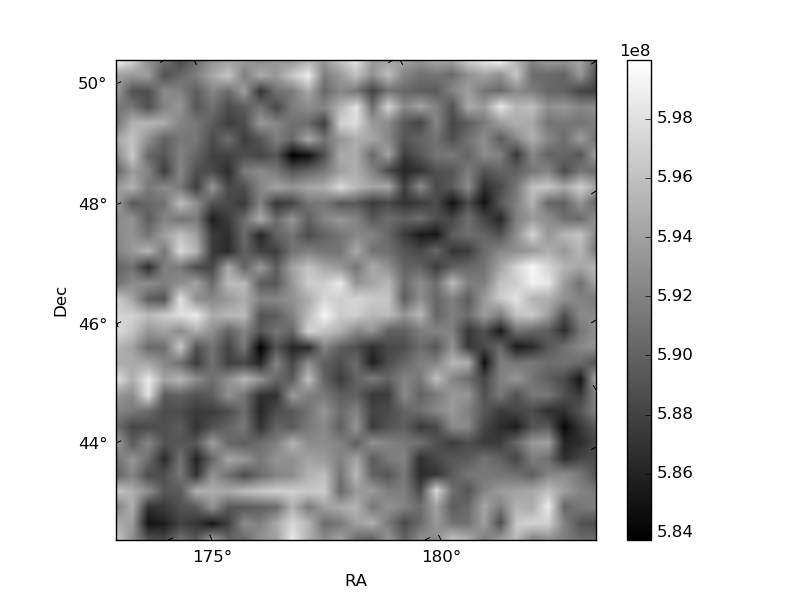
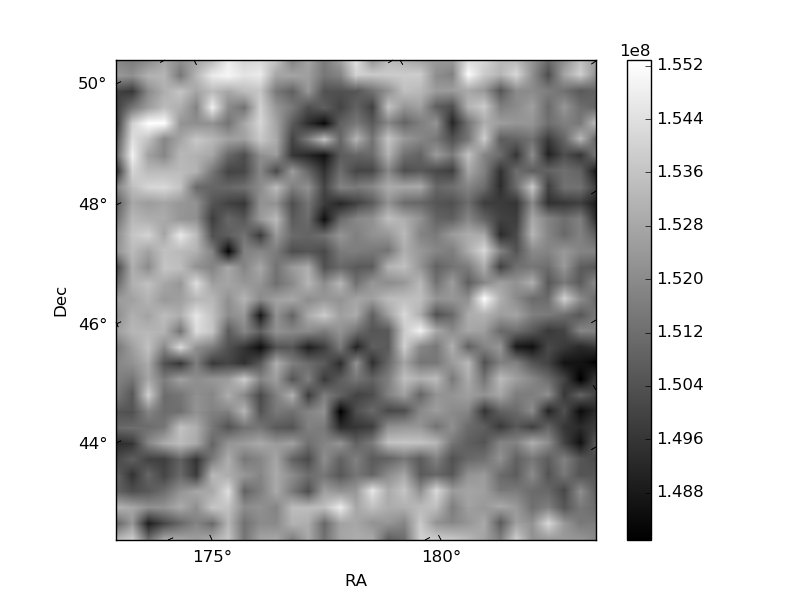
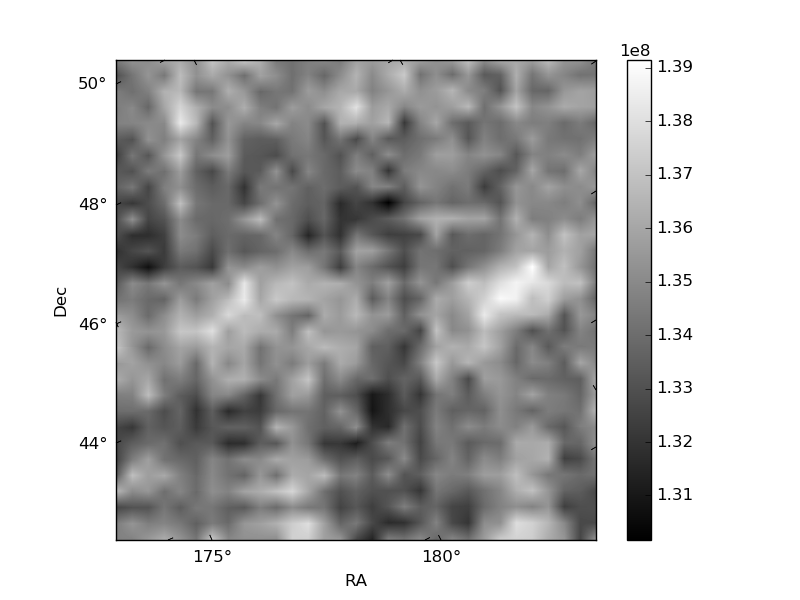
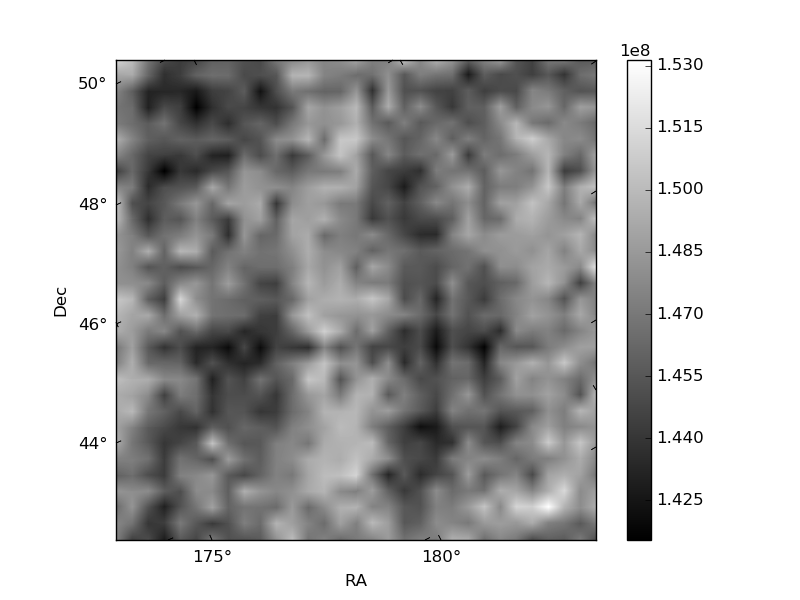
Histogram calculated using DETX and DETY for each event in the final _common_clean file
| Quadrant A | 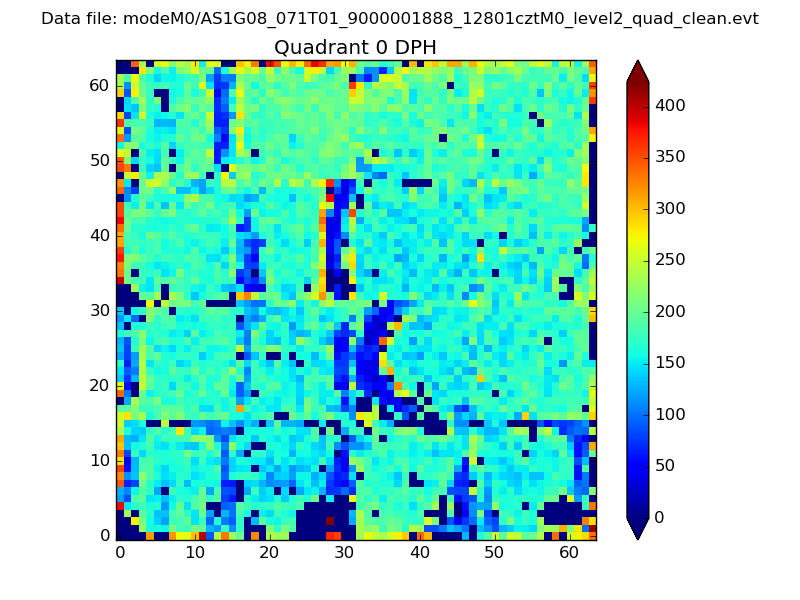 |
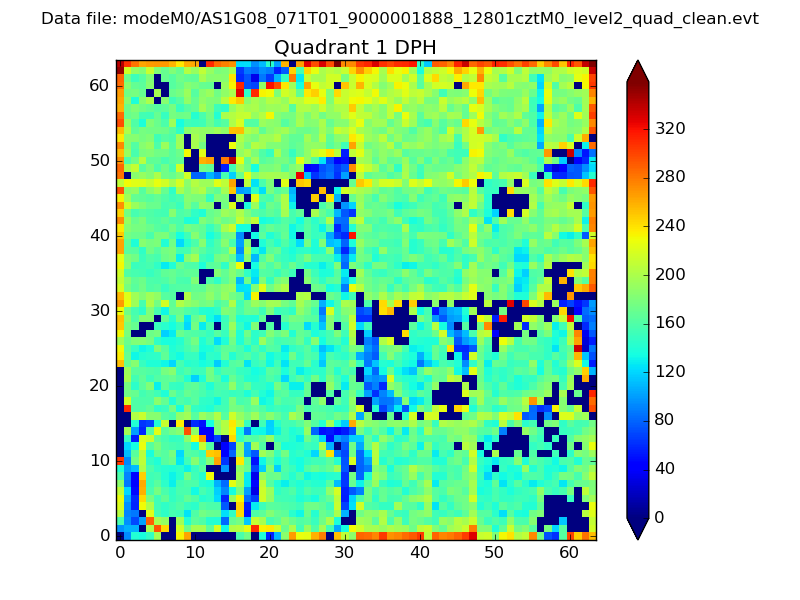 |
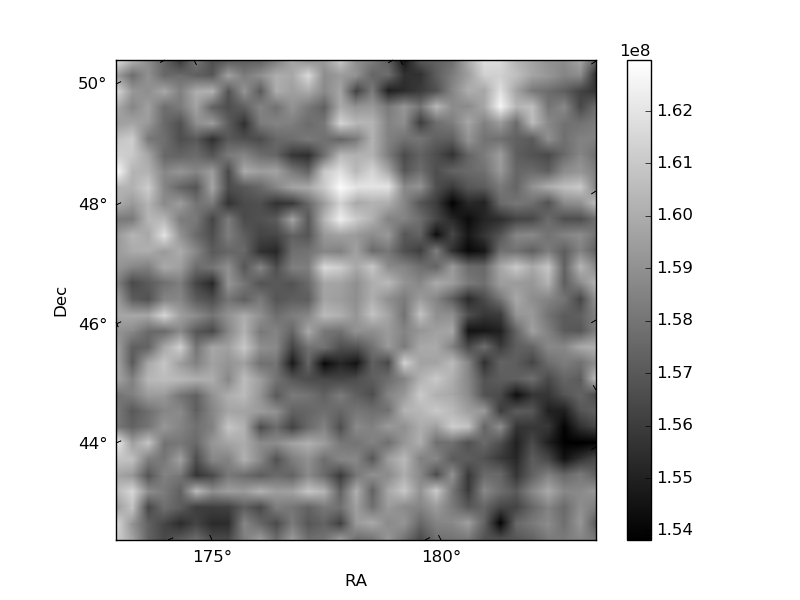
Quadrant B |
|---|---|---|---|
| Quadrant D | 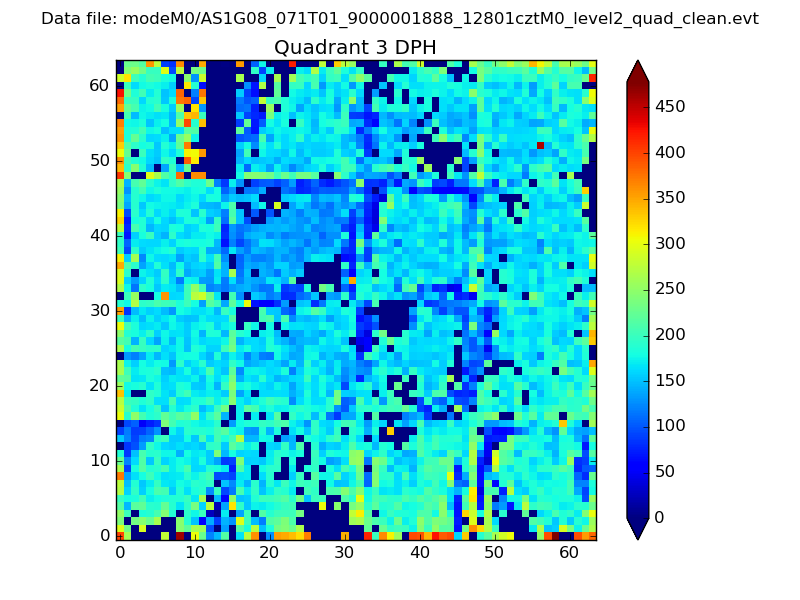 |
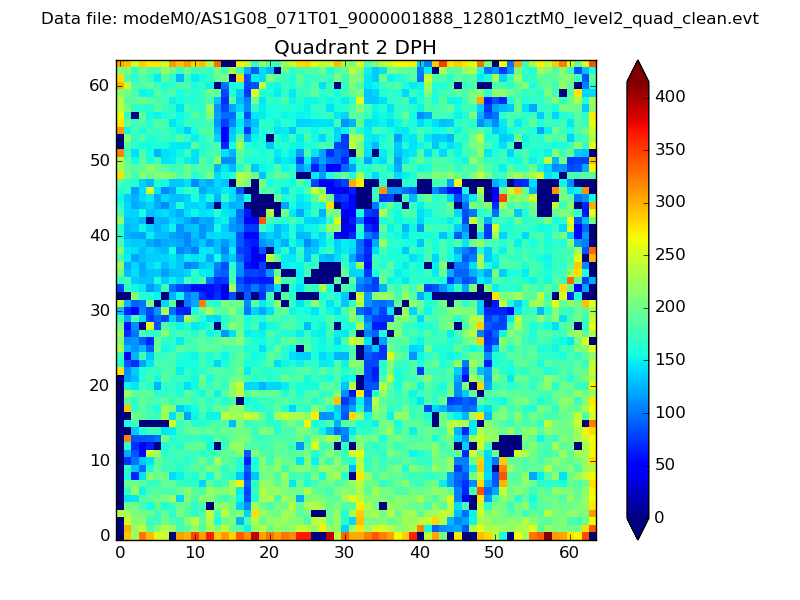 |
Quadrant C |
| Plot type | Count rate plots | Images |
|---|---|---|
| Comparison with Poisson distribution Blue bars denote a histogram of data divided into 1 sec bins. Red curve is a Poisson curve with rate = median count rate of data. |
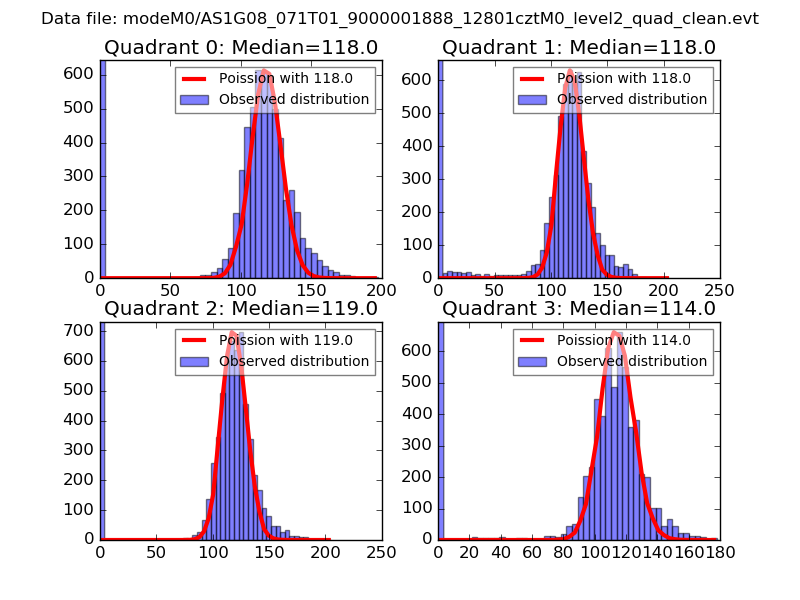 |
 |
| Quadrant-wise count rates Data is divided into 100 sec bins |
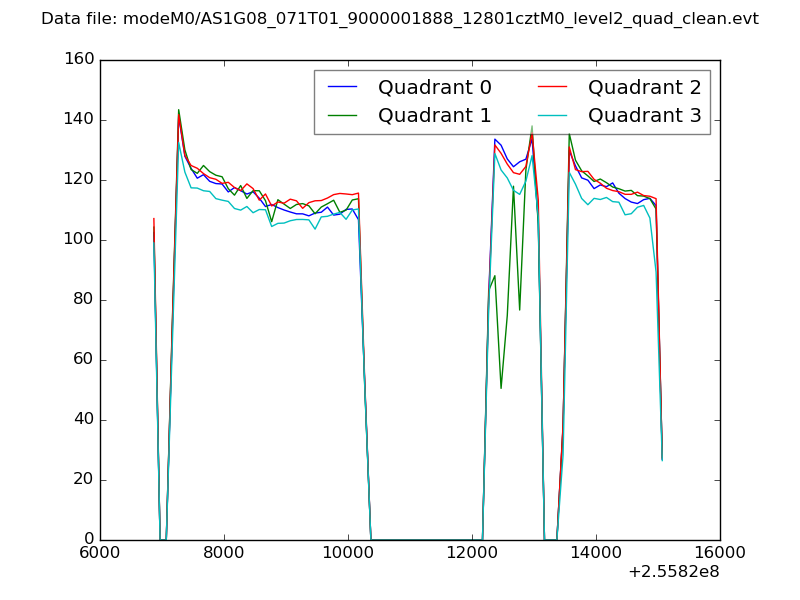 |
|
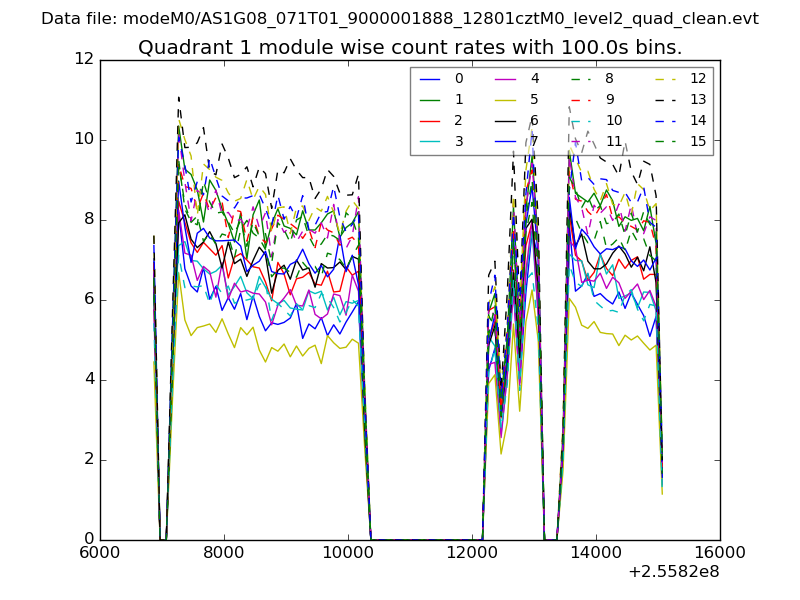
| Module-wise count rates for Quadrant A Data is divided into 100 sec bins |
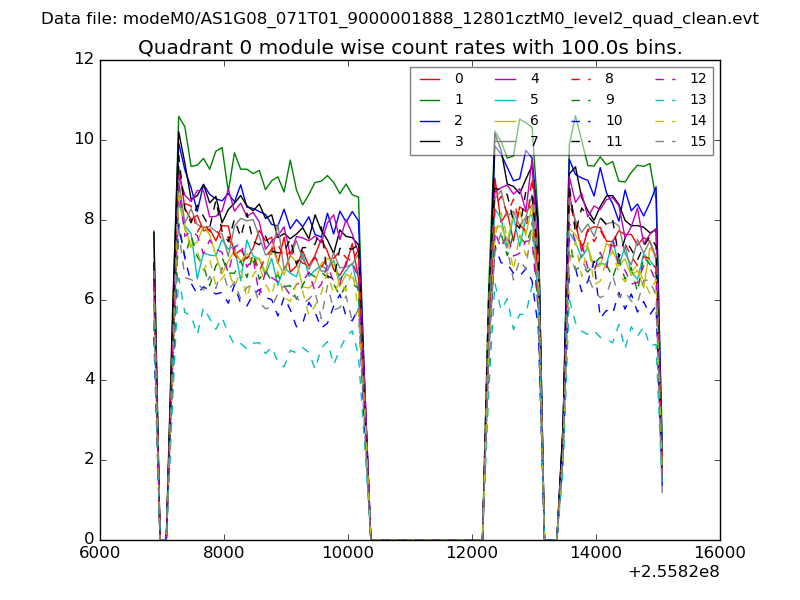 |
 |
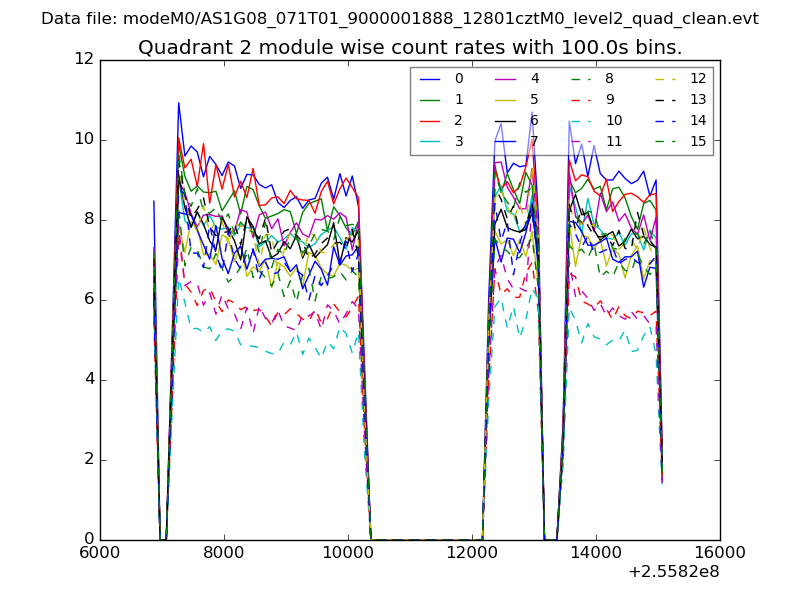
| Module-wise count rates for Quadrant B Data is divided into 100 sec bins |
 |
 |
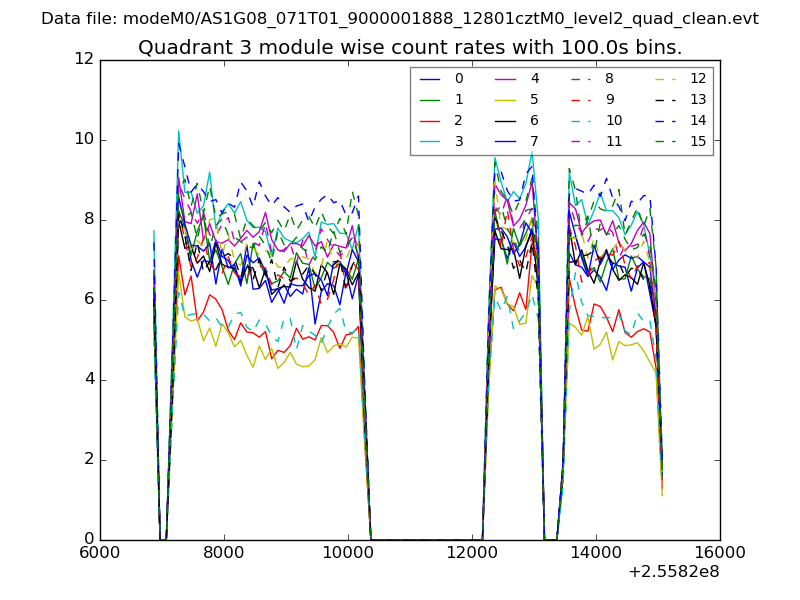
| Module-wise count rates for Quadrant C Data is divided into 100 sec bins |
 |
 |
| Module-wise count rates for Quadrant D Data is divided into 100 sec bins |
 |
 |
| Parameter | Plot |
|---|---|
| CZT HV Monitor | 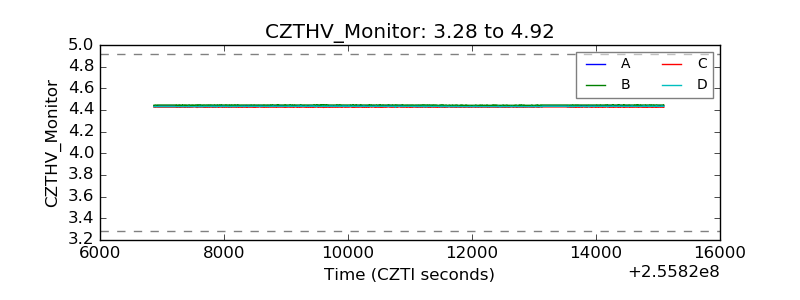 |
| D_VDD | 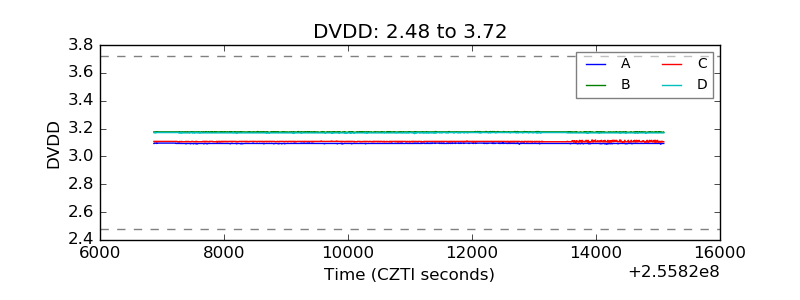 |
| Temperature 1 | 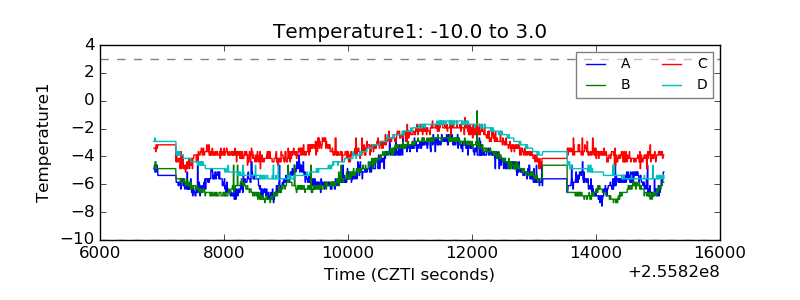 |
| Veto HV Monitor | 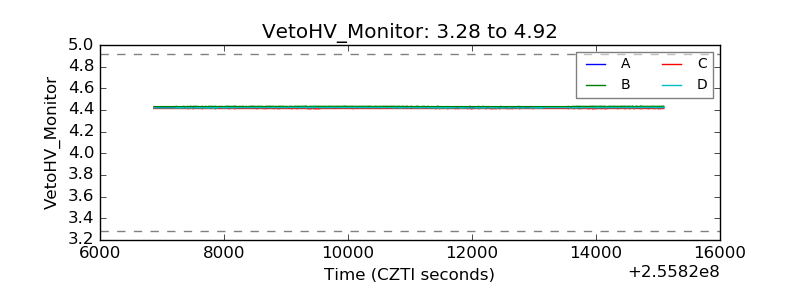 |
| Veto LLD | 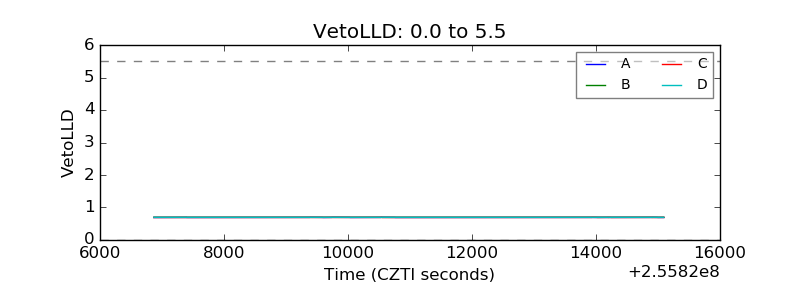 |
| Alpha Counter | 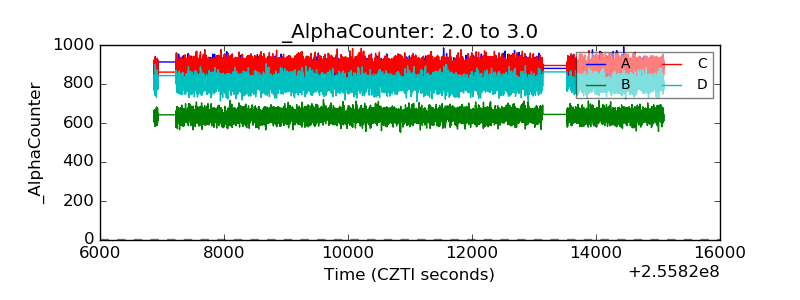 |
| _CPM_Rate | 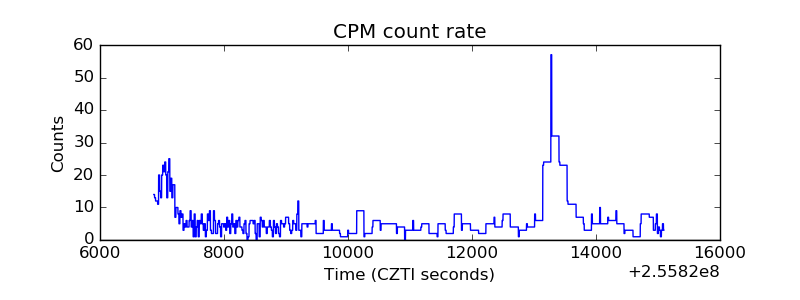 |
| CZT Counter | 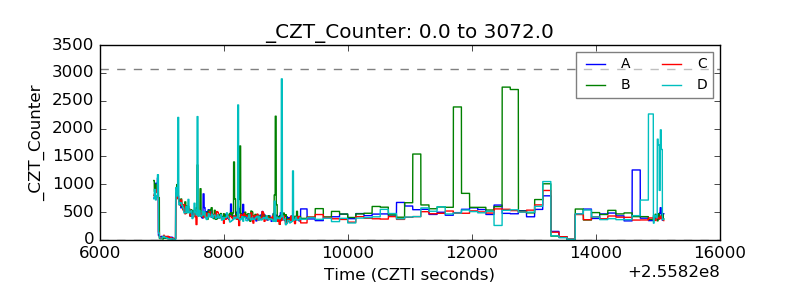 |
| +2.5 Volts monitor |  |
| +5 Volts monitor | 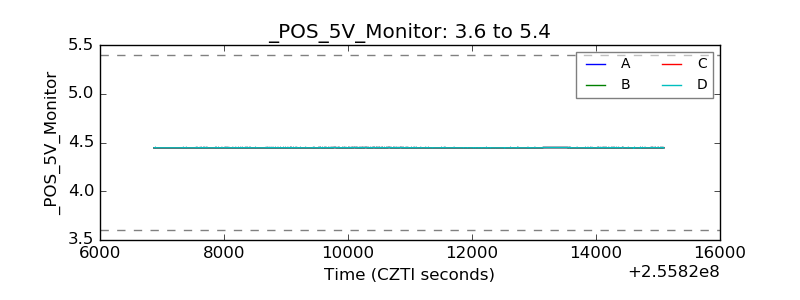 |
| _ROLL_ROT |  |
| _Roll_DEC | 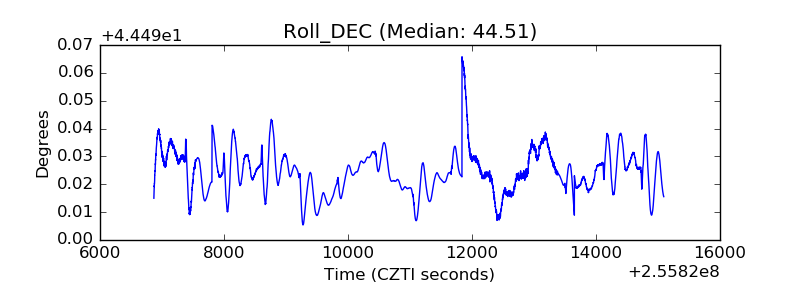 |
| _Roll_RA | 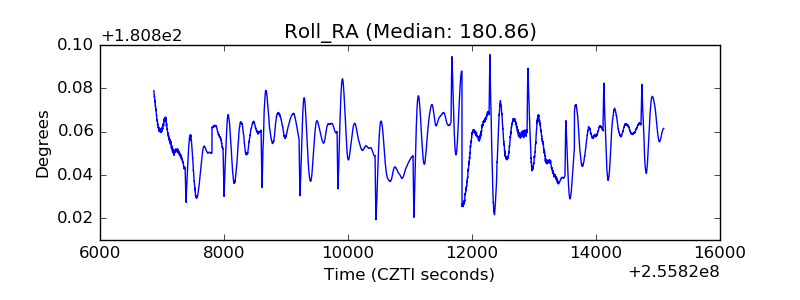 |
| Veto Counter | 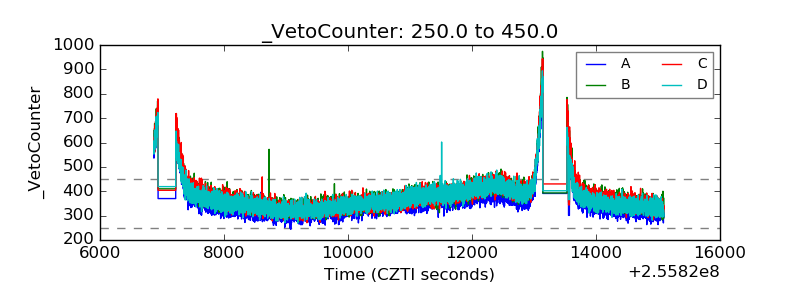 |