| Param | Original file | Final file |
|---|---|---|
| Filename | modeM0/AS1G08_071T01_9000001888_12803cztM0_level2.evt | modeM0/AS1G08_071T01_9000001888_12803cztM0_level2_quad_clean.evt |
| Size (bytes) | 1,016,481,600 | 180,976,320 |
| Size | 969.4 MB | 172.6 MB |
| Events in quadrant A | 6,466,592 | 1,156,257 |
| Events in quadrant B | 9,542,134 | 1,108,211 |
| Events in quadrant C | 6,088,297 | 1,167,447 |
| Events in quadrant D | 7,764,580 | 1,107,012 |
| Mode SS | |||
|---|---|---|---|
| Quadrant | BADHDUFLAG | Total packets | Discarded packets |
| A | 0 | 280 | 0 |
| B | 0 | 280 | 0 |
| C | 0 | 280 | 0 |
| D | 0 | 280 | 0 |
| Mode M9 | |||
|---|---|---|---|
| Quadrant | BADHDUFLAG | Total packets | Discarded packets |
| A | 0 | 17 | 0 |
| B | 0 | 17 | 0 |
| C | 0 | 17 | 0 |
| D | 0 | 17 | 0 |
| Mode M0 | |||
|---|---|---|---|
| Quadrant | BADHDUFLAG | Total packets | Discarded packets |
| A | 0 | 28418 | 4 |
| B | 0 | 37549 | 3 |
| C | 0 | 27834 | 3 |
| D | 0 | 32613 | 3 |
| Quadrant | Total seconds | Saturated seconds | Saturation percentage |
|---|---|---|---|
| A | 13629 | 129 | 0.946511% |
| B | 13629 | 1176 | 8.628659% |
| C | 13629 | 96 | 0.704380% |
| D | 13629 | 605 | 4.439064% |
Noise dominated data is calculated using 1-second bins in cleaned event files. If a bin has >2000 counts, and if more than 50% of those come from <1% of pixels, then it is considered to be noise-dominated and hence unusable.
| Quadrant | # 1 sec bins | Bins with >0 counts | Bins with >2000 counts | High rate bins dominated by noise | Noise dominated (total time) | Noise dominated (detector-on time) | Marked lightcurve |
|---|---|---|---|---|---|---|---|
| A | 15410 | 13635 | 0 | 0 | 0.00% | 0.00% | 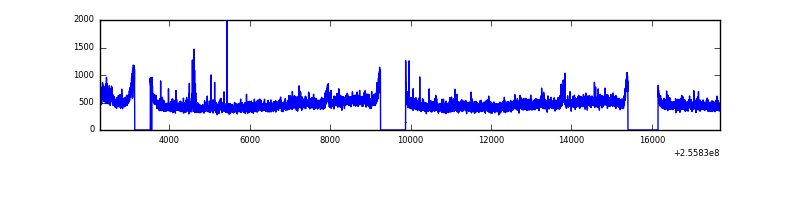 |
| B | 15410 | 13635 | 640 | 640 | 4.15% | 4.69% | 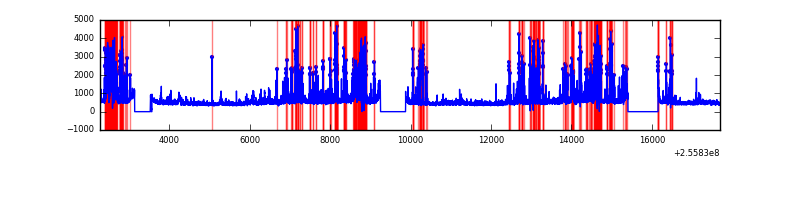 |
| C | 15410 | 13635 | 0 | 0 | 0.00% | 0.00% | 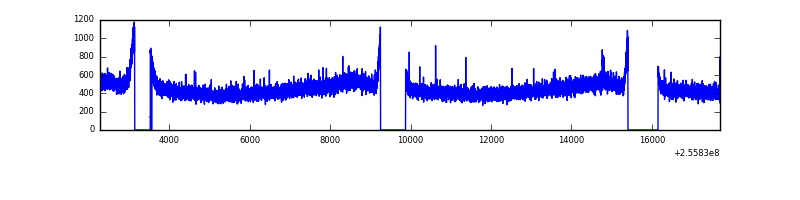 |
| D | 15410 | 13635 | 371 | 371 | 2.41% | 2.72% | 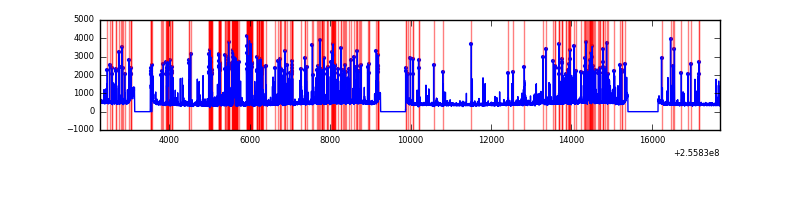 |
Top three noisy pixels from each quadrant. If the there are fewer than three noisy pixels in the level2.evt file, extra rows are filled as -1
| Pixel properties | Quadrant properties | ||||||
|---|---|---|---|---|---|---|---|
| Quadrant | DetID | PixID | Counts | Sigma | Mean | Median | Sigma |
| A | 12 | 189 | 243259 | 749.88 | 1596 | 1560 | 322.3 |
| A | 8 | 15 | 76496 | 232.49 | 1596 | 1560 | 322.3 |
| A | 0 | 226 | 13970 | 38.5 | 1596 | 1560 | 322.3 |
| B | 4 | 239 | 2331789 | 7999.67 | 1526 | 1486 | 291.3 |
| B | 10 | 245 | 581183 | 1990.04 | 1526 | 1486 | 291.3 |
| B | 0 | 219 | 388430 | 1328.34 | 1526 | 1486 | 291.3 |
| C | 8 | 128 | 12183 | 29.51 | 1554 | 1562 | 359.9 |
| C | 13 | 61 | 11501 | 27.62 | 1554 | 1562 | 359.9 |
| C | 5 | 96 | 7461 | 16.39 | 1554 | 1562 | 359.9 |
| D | 1 | 52 | 1040699 | 2850.04 | 1519 | 1473 | 364.6 |
| D | 8 | 195 | 736620 | 2016.12 | 1519 | 1473 | 364.6 |
| D | 10 | 253 | 67101 | 179.98 | 1519 | 1473 | 364.6 |
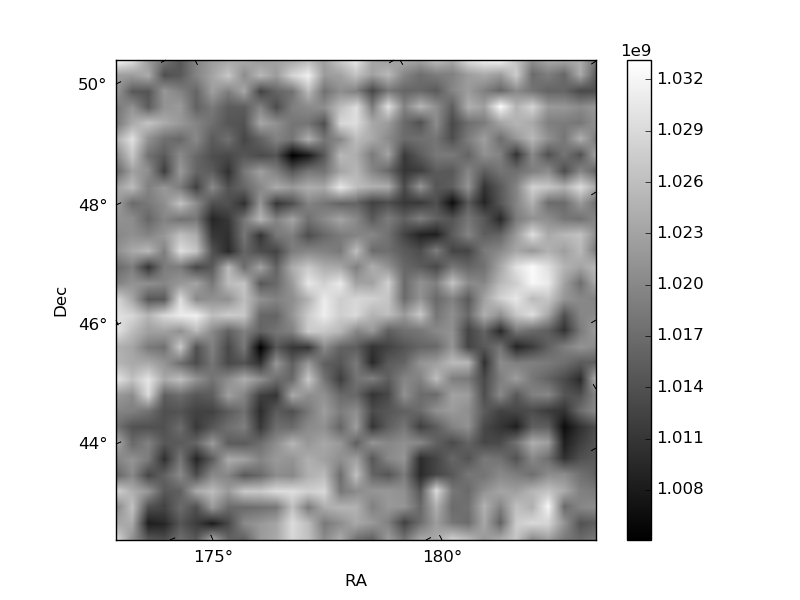
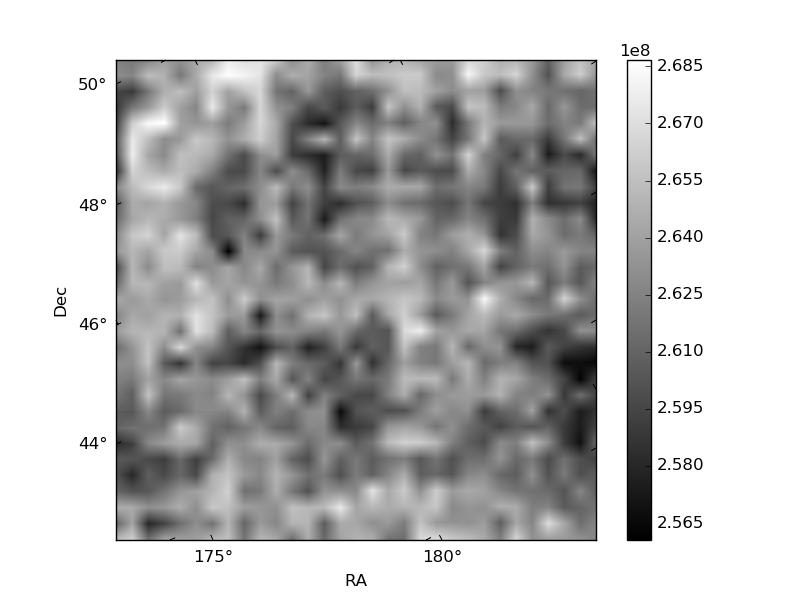
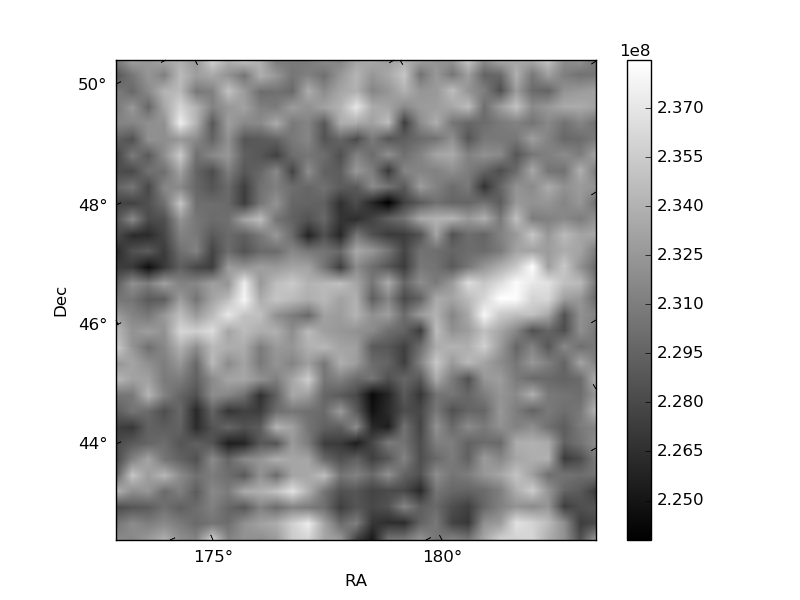
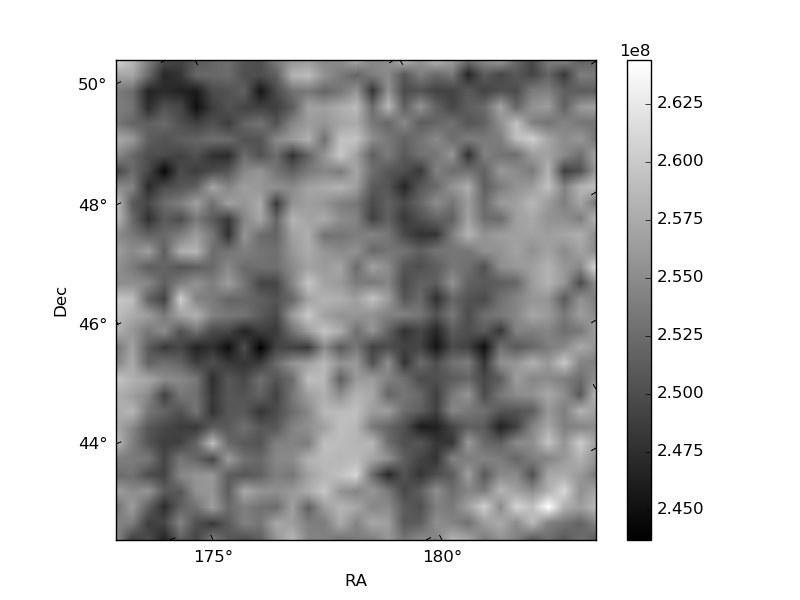
Histogram calculated using DETX and DETY for each event in the final _common_clean file
| Quadrant A | 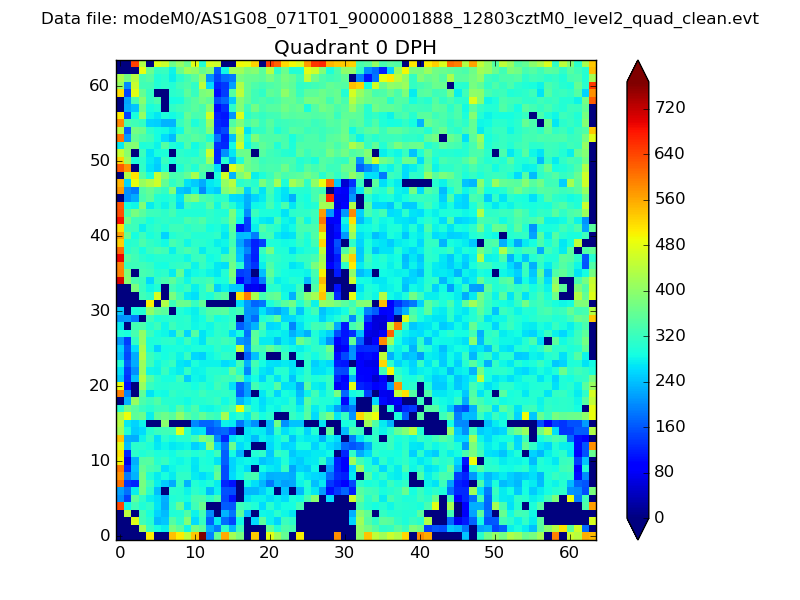 |
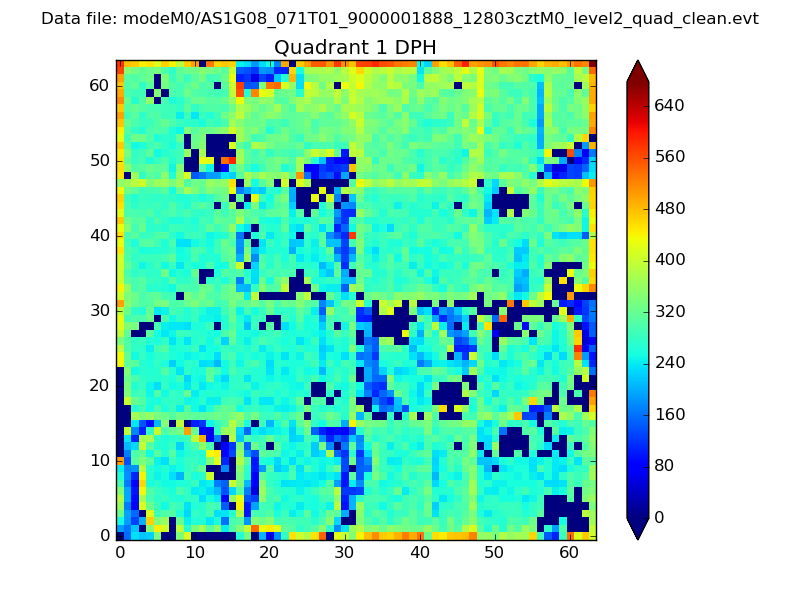 |
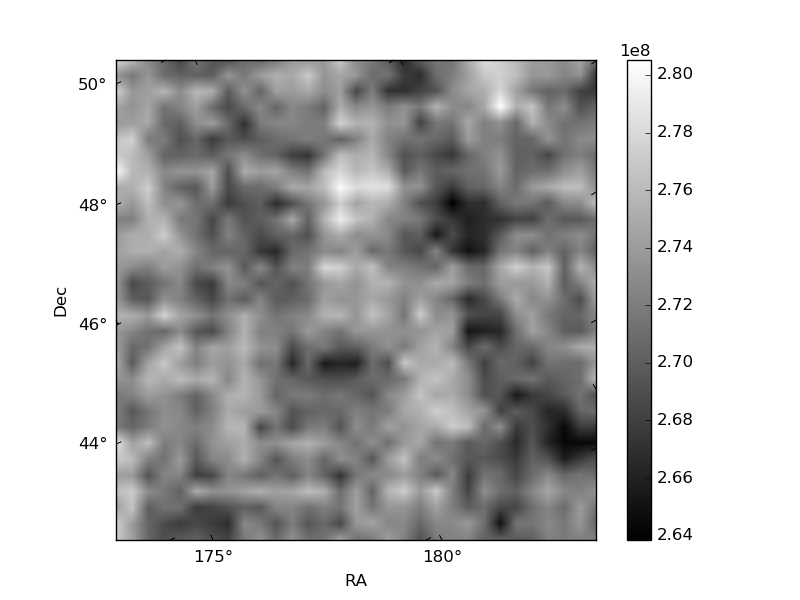
Quadrant B |
|---|---|---|---|
| Quadrant D | 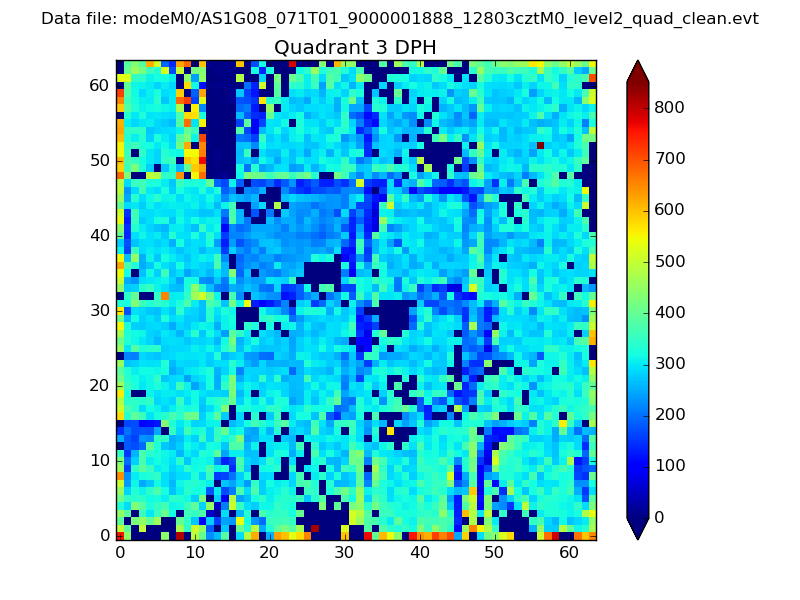 |
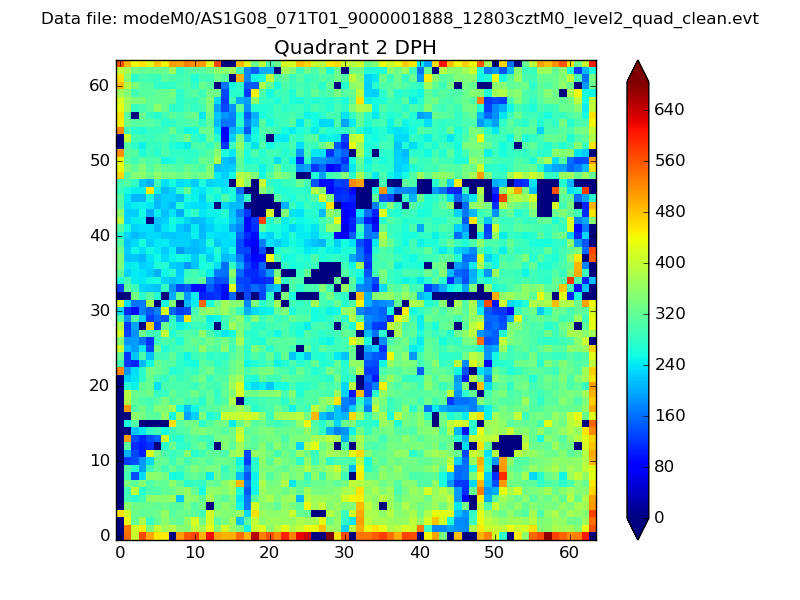 |
Quadrant C |
| Plot type | Count rate plots | Images |
|---|---|---|
| Comparison with Poisson distribution Blue bars denote a histogram of data divided into 1 sec bins. Red curve is a Poisson curve with rate = median count rate of data. |
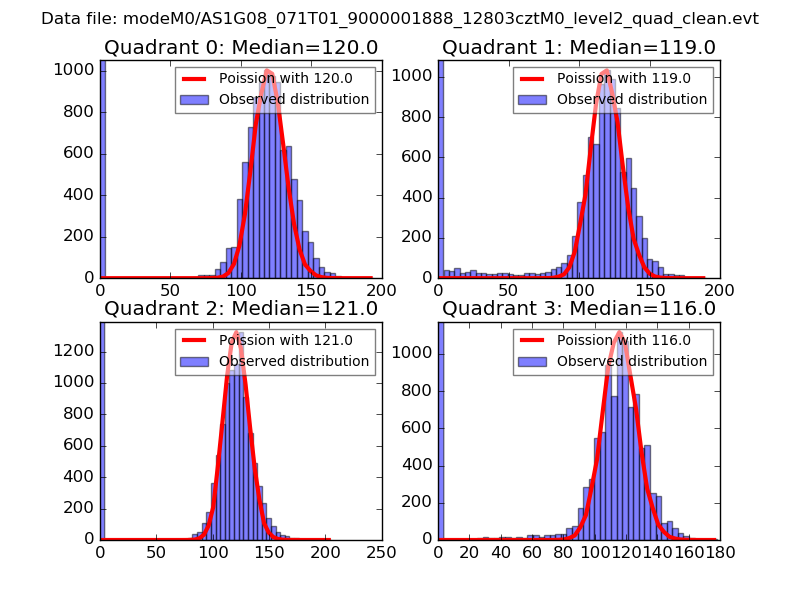 |
 |
| Quadrant-wise count rates Data is divided into 100 sec bins |
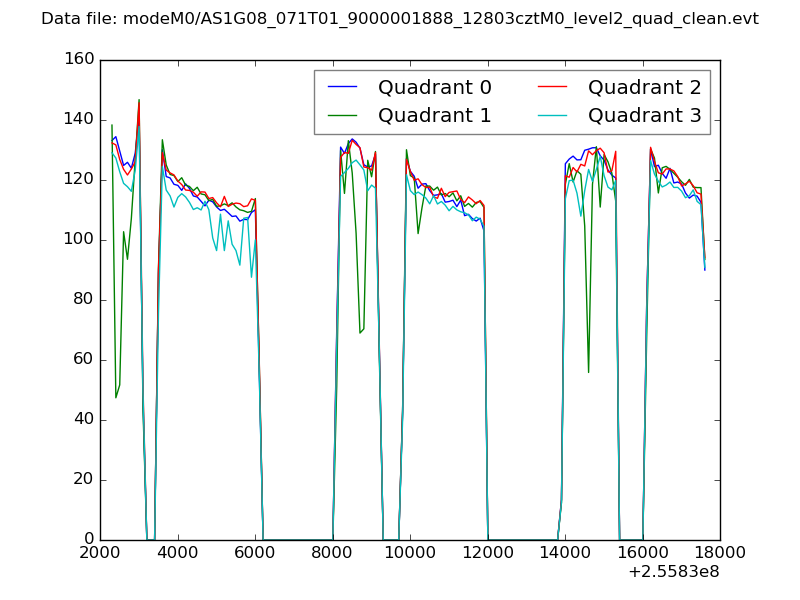 |
|
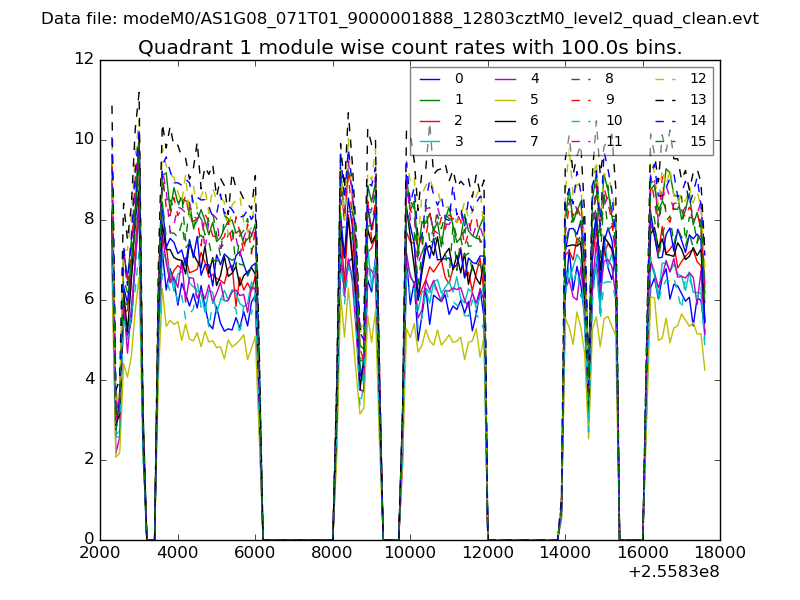
| Module-wise count rates for Quadrant A Data is divided into 100 sec bins |
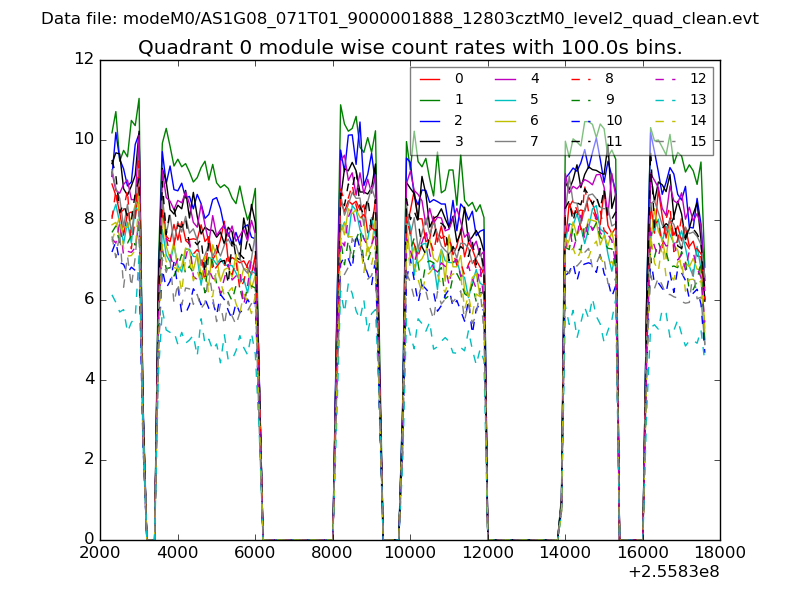 |
 |
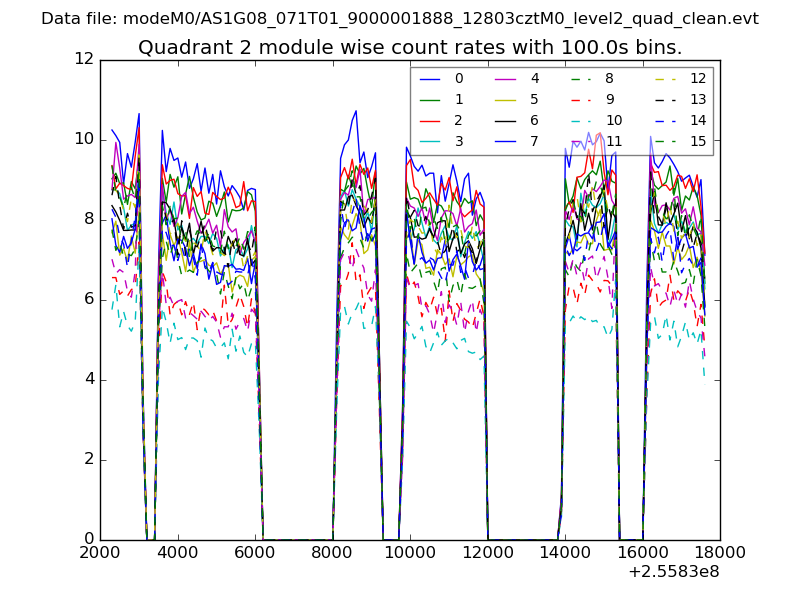
| Module-wise count rates for Quadrant B Data is divided into 100 sec bins |
 |
 |
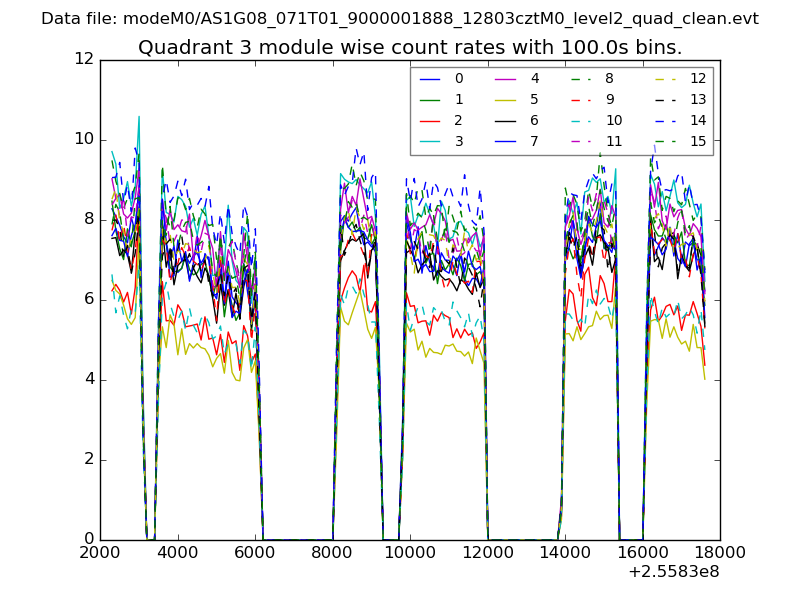
| Module-wise count rates for Quadrant C Data is divided into 100 sec bins |
 |
 |
| Module-wise count rates for Quadrant D Data is divided into 100 sec bins |
 |
 |
| Parameter | Plot |
|---|---|
| CZT HV Monitor | 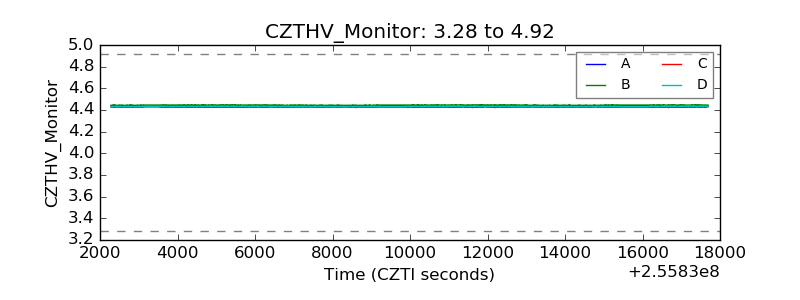 |
| D_VDD | 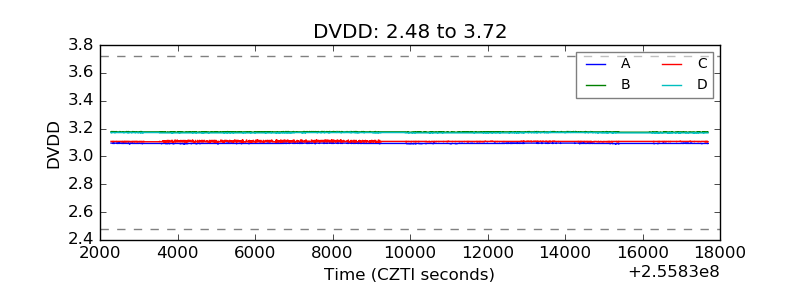 |
| Temperature 1 | 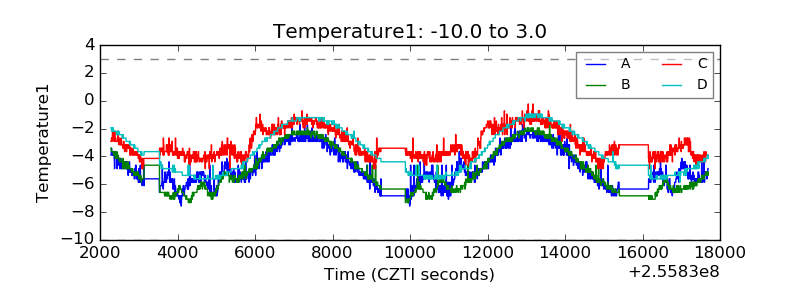 |
| Veto HV Monitor | 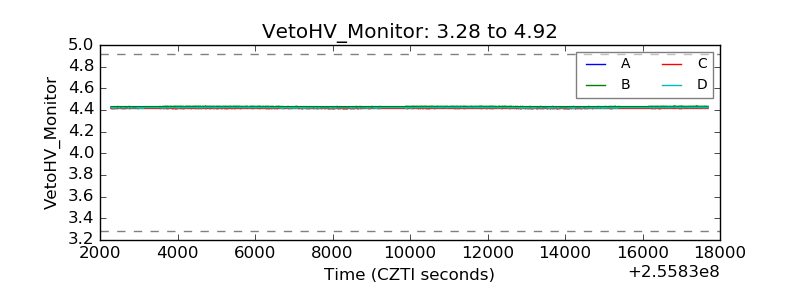 |
| Veto LLD | 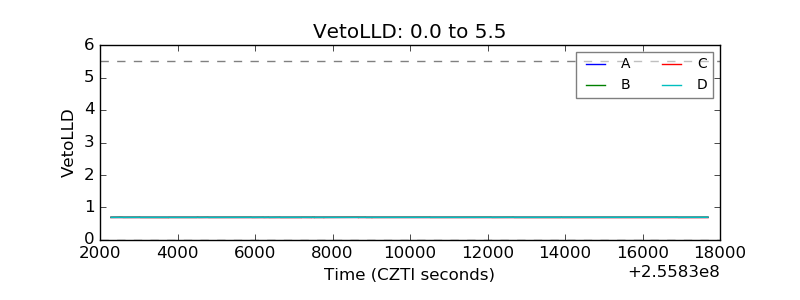 |
| Alpha Counter | 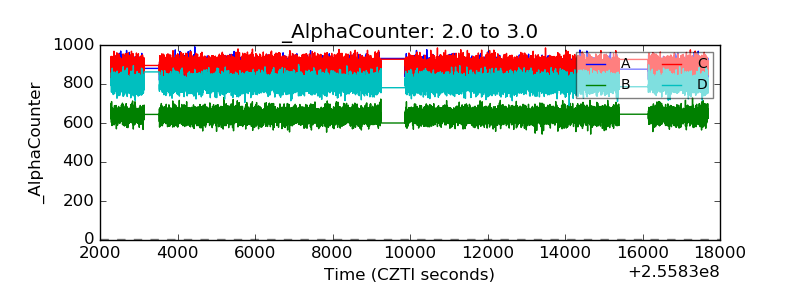 |
| _CPM_Rate | 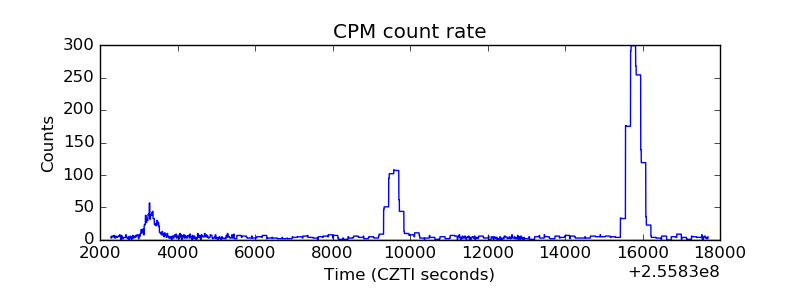 |
| CZT Counter |  |
| +2.5 Volts monitor |  |
| +5 Volts monitor |  |
| _ROLL_ROT | 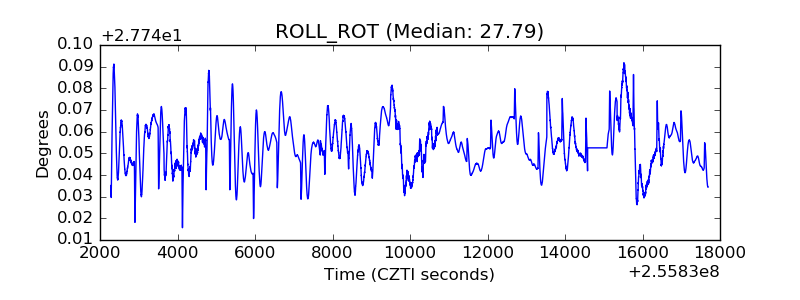 |
| _Roll_DEC | 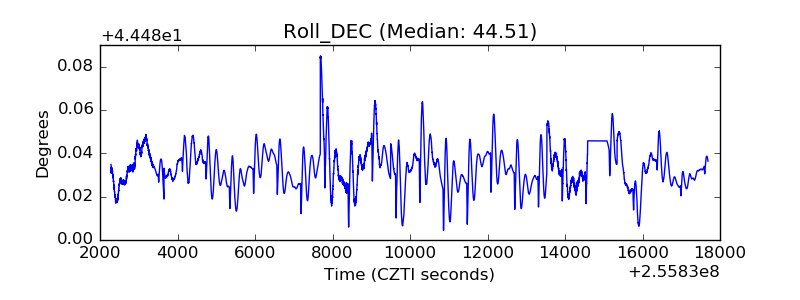 |
| _Roll_RA | 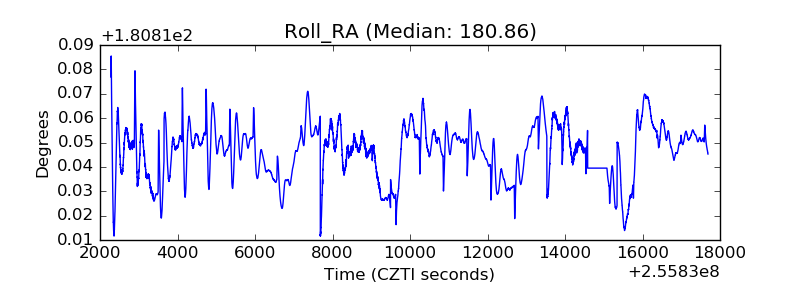 |
| Veto Counter | 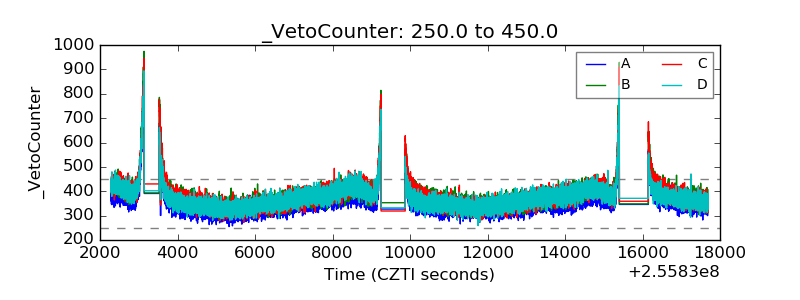 |