| Param | Original file | Final file |
|---|---|---|
| Filename | modeM0/AS1G08_071T01_9000001888_12804cztM0_level2.evt | modeM0/AS1G08_071T01_9000001888_12804cztM0_level2_quad_clean.evt |
| Size (bytes) | 465,848,640 | 86,892,480 |
| Size | 444.3 MB | 82.9 MB |
| Events in quadrant A | 3,298,792 | 548,998 |
| Events in quadrant B | 4,242,748 | 535,134 |
| Events in quadrant C | 2,906,938 | 554,031 |
| Events in quadrant D | 3,211,022 | 532,462 |
| Mode SS | |||
|---|---|---|---|
| Quadrant | BADHDUFLAG | Total packets | Discarded packets |
| A | 0 | 134 | 0 |
| B | 0 | 134 | 0 |
| C | 0 | 134 | 0 |
| D | 0 | 134 | 0 |
| Mode M9 | |||
|---|---|---|---|
| Quadrant | BADHDUFLAG | Total packets | Discarded packets |
| A | 0 | 9 | 0 |
| B | 0 | 9 | 0 |
| C | 0 | 9 | 0 |
| D | 0 | 9 | 0 |
| Mode M0 | |||
|---|---|---|---|
| Quadrant | BADHDUFLAG | Total packets | Discarded packets |
| A | 0 | 14119 | 2 |
| B | 0 | 16758 | 1 |
| C | 0 | 13318 | 1 |
| D | 0 | 14236 | 1 |
| Quadrant | Total seconds | Saturated seconds | Saturation percentage |
|---|---|---|---|
| A | 6605 | 56 | 0.847843% |
| B | 6605 | 362 | 5.480696% |
| C | 6605 | 24 | 0.363361% |
| D | 6605 | 87 | 1.317184% |
Noise dominated data is calculated using 1-second bins in cleaned event files. If a bin has >2000 counts, and if more than 50% of those come from <1% of pixels, then it is considered to be noise-dominated and hence unusable.
| Quadrant | # 1 sec bins | Bins with >0 counts | Bins with >2000 counts | High rate bins dominated by noise | Noise dominated (total time) | Noise dominated (detector-on time) | Marked lightcurve |
|---|---|---|---|---|---|---|---|
| A | 7526 | 6607 | 2 | 2 | 0.03% | 0.03% | 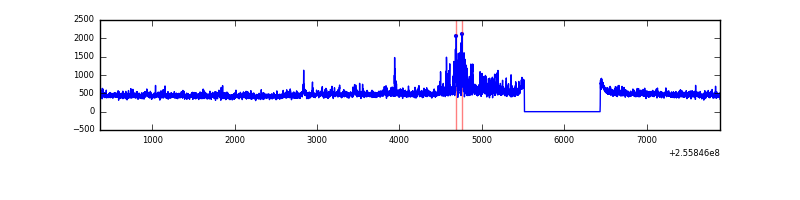 |
| B | 7526 | 6607 | 207 | 207 | 2.75% | 3.13% | 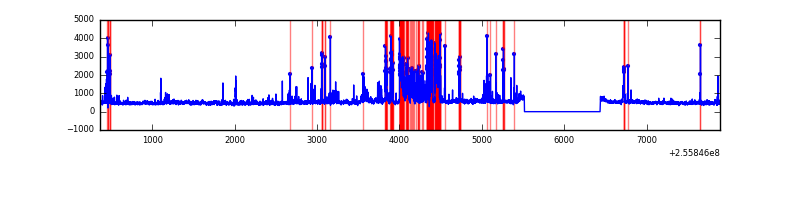 |
| C | 7526 | 6607 | 0 | 0 | 0.00% | 0.00% | 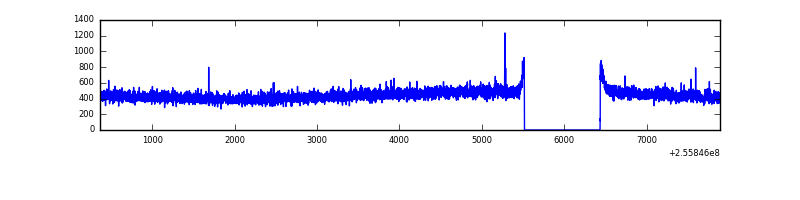 |
| D | 7526 | 6607 | 52 | 52 | 0.69% | 0.79% | 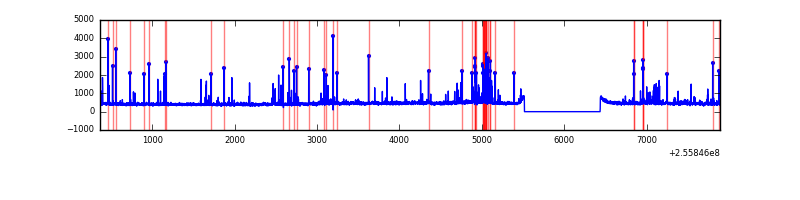 |
Top three noisy pixels from each quadrant. If the there are fewer than three noisy pixels in the level2.evt file, extra rows are filled as -1
| Pixel properties | Quadrant properties | ||||||
|---|---|---|---|---|---|---|---|
| Quadrant | DetID | PixID | Counts | Sigma | Mean | Median | Sigma |
| A | 8 | 15 | 200029 | 1259.77 | 771 | 755 | 158.2 |
| A | 12 | 189 | 120698 | 758.26 | 771 | 755 | 158.2 |
| A | 9 | 143 | 12587 | 74.8 | 771 | 755 | 158.2 |
| B | 4 | 239 | 831230 | 5825.42 | 748 | 730 | 142.6 |
| B | 0 | 219 | 254833 | 1782.36 | 748 | 730 | 142.6 |
| B | 10 | 245 | 182939 | 1278.07 | 748 | 730 | 142.6 |
| C | 13 | 61 | 5469 | 27.45 | 744 | 747 | 172.0 |
| C | 14 | 234 | 3572 | 16.42 | 744 | 747 | 172.0 |
| C | 3 | 202 | 1778 | 5.99 | 744 | 747 | 172.0 |
| D | 1 | 52 | 184411 | 1007.18 | 740 | 719 | 182.4 |
| D | 8 | 195 | 169252 | 924.06 | 740 | 719 | 182.4 |
| D | 13 | 172 | 28232 | 150.85 | 740 | 719 | 182.4 |
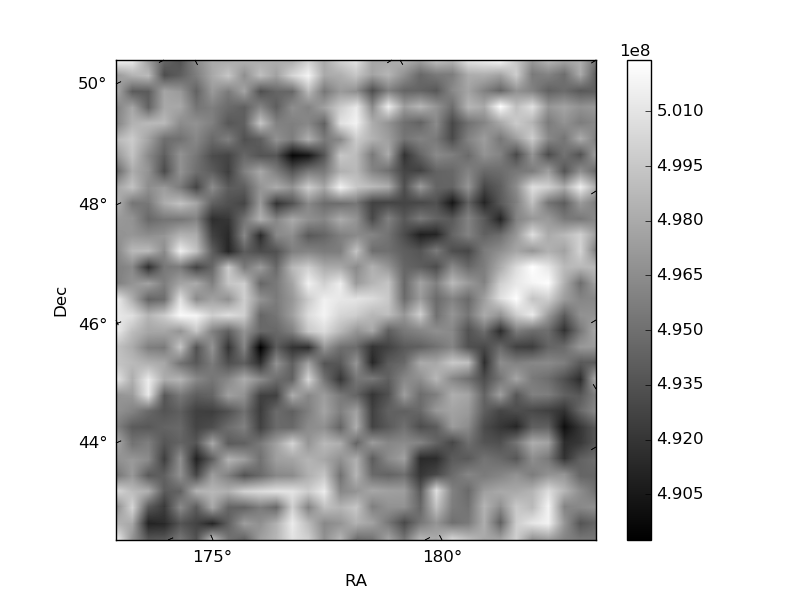
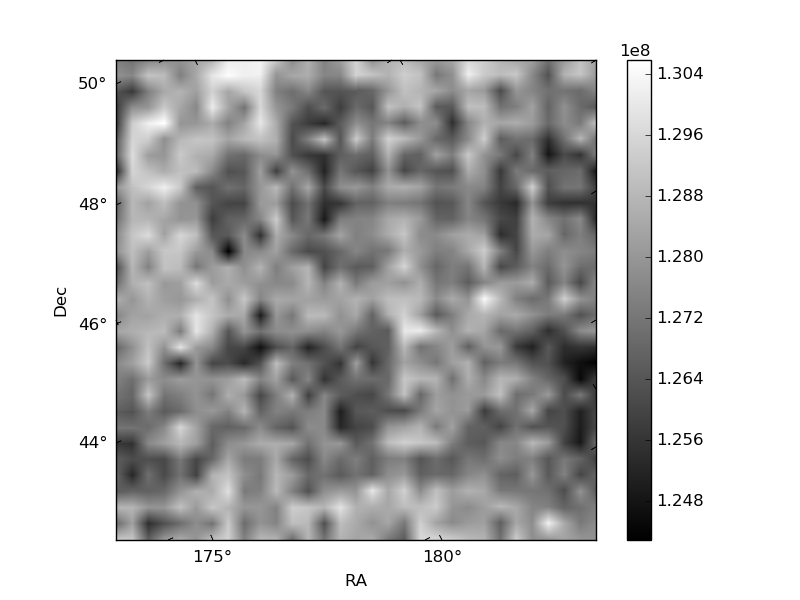
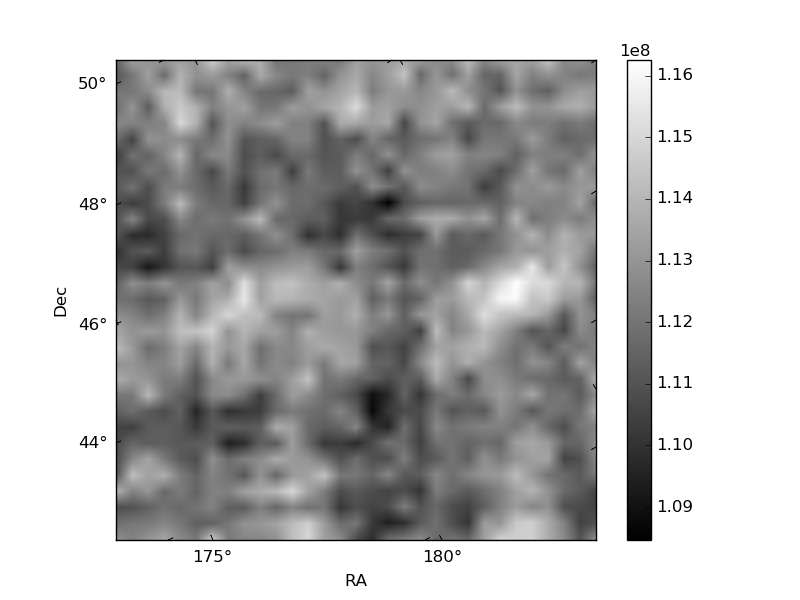
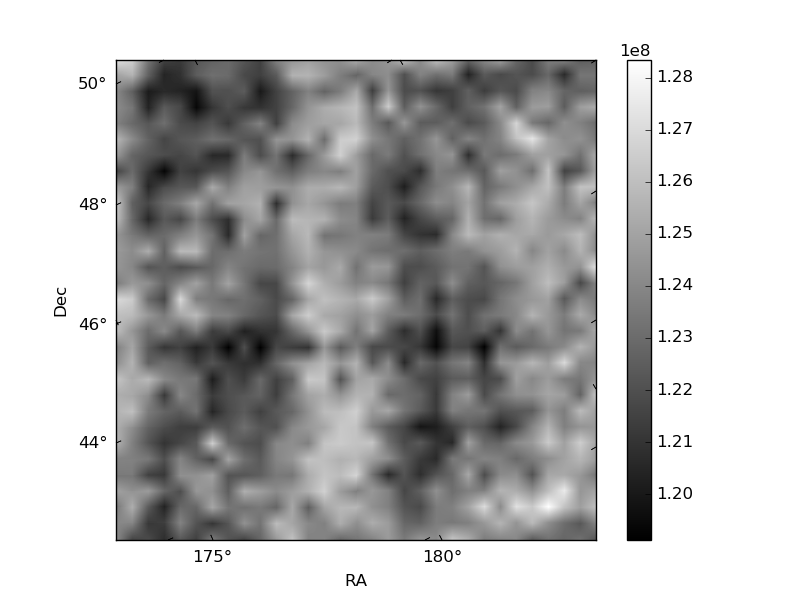
Histogram calculated using DETX and DETY for each event in the final _common_clean file
| Quadrant A | 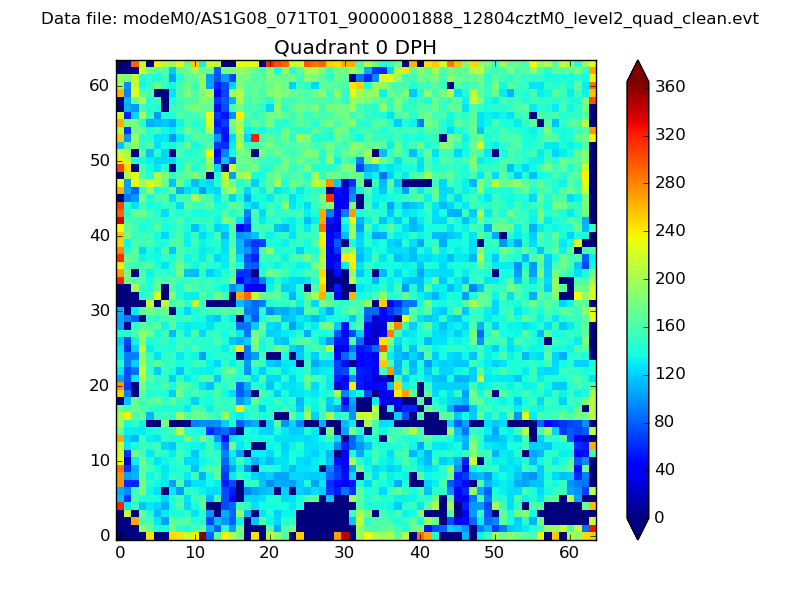 |
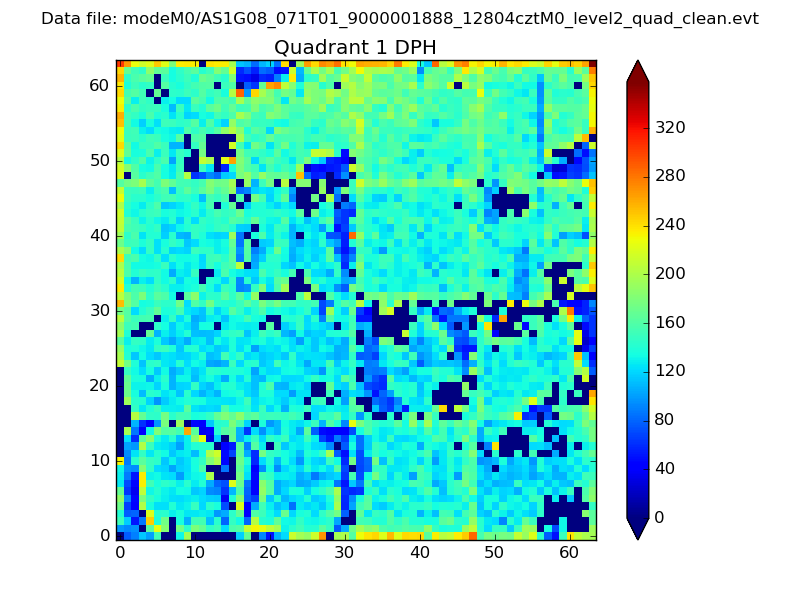 |
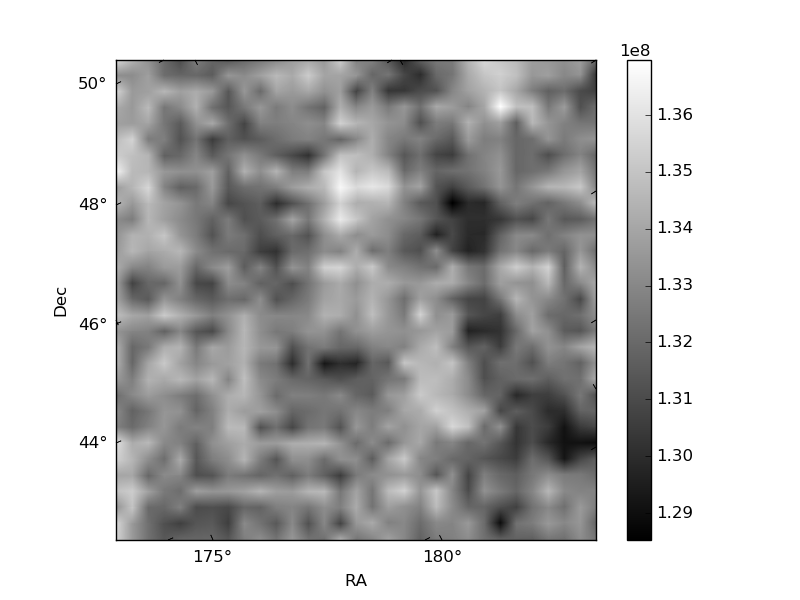
Quadrant B |
|---|---|---|---|
| Quadrant D | 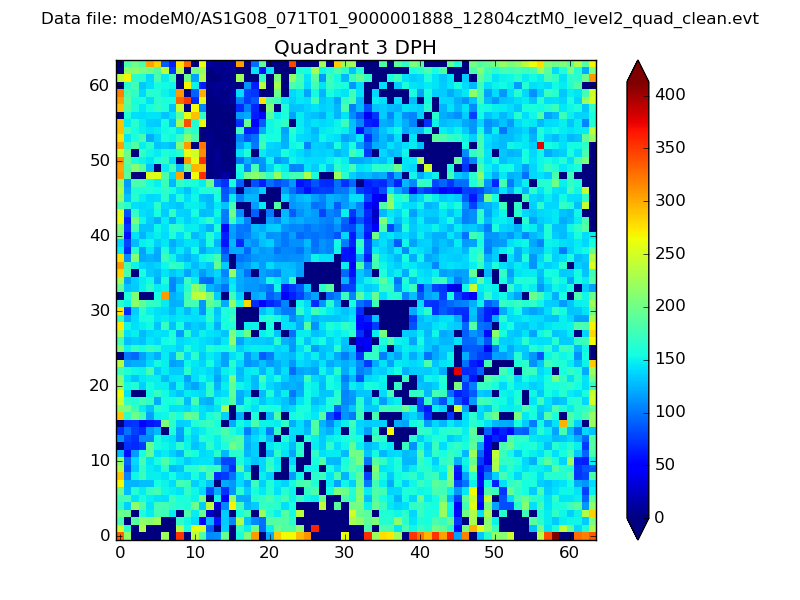 |
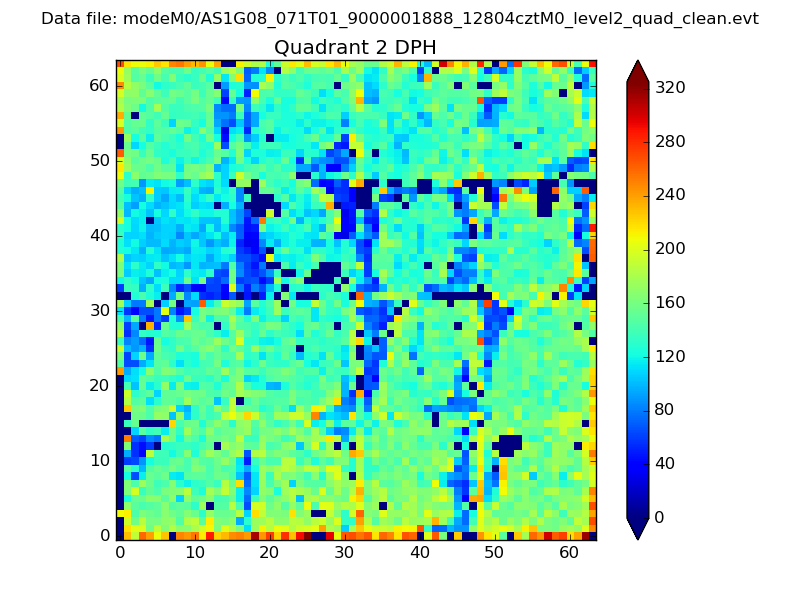 |
Quadrant C |
| Plot type | Count rate plots | Images |
|---|---|---|
| Comparison with Poisson distribution Blue bars denote a histogram of data divided into 1 sec bins. Red curve is a Poisson curve with rate = median count rate of data. |
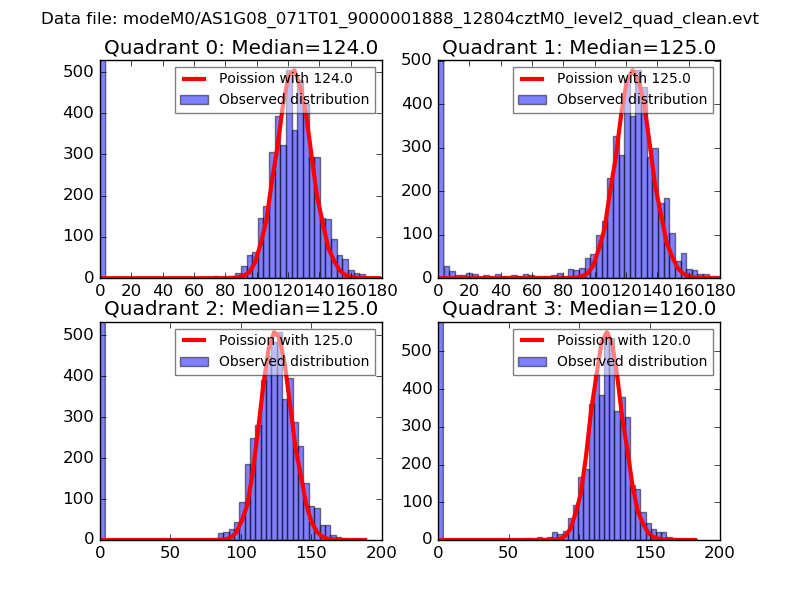 |
 |
| Quadrant-wise count rates Data is divided into 100 sec bins |
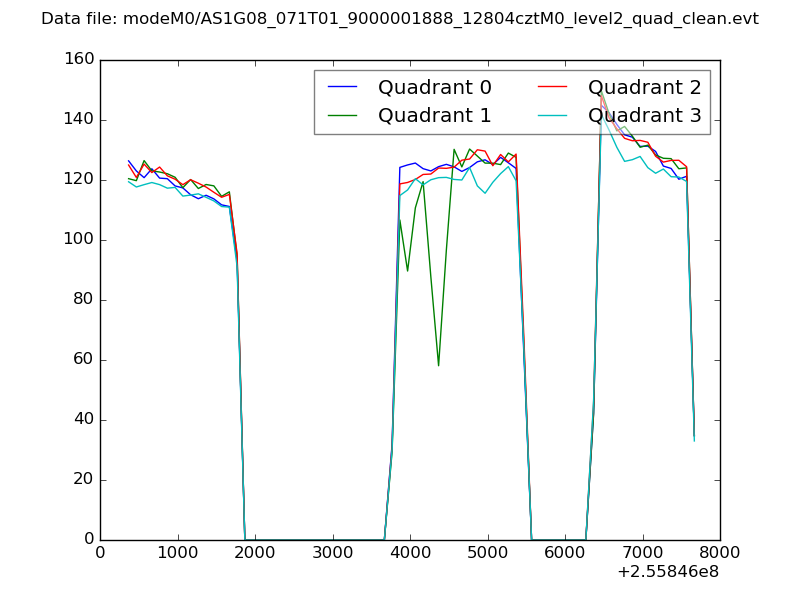 |
|
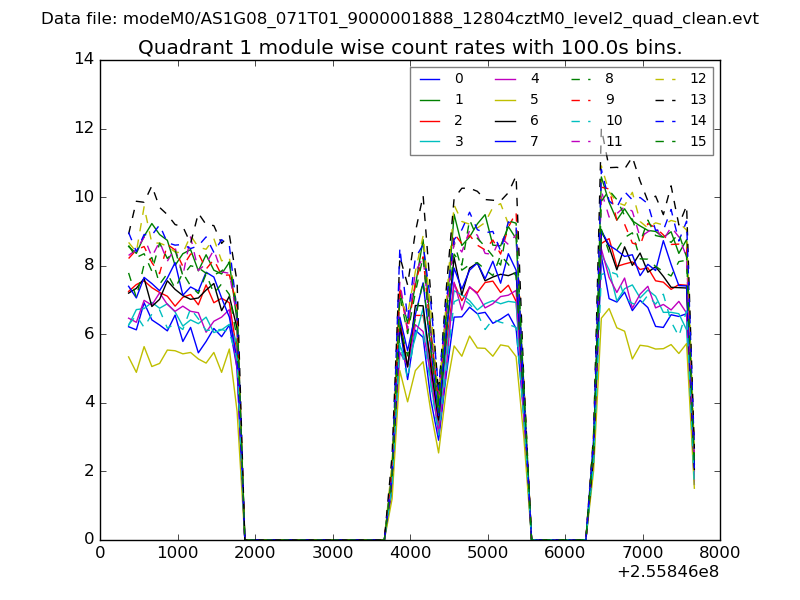
| Module-wise count rates for Quadrant A Data is divided into 100 sec bins |
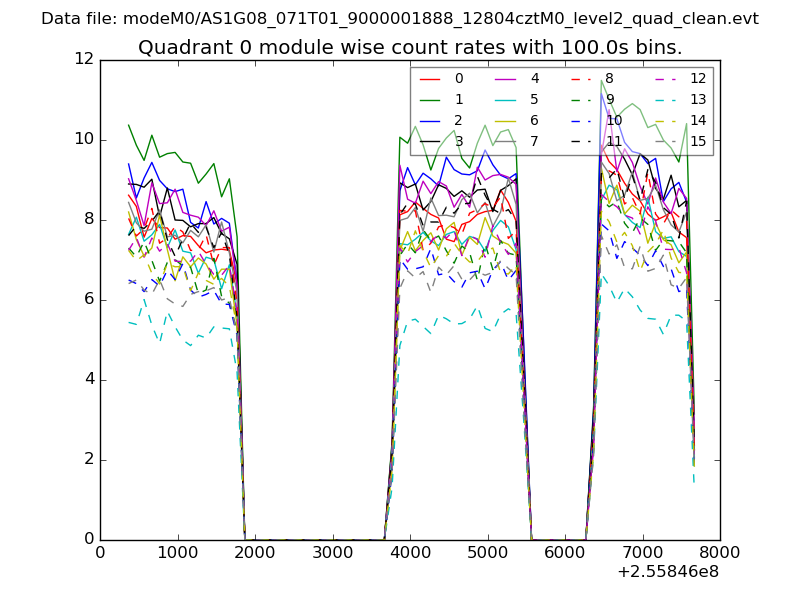 |
 |
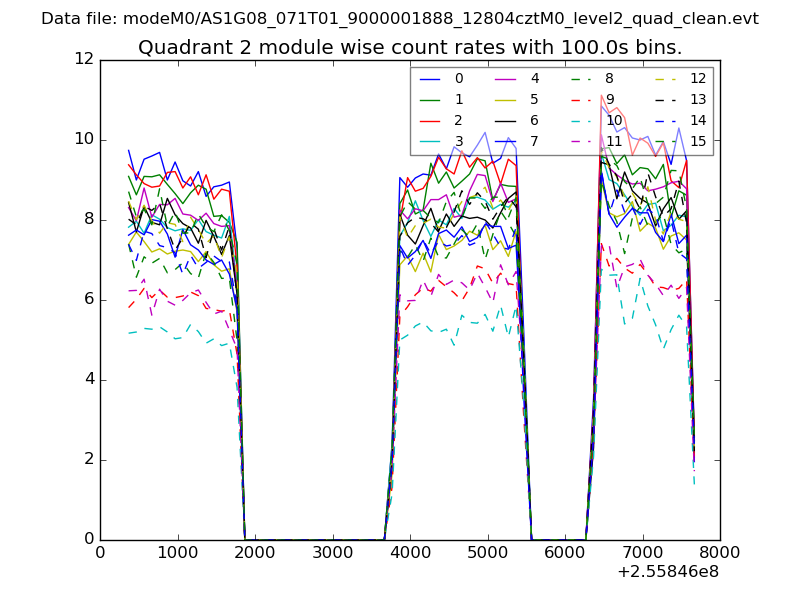
| Module-wise count rates for Quadrant B Data is divided into 100 sec bins |
 |
 |
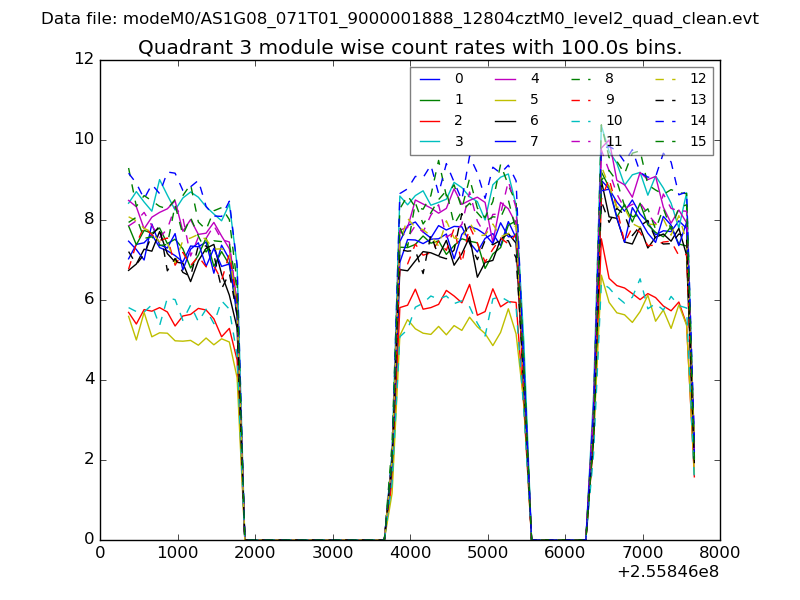
| Module-wise count rates for Quadrant C Data is divided into 100 sec bins |
 |
 |
| Module-wise count rates for Quadrant D Data is divided into 100 sec bins |
 |
 |
| Parameter | Plot |
|---|---|
| CZT HV Monitor | 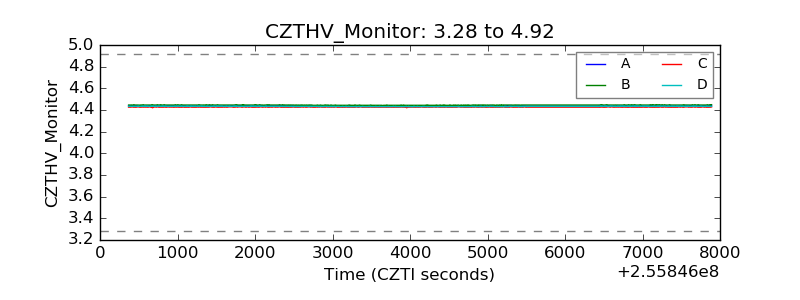 |
| D_VDD | 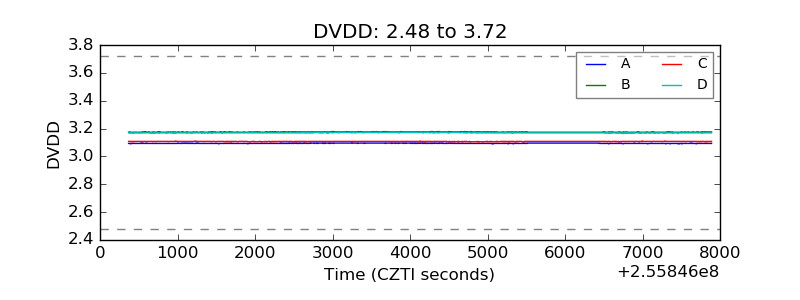 |
| Temperature 1 | 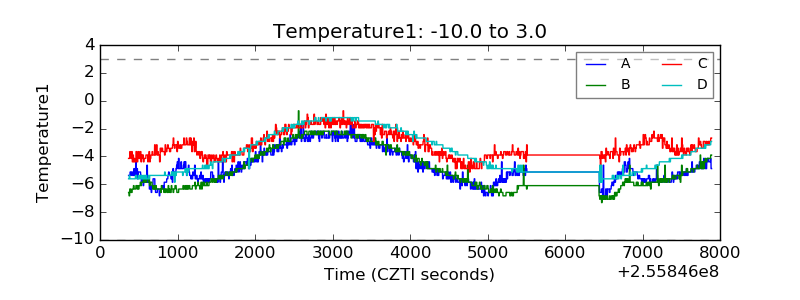 |
| Veto HV Monitor | 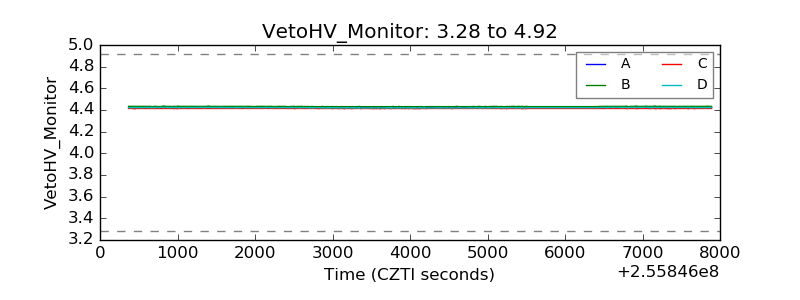 |
| Veto LLD | 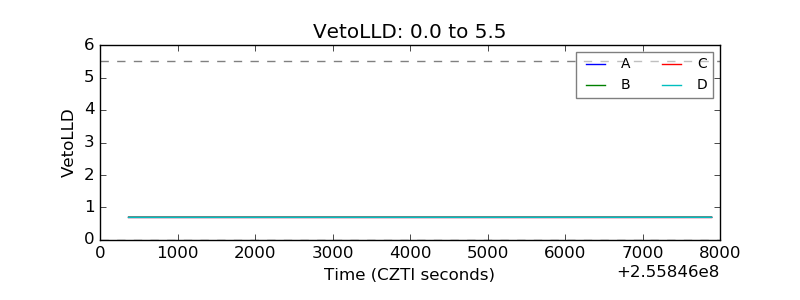 |
| Alpha Counter | 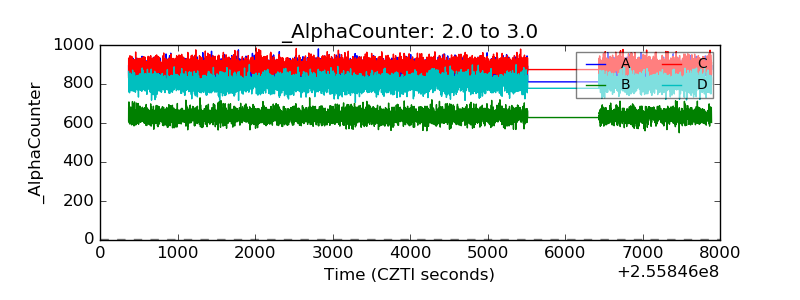 |
| _CPM_Rate | 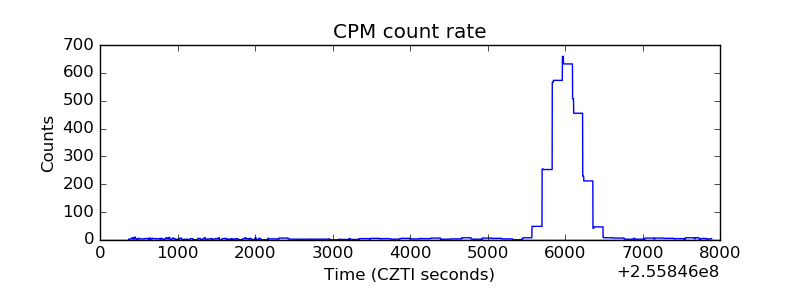 |
| CZT Counter | 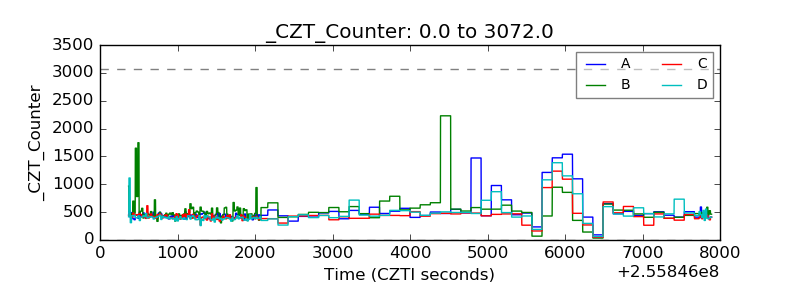 |
| +2.5 Volts monitor |  |
| +5 Volts monitor |  |
| _ROLL_ROT | 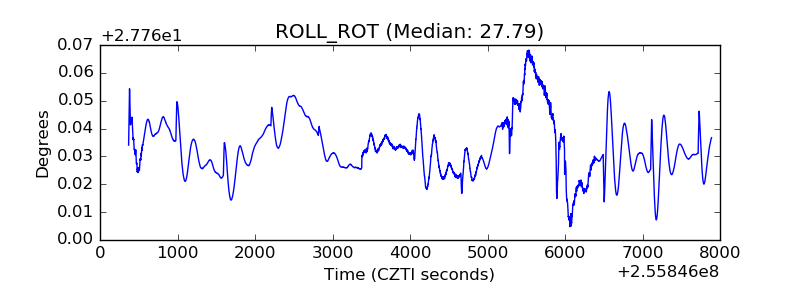 |
| _Roll_DEC | 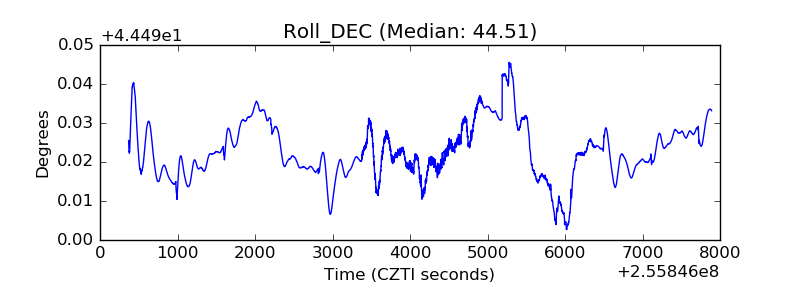 |
| _Roll_RA |  |
| Veto Counter | 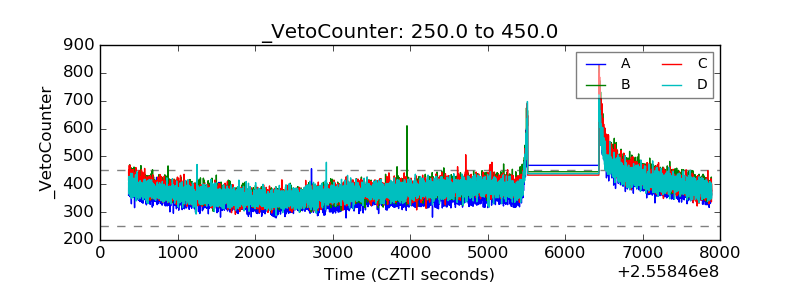 |