| Param | Original file | Final file |
|---|---|---|
| Filename | modeM0/AS1G08_071T01_9000001888_12807cztM0_level2.evt | modeM0/AS1G08_071T01_9000001888_12807cztM0_level2_quad_clean.evt |
| Size (bytes) | 493,084,800 | 78,462,720 |
| Size | 470.2 MB | 74.8 MB |
| Events in quadrant A | 3,422,838 | 486,458 |
| Events in quadrant B | 4,429,809 | 480,601 |
| Events in quadrant C | 3,153,340 | 482,736 |
| Events in quadrant D | 3,479,423 | 466,330 |
| Mode SS | |||
|---|---|---|---|
| Quadrant | BADHDUFLAG | Total packets | Discarded packets |
| A | 0 | 134 | 0 |
| B | 0 | 134 | 0 |
| C | 0 | 134 | 0 |
| D | 0 | 134 | 0 |
| Mode M9 | |||
|---|---|---|---|
| Quadrant | BADHDUFLAG | Total packets | Discarded packets |
| A | 0 | 15 | 0 |
| B | 0 | 15 | 0 |
| C | 0 | 15 | 0 |
| D | 0 | 16 | 0 |
| Mode M0 | |||
|---|---|---|---|
| Quadrant | BADHDUFLAG | Total packets | Discarded packets |
| A | 0 | 14129 | 3 |
| B | 0 | 17396 | 2 |
| C | 0 | 13600 | 2 |
| D | 0 | 14529 | 2 |
| Quadrant | Total seconds | Saturated seconds | Saturation percentage |
|---|---|---|---|
| A | 6592 | 53 | 0.804005% |
| B | 6592 | 319 | 4.839199% |
| C | 6592 | 34 | 0.515777% |
| D | 6592 | 93 | 1.410801% |
Noise dominated data is calculated using 1-second bins in cleaned event files. If a bin has >2000 counts, and if more than 50% of those come from <1% of pixels, then it is considered to be noise-dominated and hence unusable.
| Quadrant | # 1 sec bins | Bins with >0 counts | Bins with >2000 counts | High rate bins dominated by noise | Noise dominated (total time) | Noise dominated (detector-on time) | Marked lightcurve |
|---|---|---|---|---|---|---|---|
| A | 7773 | 6594 | 0 | 0 | 0.00% | 0.00% | 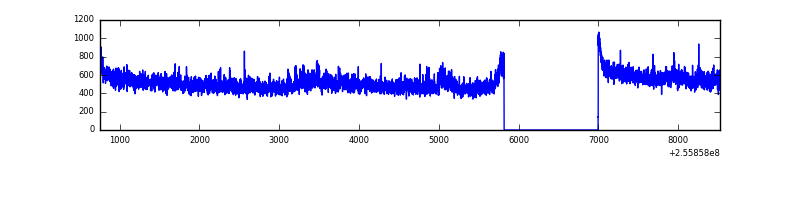 |
| B | 7773 | 6594 | 182 | 182 | 2.34% | 2.76% | 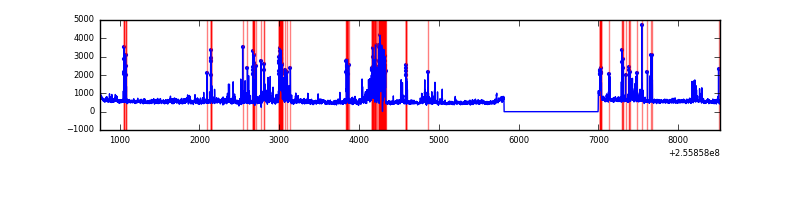 |
| C | 7773 | 6594 | 1 | 1 | 0.01% | 0.02% | 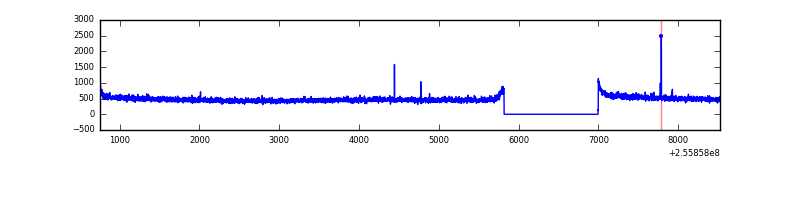 |
| D | 7773 | 6594 | 62 | 62 | 0.80% | 0.94% | 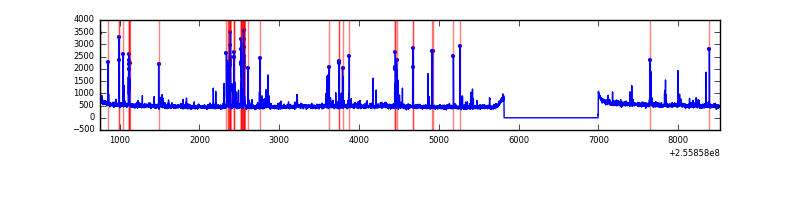 |
Top three noisy pixels from each quadrant. If the there are fewer than three noisy pixels in the level2.evt file, extra rows are filled as -1
| Pixel properties | Quadrant properties | ||||||
|---|---|---|---|---|---|---|---|
| Quadrant | DetID | PixID | Counts | Sigma | Mean | Median | Sigma |
| A | 12 | 189 | 153889 | 899.75 | 846 | 828 | 170.1 |
| A | 8 | 15 | 15798 | 88.0 | 846 | 828 | 170.1 |
| A | 0 | 226 | 7581 | 39.69 | 846 | 828 | 170.1 |
| B | 4 | 239 | 651436 | 4215.12 | 822 | 802 | 154.4 |
| B | 0 | 219 | 256165 | 1654.36 | 822 | 802 | 154.4 |
| B | 10 | 245 | 230683 | 1489.28 | 822 | 802 | 154.4 |
| C | 14 | 234 | 8160 | 39.79 | 806 | 811 | 184.7 |
| C | 13 | 61 | 5898 | 27.55 | 806 | 811 | 184.7 |
| C | 3 | 202 | 2026 | 6.58 | 806 | 811 | 184.7 |
| D | 1 | 52 | 145158 | 745.95 | 810 | 790 | 193.5 |
| D | 10 | 253 | 118297 | 607.16 | 810 | 790 | 193.5 |
| D | 8 | 195 | 82202 | 420.66 | 810 | 790 | 193.5 |
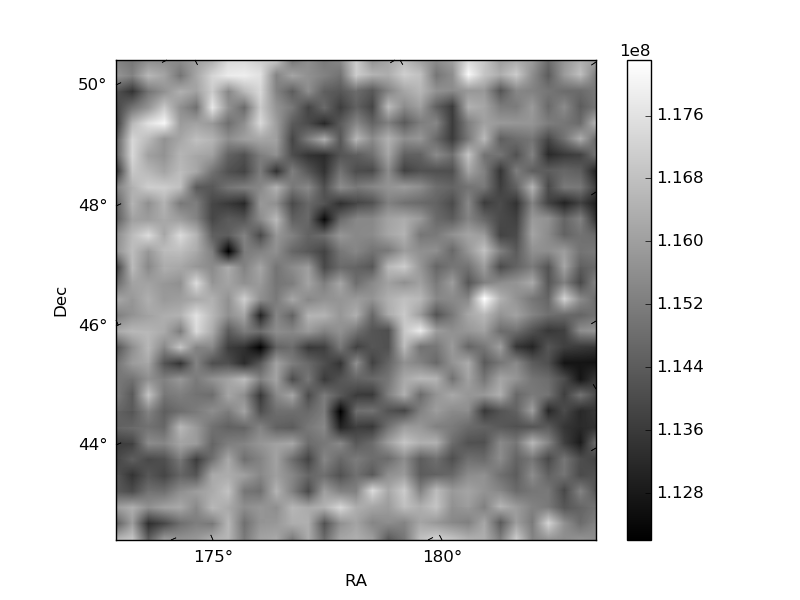
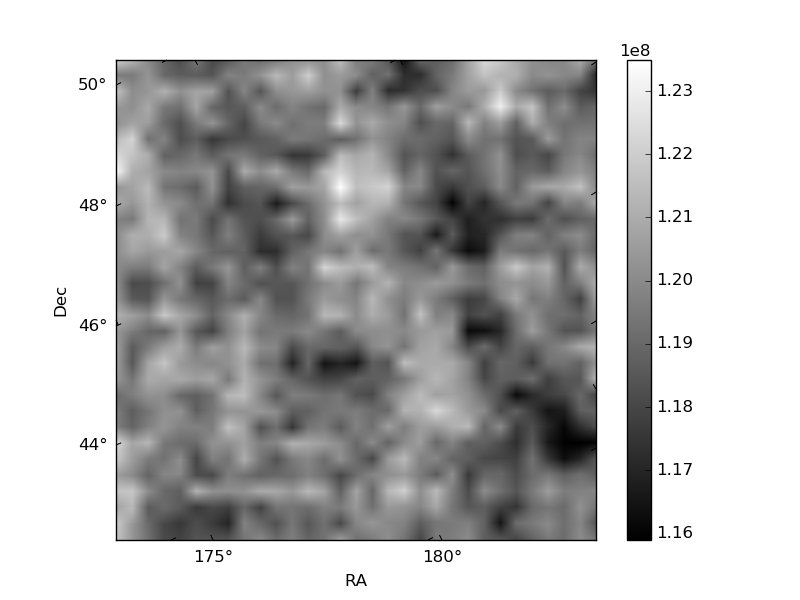
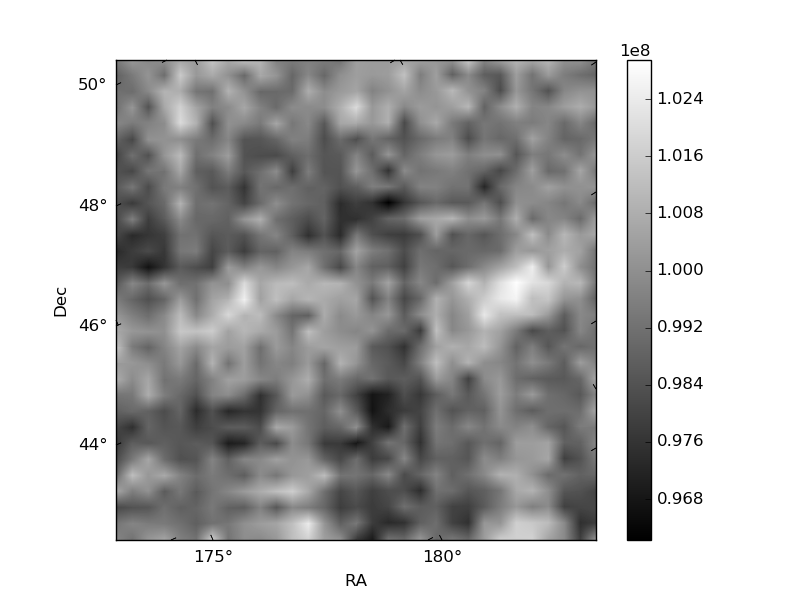
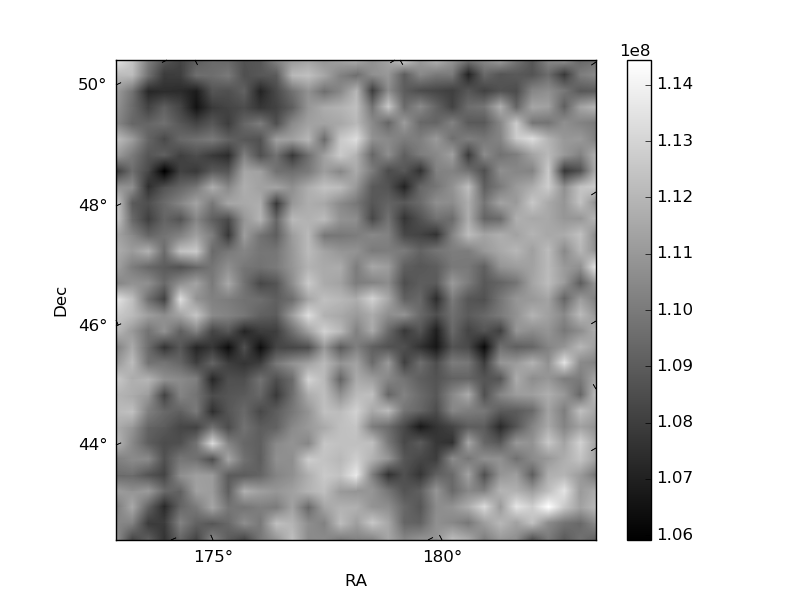
Histogram calculated using DETX and DETY for each event in the final _common_clean file
| Quadrant A | 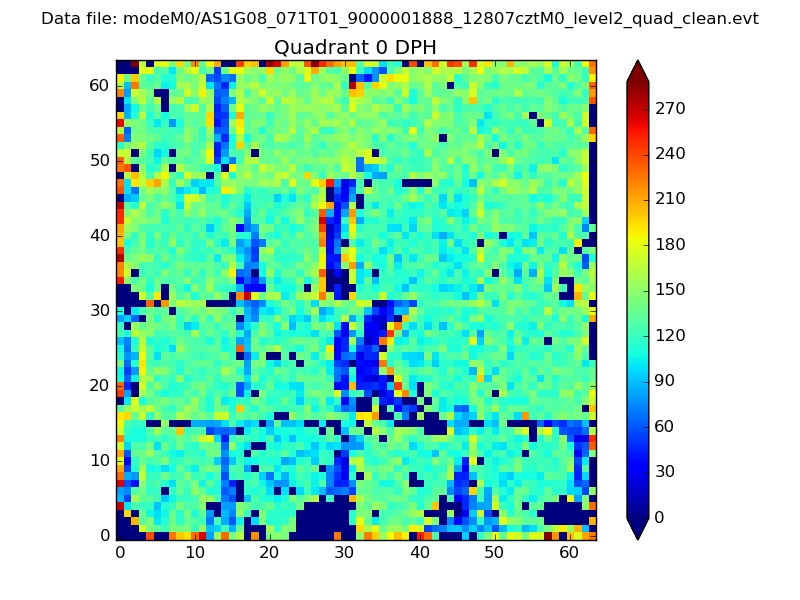 |
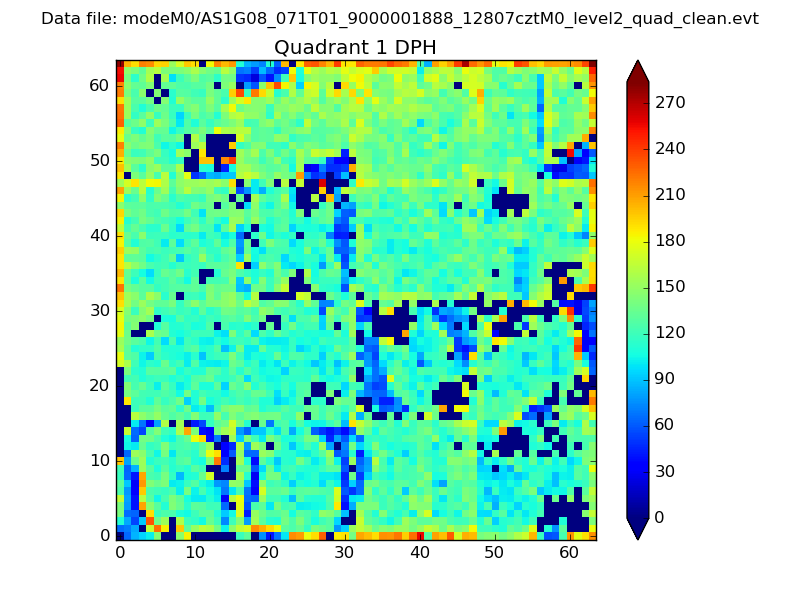 |
Quadrant B |
|---|---|---|---|
| Quadrant D | 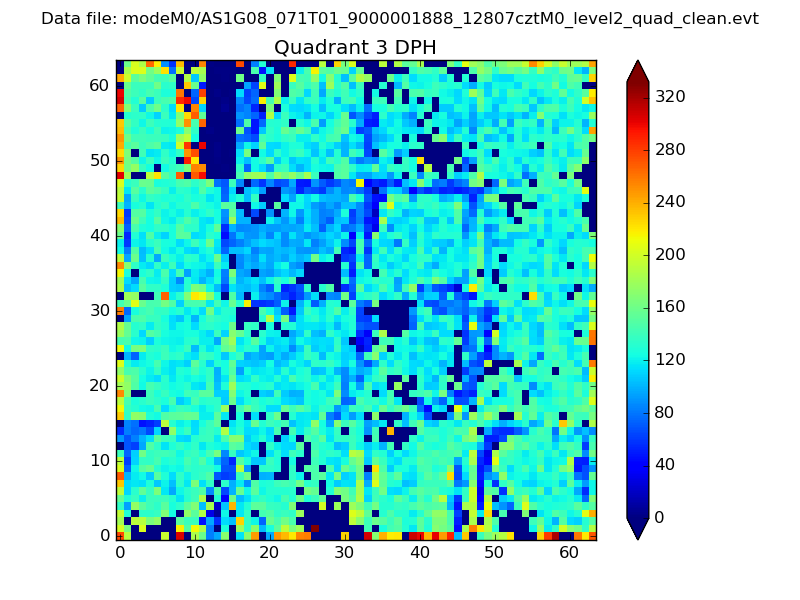 |
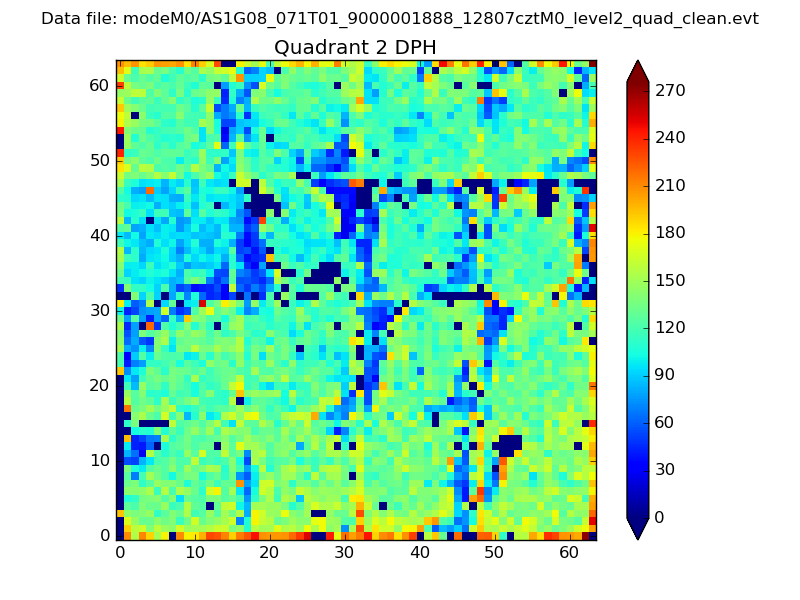 |
Quadrant C |
| Plot type | Count rate plots | Images |
|---|---|---|
| Comparison with Poisson distribution Blue bars denote a histogram of data divided into 1 sec bins. Red curve is a Poisson curve with rate = median count rate of data. |
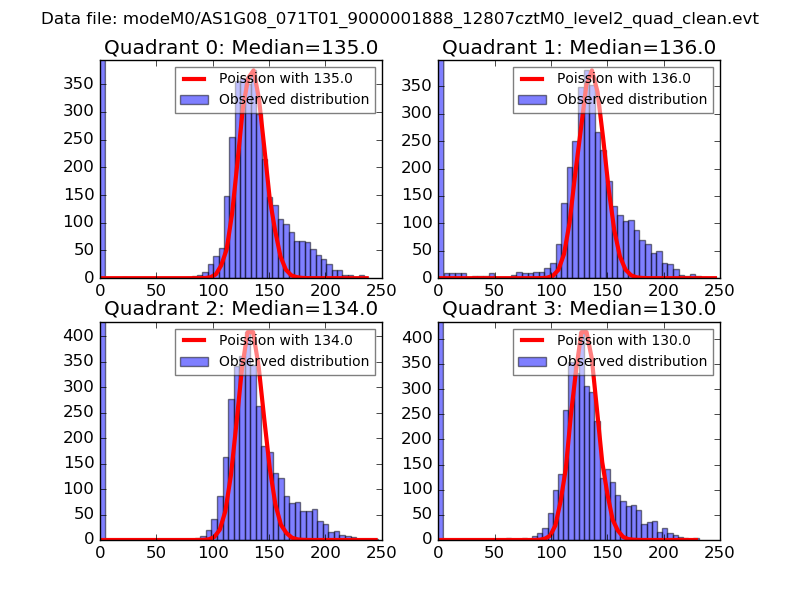 |
 |
| Quadrant-wise count rates Data is divided into 100 sec bins |
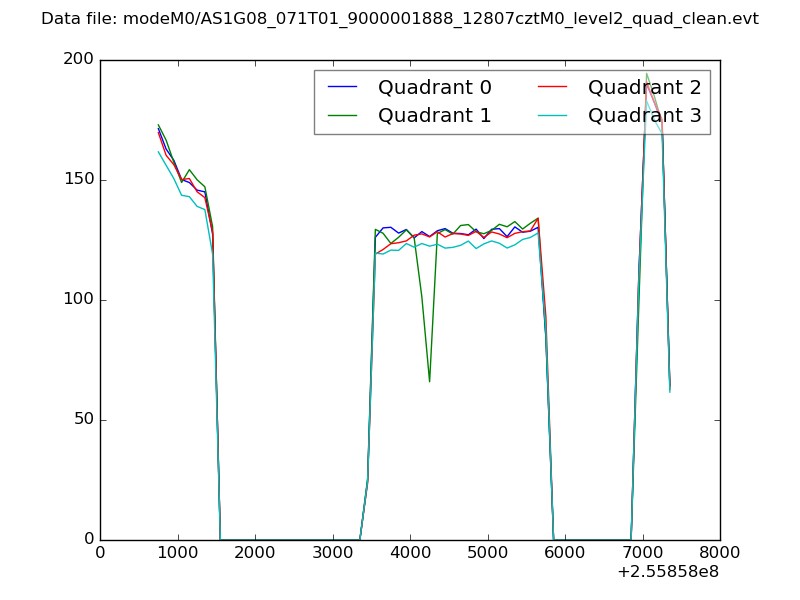 |
|
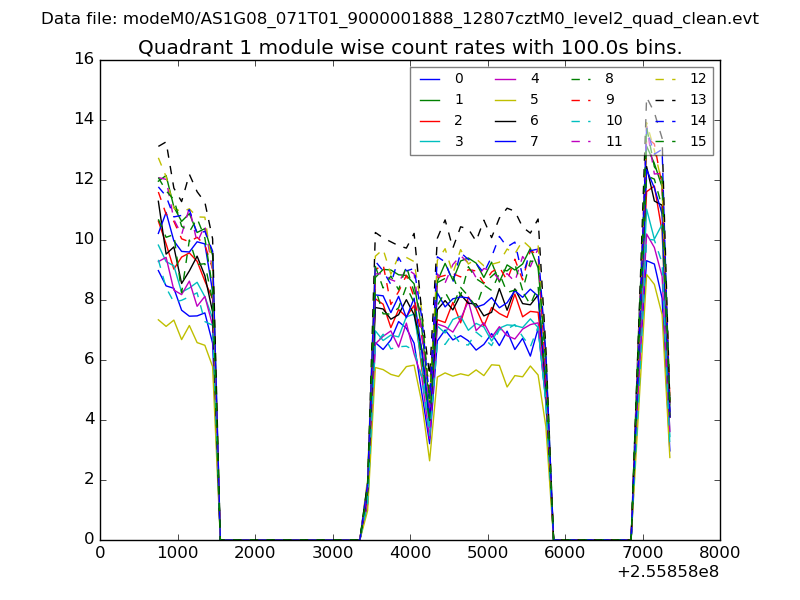
| Module-wise count rates for Quadrant A Data is divided into 100 sec bins |
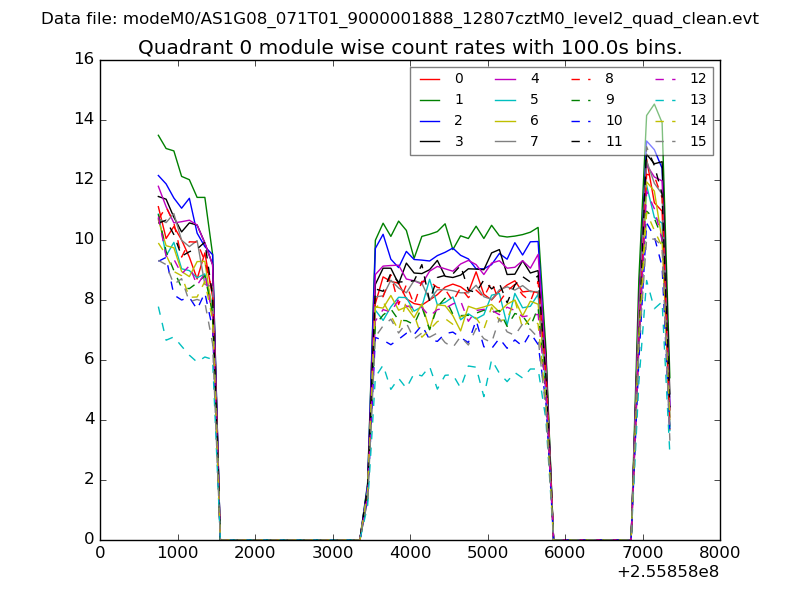 |
 |
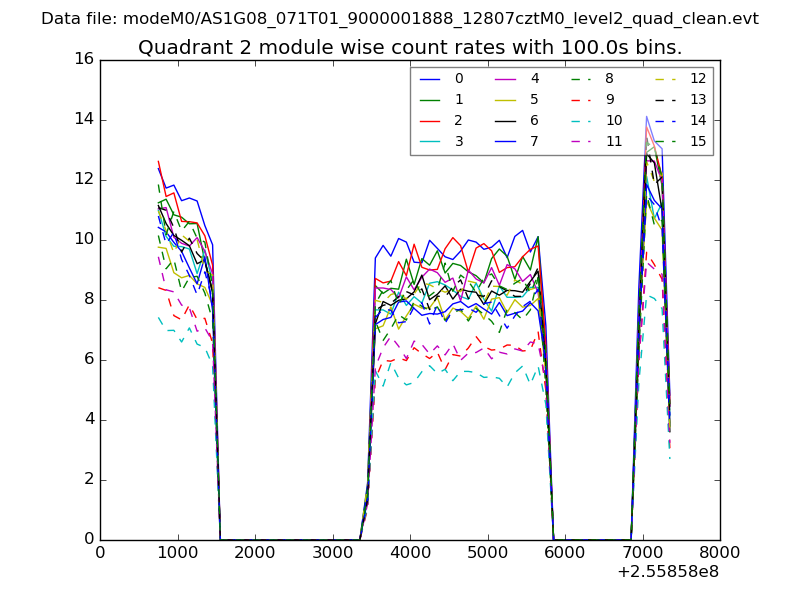
| Module-wise count rates for Quadrant B Data is divided into 100 sec bins |
 |
 |
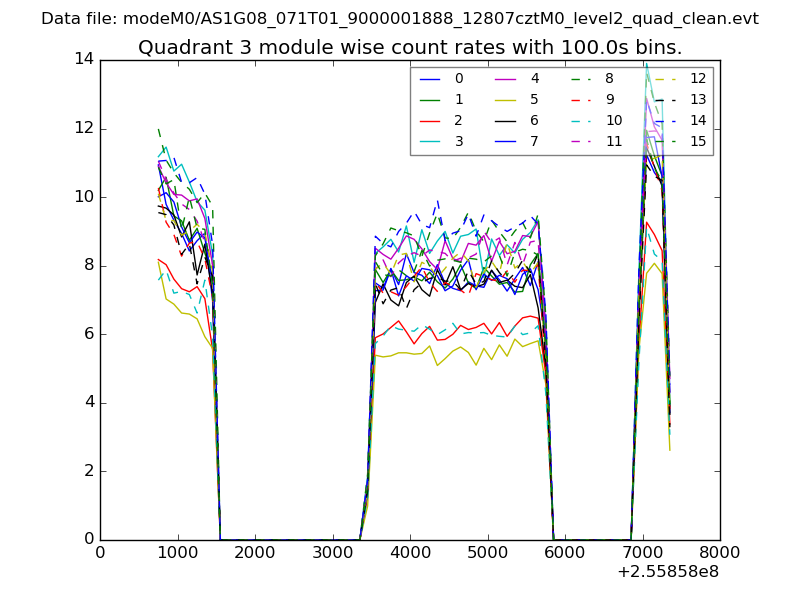
| Module-wise count rates for Quadrant C Data is divided into 100 sec bins |
 |
 |
| Module-wise count rates for Quadrant D Data is divided into 100 sec bins |
 |
 |
| Parameter | Plot |
|---|---|
| CZT HV Monitor | 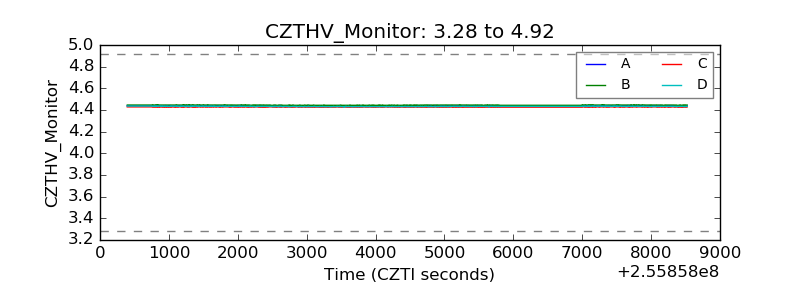 |
| D_VDD | 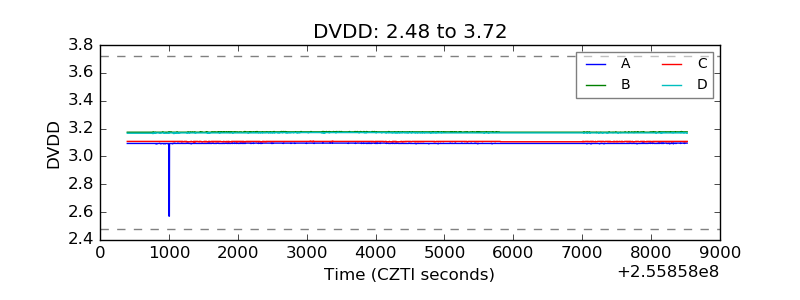 |
| Temperature 1 | 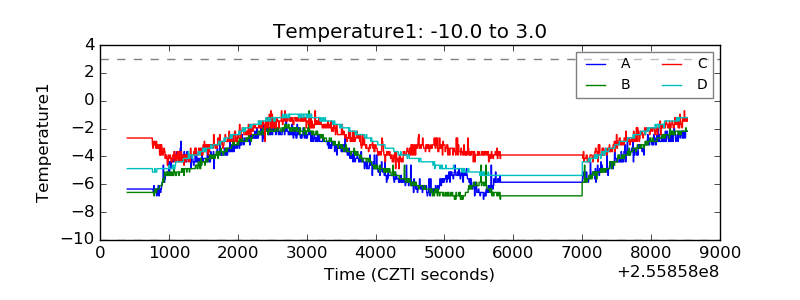 |
| Veto HV Monitor | 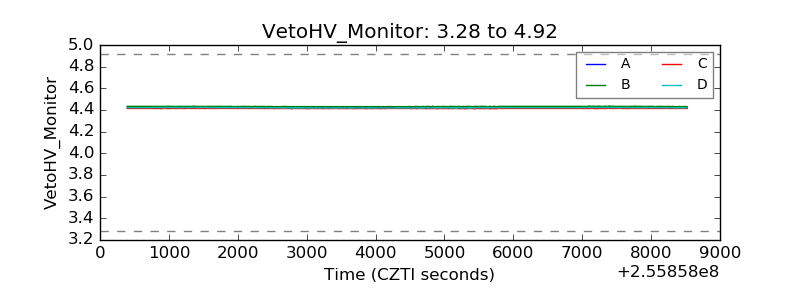 |
| Veto LLD | 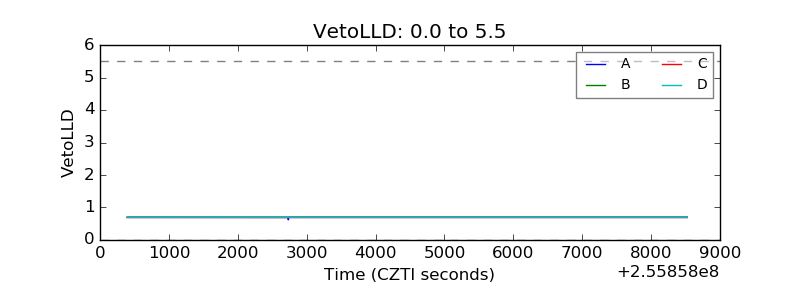 |
| Alpha Counter | 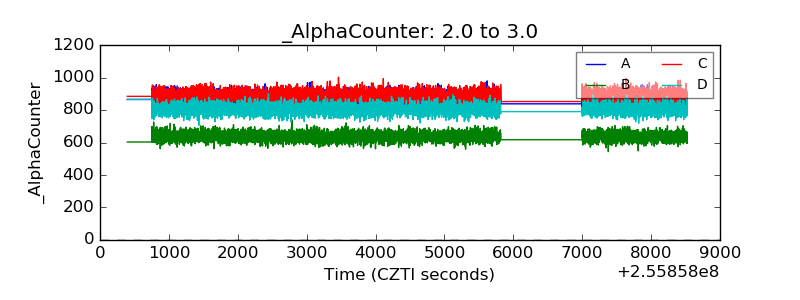 |
| _CPM_Rate | 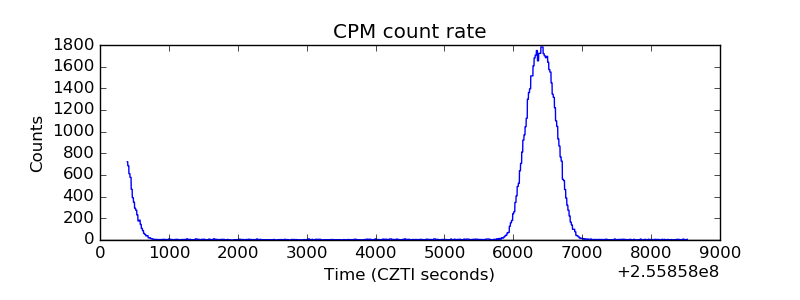 |
| CZT Counter | 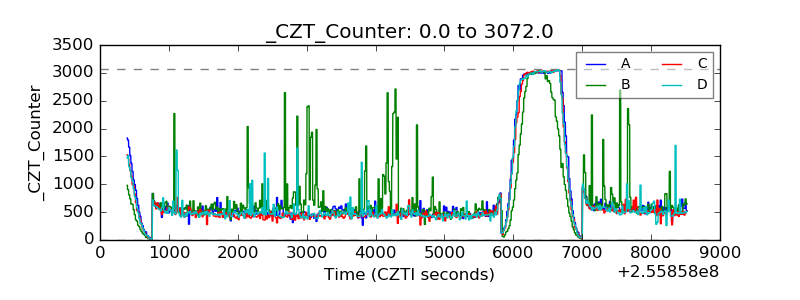 |
| +2.5 Volts monitor | 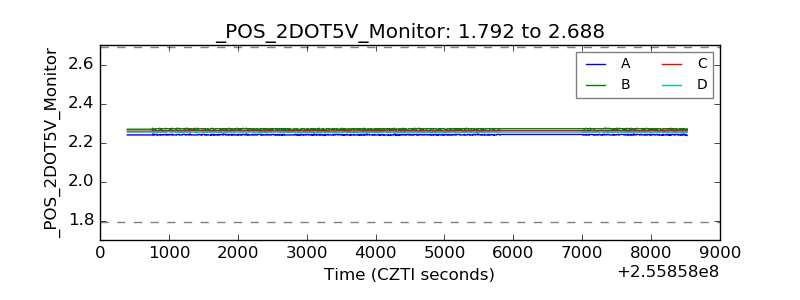 |
| +5 Volts monitor |  |
| _ROLL_ROT | 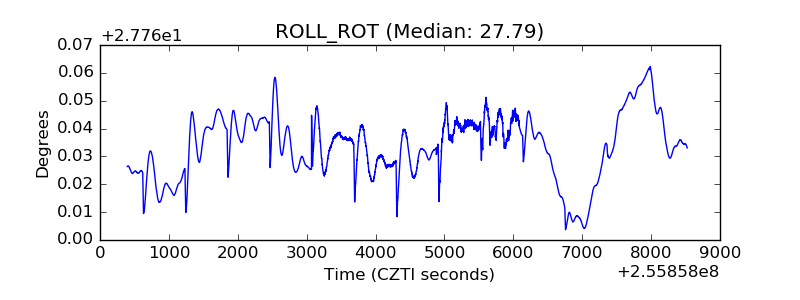 |
| _Roll_DEC | 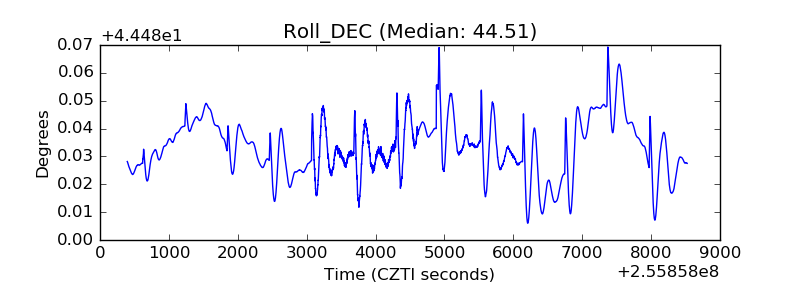 |
| _Roll_RA |  |
| Veto Counter | 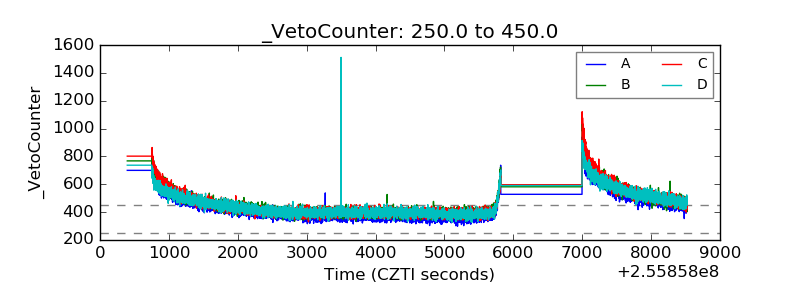 |