| Param | Original file | Final file |
|---|---|---|
| Filename | modeM0/AS1G08_071T01_9000001888_12808cztM0_level2.evt | modeM0/AS1G08_071T01_9000001888_12808cztM0_level2_quad_clean.evt |
| Size (bytes) | 502,922,880 | 70,061,760 |
| Size | 479.6 MB | 66.8 MB |
| Events in quadrant A | 3,490,443 | 422,921 |
| Events in quadrant B | 4,488,437 | 419,183 |
| Events in quadrant C | 3,263,009 | 421,136 |
| Events in quadrant D | 3,550,381 | 406,900 |
| Mode SS | |||
|---|---|---|---|
| Quadrant | BADHDUFLAG | Total packets | Discarded packets |
| A | 0 | 132 | 0 |
| B | 0 | 132 | 0 |
| C | 0 | 132 | 0 |
| D | 0 | 132 | 0 |
| Mode M9 | |||
|---|---|---|---|
| Quadrant | BADHDUFLAG | Total packets | Discarded packets |
| A | 0 | 13 | 0 |
| B | 0 | 13 | 0 |
| C | 0 | 13 | 0 |
| D | 0 | 14 | 0 |
| Mode M0 | |||
|---|---|---|---|
| Quadrant | BADHDUFLAG | Total packets | Discarded packets |
| A | 0 | 14399 | 3 |
| B | 0 | 17656 | 2 |
| C | 0 | 13712 | 2 |
| D | 0 | 14634 | 2 |
| Quadrant | Total seconds | Saturated seconds | Saturation percentage |
|---|---|---|---|
| A | 6465 | 97 | 1.500387% |
| B | 6465 | 348 | 5.382831% |
| C | 6465 | 73 | 1.129157% |
| D | 6465 | 113 | 1.747873% |
Noise dominated data is calculated using 1-second bins in cleaned event files. If a bin has >2000 counts, and if more than 50% of those come from <1% of pixels, then it is considered to be noise-dominated and hence unusable.
| Quadrant | # 1 sec bins | Bins with >0 counts | Bins with >2000 counts | High rate bins dominated by noise | Noise dominated (total time) | Noise dominated (detector-on time) | Marked lightcurve |
|---|---|---|---|---|---|---|---|
| A | 7711 | 6466 | 0 | 0 | 0.00% | 0.00% | 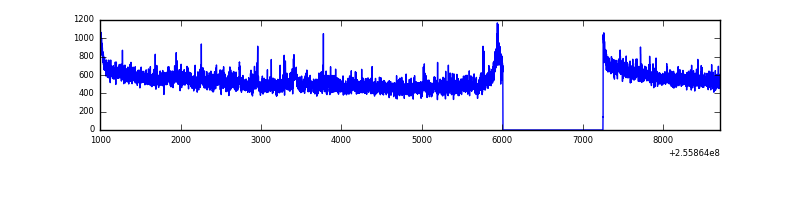 |
| B | 7711 | 6466 | 152 | 152 | 1.97% | 2.35% | 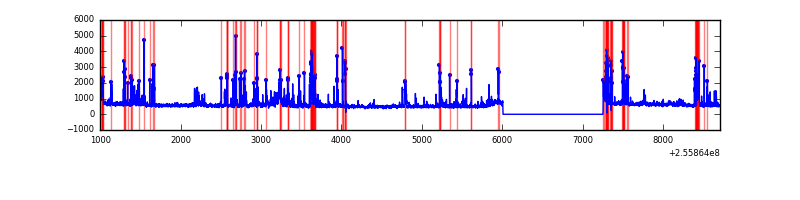 |
| C | 7711 | 6466 | 1 | 1 | 0.01% | 0.02% | 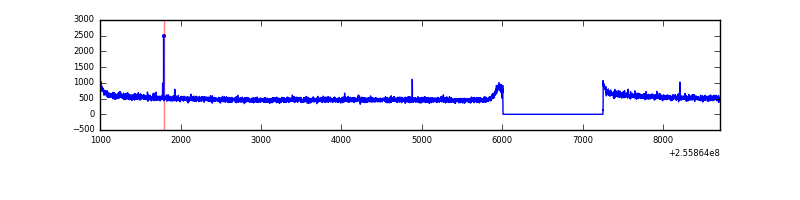 |
| D | 7711 | 6466 | 34 | 34 | 0.44% | 0.53% | 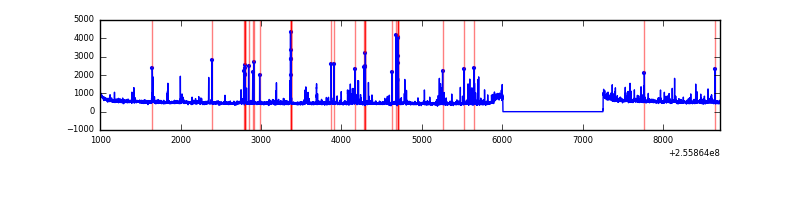 |
Top three noisy pixels from each quadrant. If the there are fewer than three noisy pixels in the level2.evt file, extra rows are filled as -1
| Pixel properties | Quadrant properties | ||||||
|---|---|---|---|---|---|---|---|
| Quadrant | DetID | PixID | Counts | Sigma | Mean | Median | Sigma |
| A | 12 | 189 | 123974 | 712.46 | 870 | 855 | 172.8 |
| A | 8 | 15 | 20384 | 113.01 | 870 | 855 | 172.8 |
| A | 0 | 226 | 7755 | 39.93 | 870 | 855 | 172.8 |
| B | 4 | 239 | 691292 | 4393.35 | 844 | 825 | 157.2 |
| B | 10 | 245 | 278485 | 1766.71 | 844 | 825 | 157.2 |
| B | 0 | 219 | 164279 | 1040.04 | 844 | 825 | 157.2 |
| C | 14 | 234 | 6469 | 29.47 | 835 | 842 | 190.9 |
| C | 13 | 61 | 6091 | 27.49 | 835 | 842 | 190.9 |
| C | 12 | 4 | 2792 | 10.21 | 835 | 842 | 190.9 |
| D | 1 | 52 | 228840 | 1069.45 | 834 | 818 | 213.2 |
| D | 8 | 195 | 104025 | 484.05 | 834 | 818 | 213.2 |
| D | 2 | 234 | 23928 | 108.39 | 834 | 818 | 213.2 |
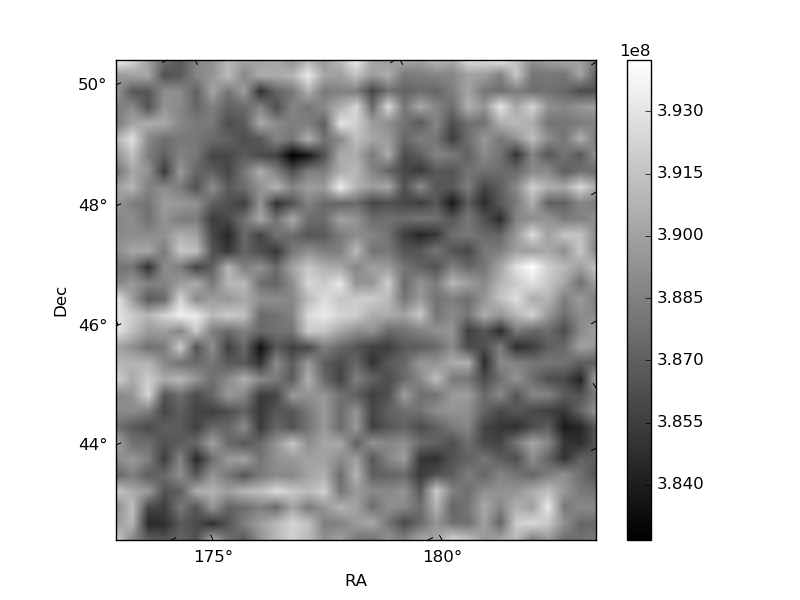
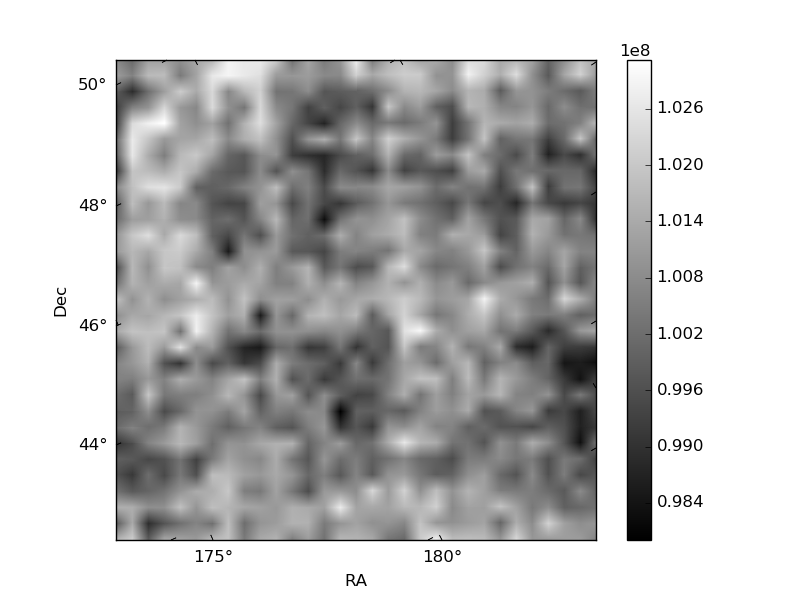
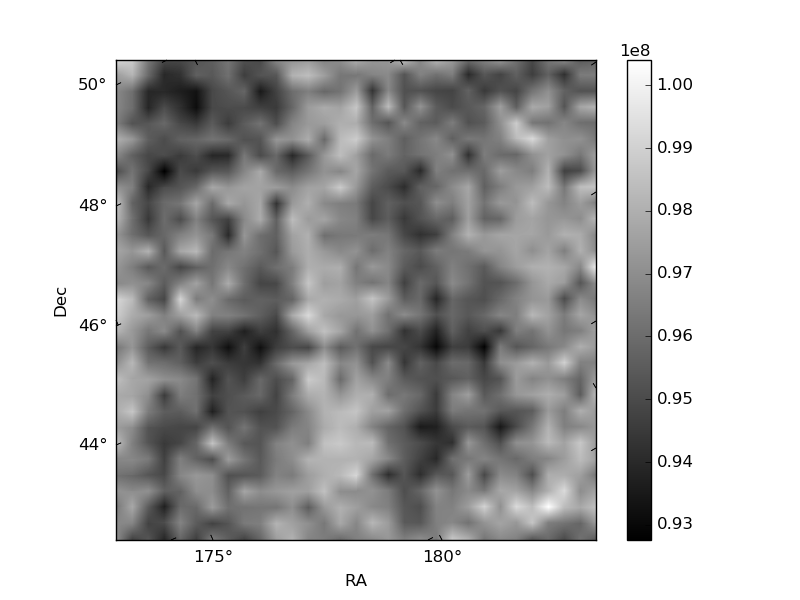
Histogram calculated using DETX and DETY for each event in the final _common_clean file
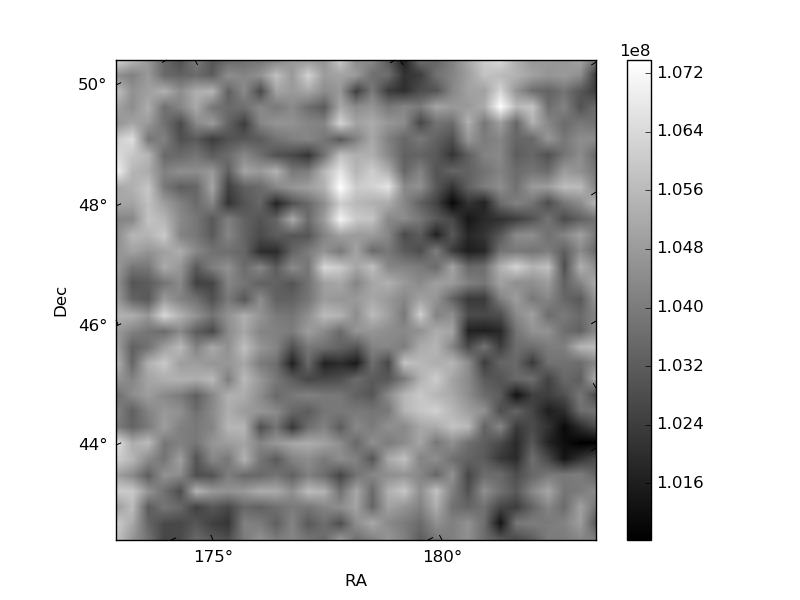
| Quadrant A | 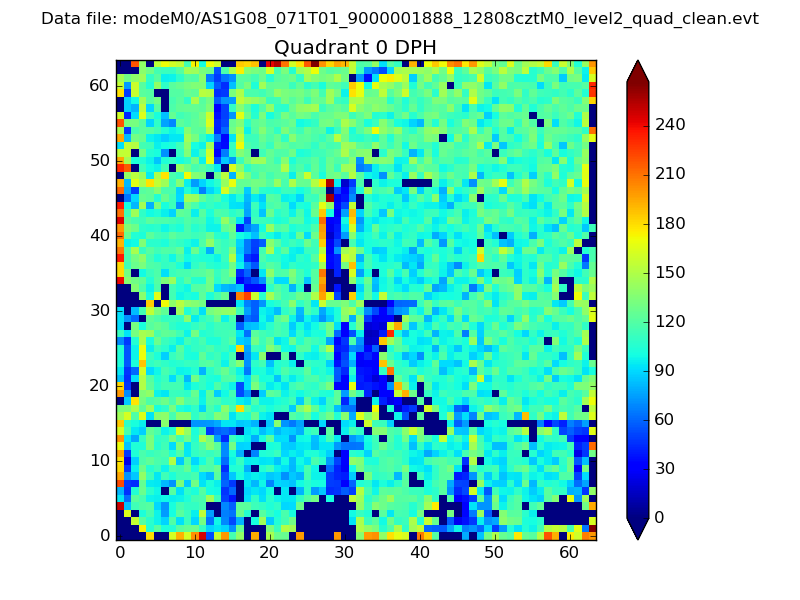 |
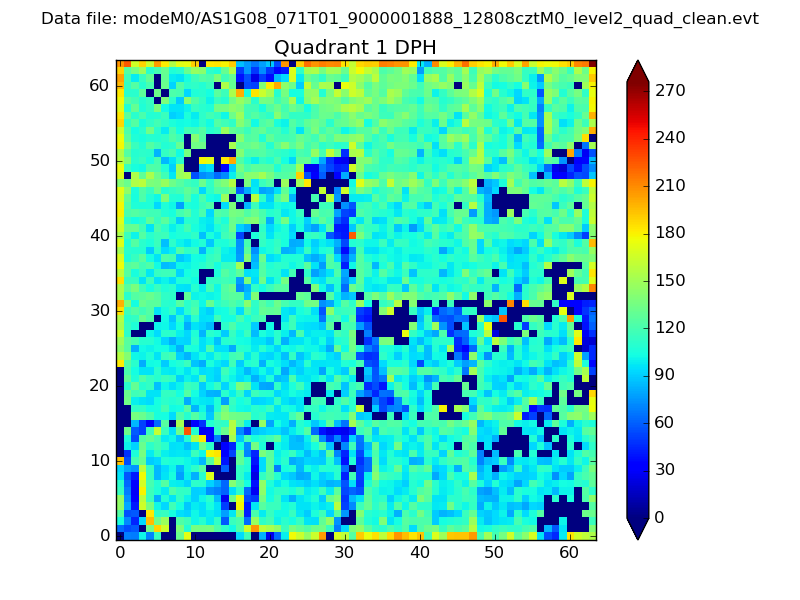 |
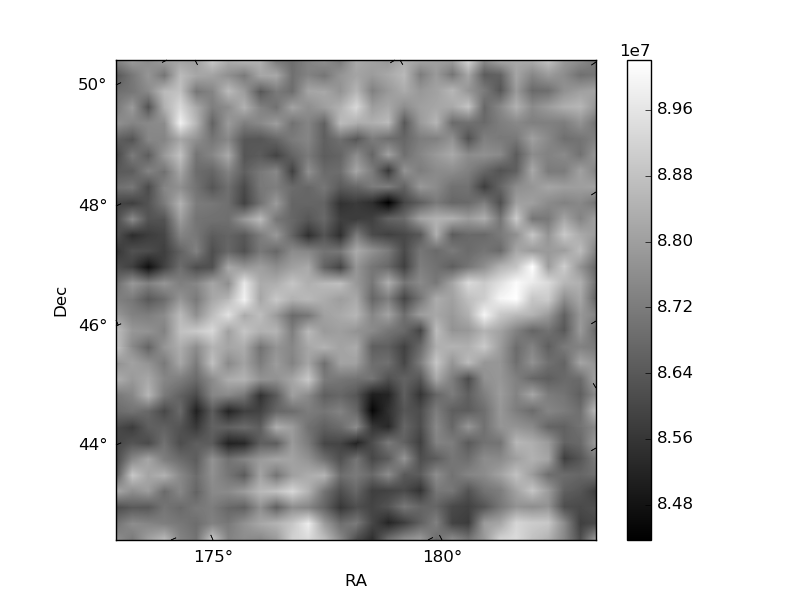
Quadrant B |
|---|---|---|---|
| Quadrant D |  |
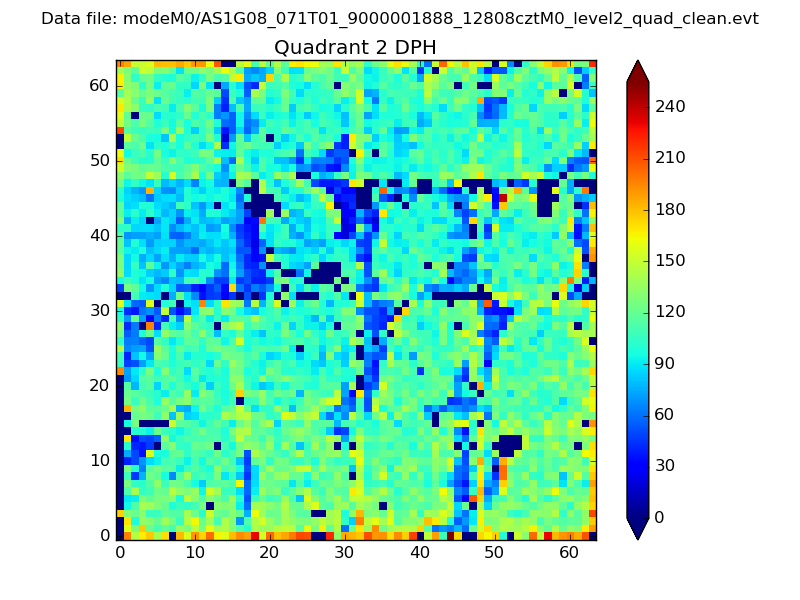 |
Quadrant C |
| Plot type | Count rate plots | Images |
|---|---|---|
| Comparison with Poisson distribution Blue bars denote a histogram of data divided into 1 sec bins. Red curve is a Poisson curve with rate = median count rate of data. |
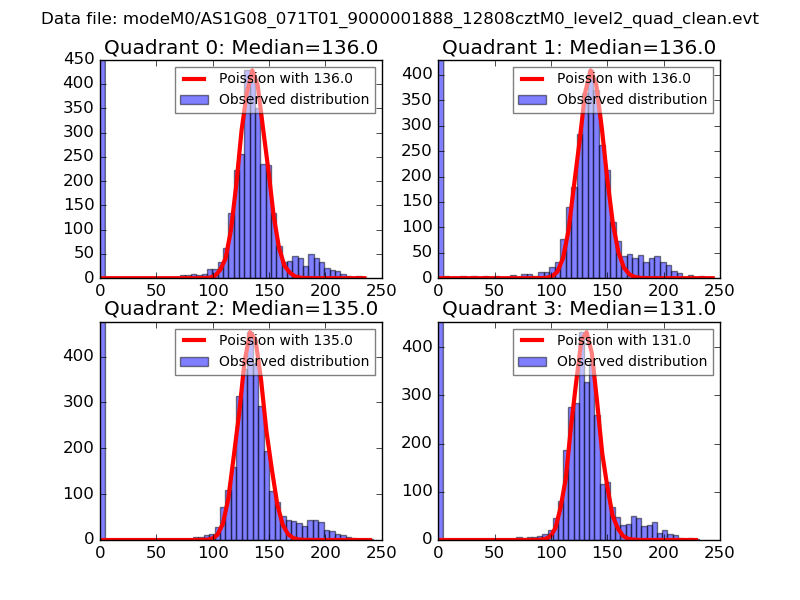 |
 |
| Quadrant-wise count rates Data is divided into 100 sec bins |
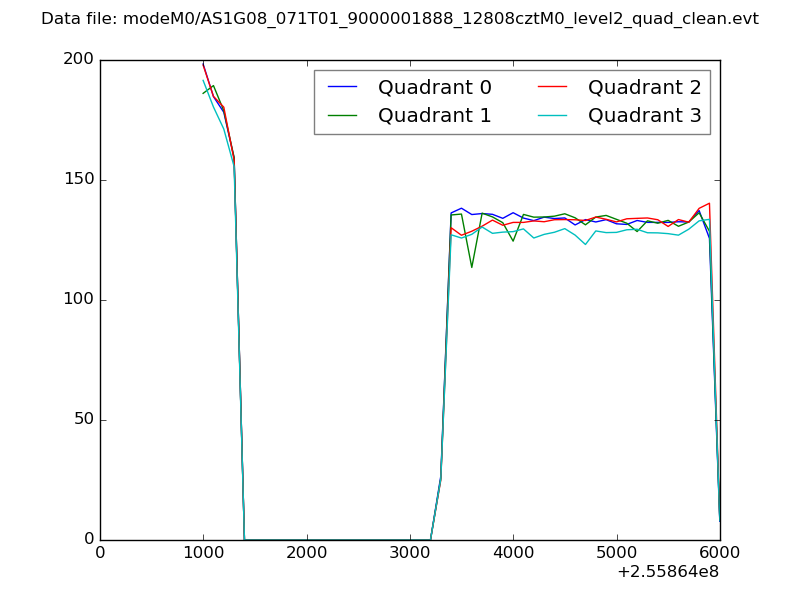 |
|
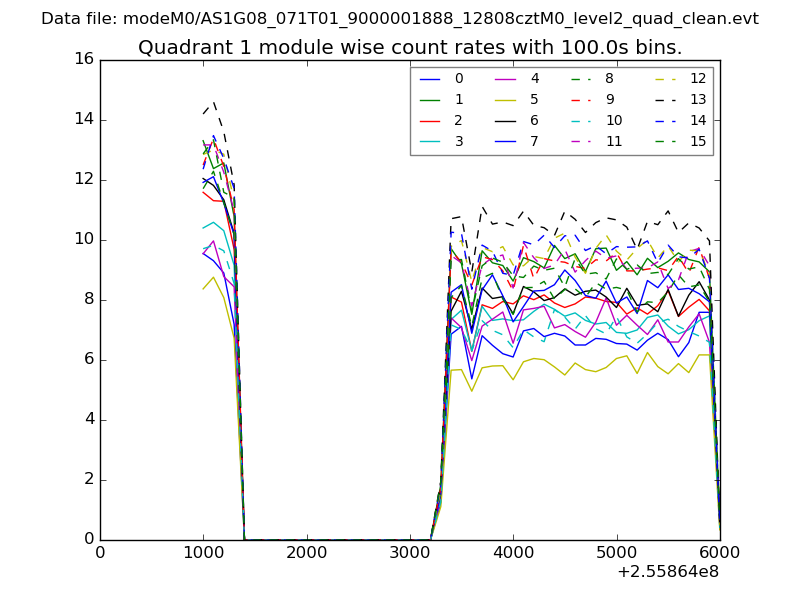
| Module-wise count rates for Quadrant A Data is divided into 100 sec bins |
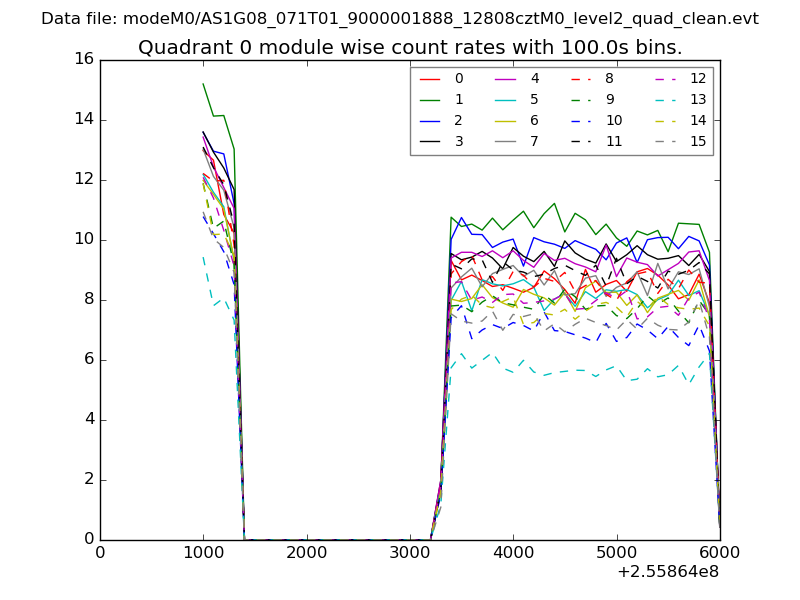 |
 |
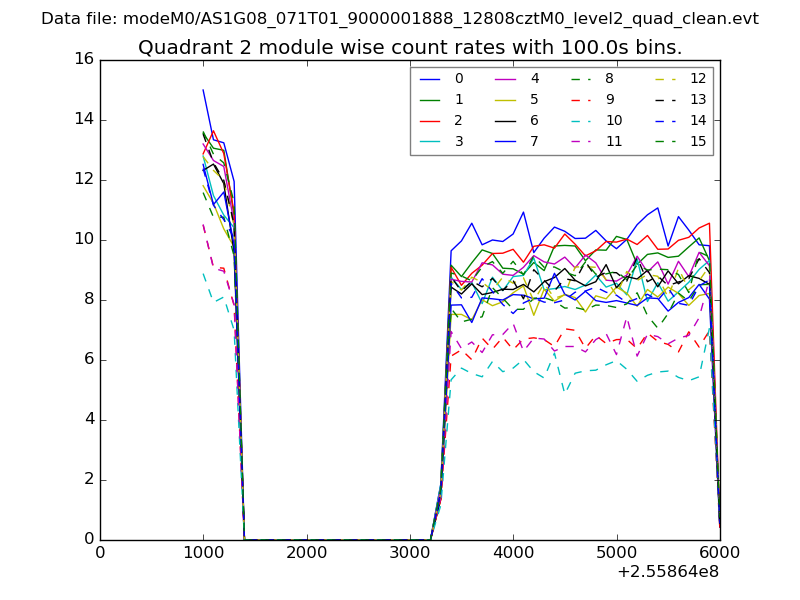
| Module-wise count rates for Quadrant B Data is divided into 100 sec bins |
 |
 |
| Module-wise count rates for Quadrant C Data is divided into 100 sec bins |
 |
 |
| Module-wise count rates for Quadrant D Data is divided into 100 sec bins |
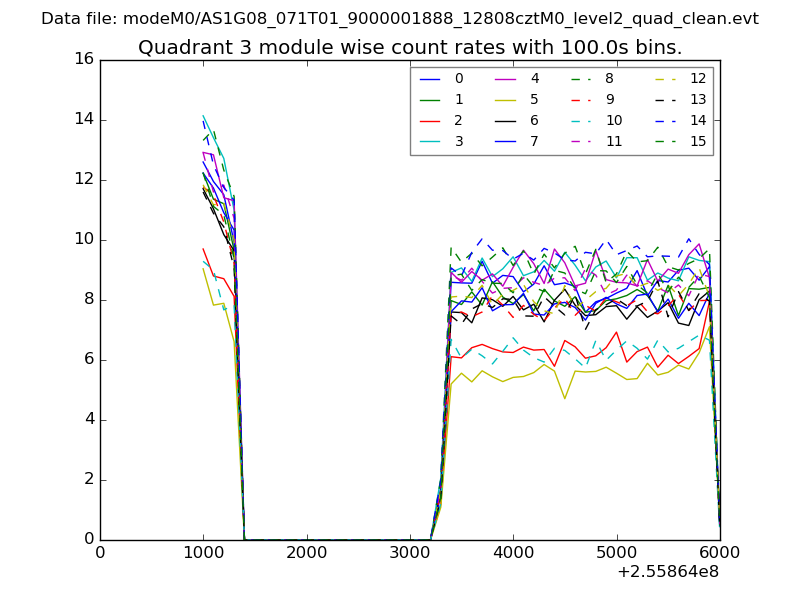 |
 |
| Parameter | Plot |
|---|---|
| CZT HV Monitor | 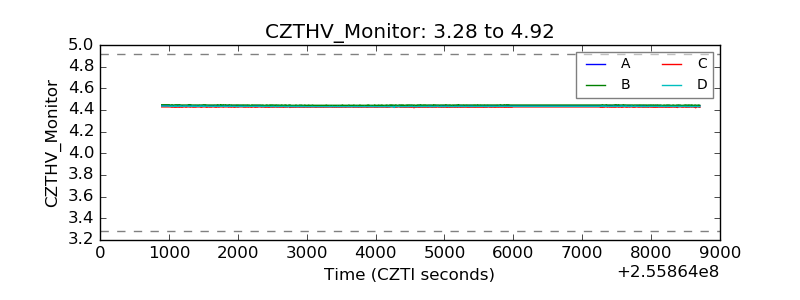 |
| D_VDD | 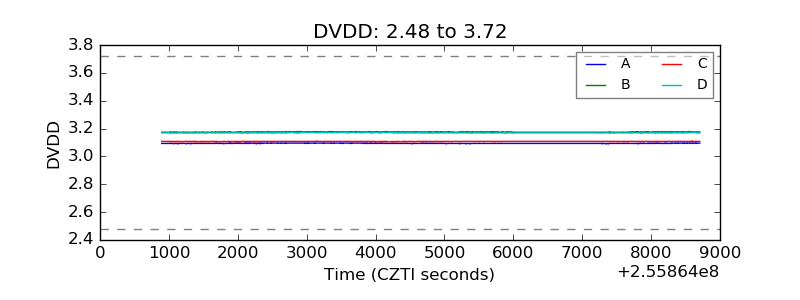 |
| Temperature 1 | 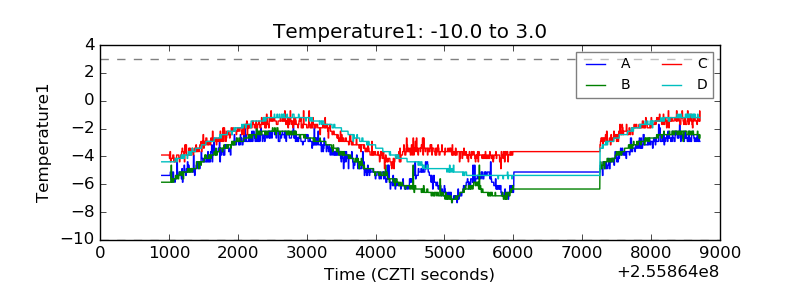 |
| Veto HV Monitor | 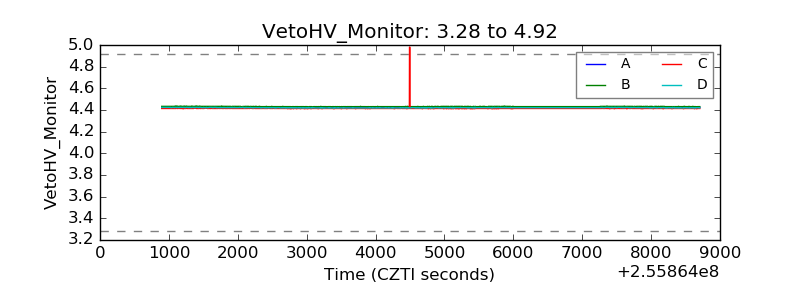 |
| Veto LLD | 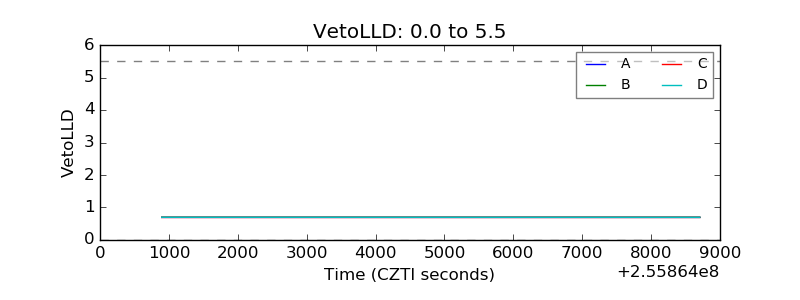 |
| Alpha Counter | 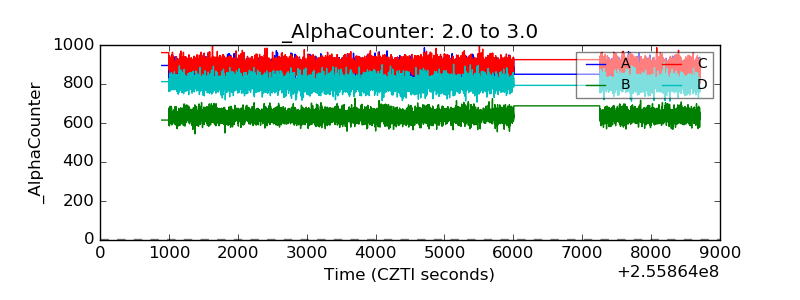 |
| _CPM_Rate | 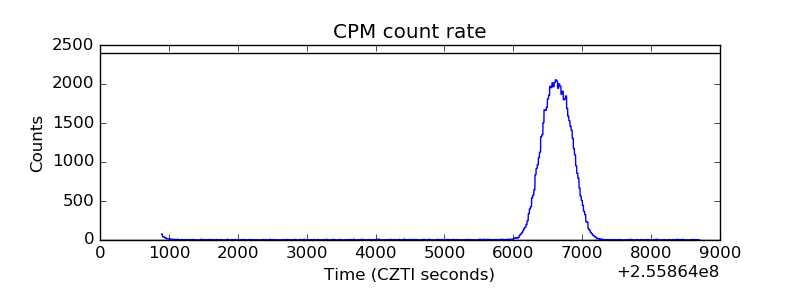 |
| CZT Counter | 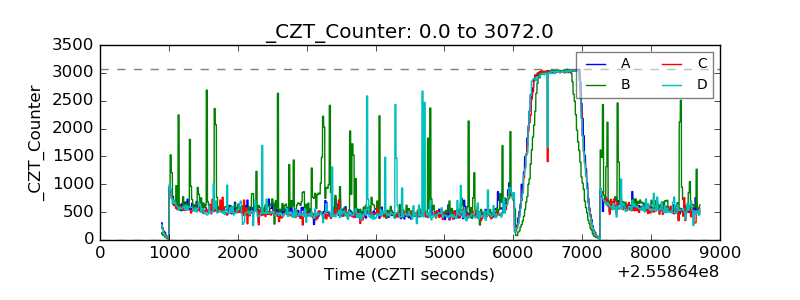 |
| +2.5 Volts monitor |  |
| +5 Volts monitor | 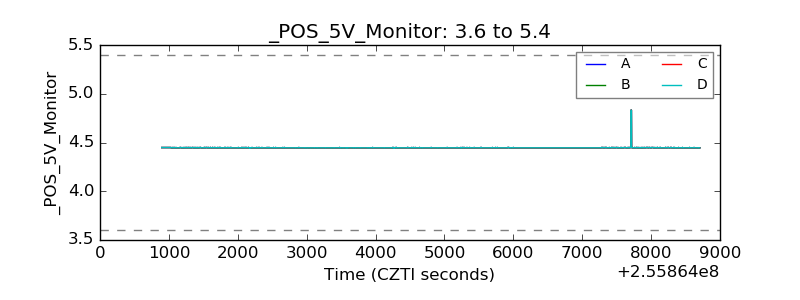 |
| _ROLL_ROT | 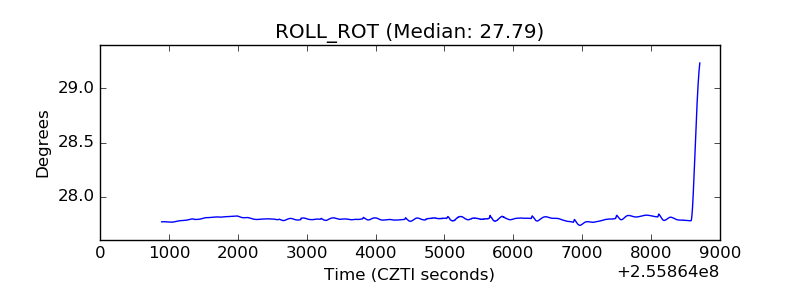 |
| _Roll_DEC | 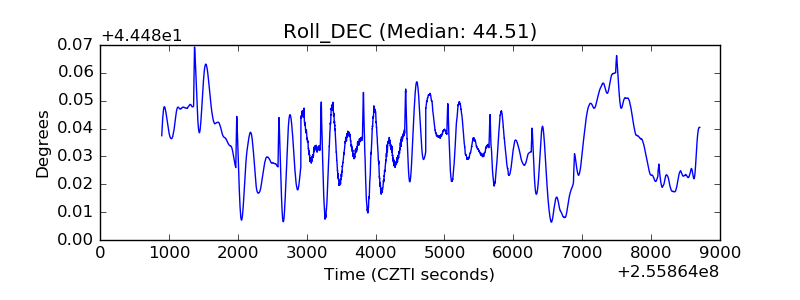 |
| _Roll_RA | 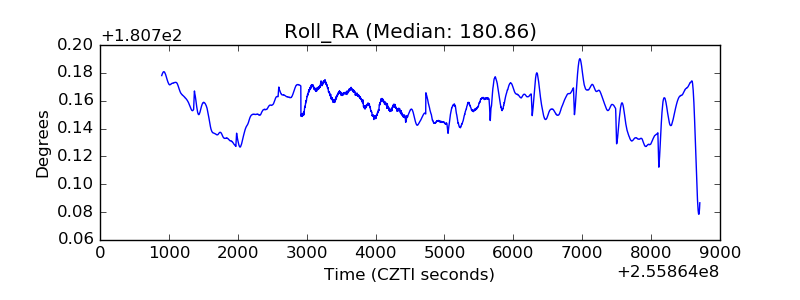 |
| Veto Counter | 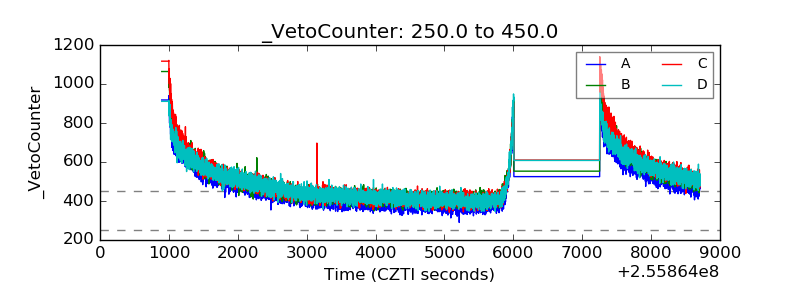 |