| Param | Original file | Final file |
|---|---|---|
| Filename | modeM0/AS1G08_071T01_9000001888_12809cztM0_level2.evt | modeM0/AS1G08_071T01_9000001888_12809cztM0_level2_quad_clean.evt |
| Size (bytes) | 512,648,640 | 68,253,120 |
| Size | 488.9 MB | 65.1 MB |
| Events in quadrant A | 3,469,052 | 409,553 |
| Events in quadrant B | 4,552,344 | 405,558 |
| Events in quadrant C | 3,303,026 | 409,527 |
| Events in quadrant D | 3,767,563 | 395,851 |
| Mode SS | |||
|---|---|---|---|
| Quadrant | BADHDUFLAG | Total packets | Discarded packets |
| A | 0 | 130 | 0 |
| B | 0 | 130 | 0 |
| C | 0 | 130 | 0 |
| D | 0 | 130 | 0 |
| Mode M9 | |||
|---|---|---|---|
| Quadrant | BADHDUFLAG | Total packets | Discarded packets |
| A | 0 | 19 | 0 |
| B | 0 | 19 | 0 |
| C | 0 | 19 | 0 |
| D | 0 | 20 | 0 |
| Mode M0 | |||
|---|---|---|---|
| Quadrant | BADHDUFLAG | Total packets | Discarded packets |
| A | 0 | 14285 | 3 |
| B | 0 | 17933 | 2 |
| C | 0 | 13721 | 2 |
| D | 0 | 15365 | 2 |
| Quadrant | Total seconds | Saturated seconds | Saturation percentage |
|---|---|---|---|
| A | 6391 | 103 | 1.611641% |
| B | 6391 | 402 | 6.290095% |
| C | 6391 | 81 | 1.267407% |
| D | 6391 | 141 | 2.206228% |
Noise dominated data is calculated using 1-second bins in cleaned event files. If a bin has >2000 counts, and if more than 50% of those come from <1% of pixels, then it is considered to be noise-dominated and hence unusable.
| Quadrant | # 1 sec bins | Bins with >0 counts | Bins with >2000 counts | High rate bins dominated by noise | Noise dominated (total time) | Noise dominated (detector-on time) | Marked lightcurve |
|---|---|---|---|---|---|---|---|
| A | 7691 | 6392 | 0 | 0 | 0.00% | 0.00% | 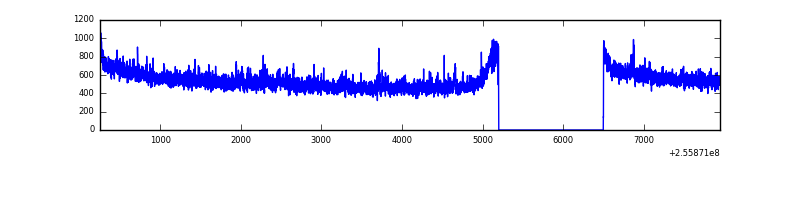 |
| B | 7691 | 6392 | 189 | 189 | 2.46% | 2.96% | 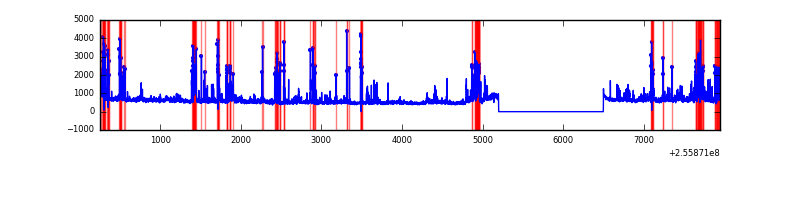 |
| C | 7691 | 6392 | 0 | 0 | 0.00% | 0.00% | 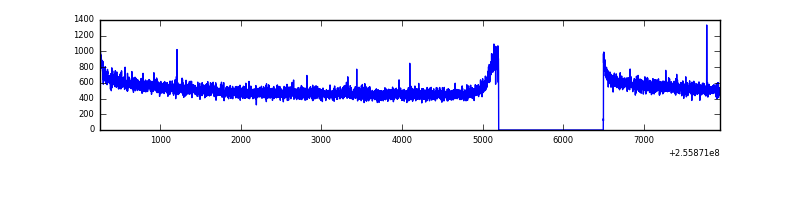 |
| D | 7691 | 6392 | 53 | 53 | 0.69% | 0.83% | 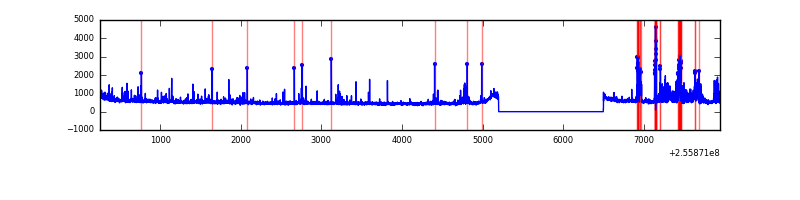 |
Top three noisy pixels from each quadrant. If the there are fewer than three noisy pixels in the level2.evt file, extra rows are filled as -1
| Pixel properties | Quadrant properties | ||||||
|---|---|---|---|---|---|---|---|
| Quadrant | DetID | PixID | Counts | Sigma | Mean | Median | Sigma |
| A | 12 | 189 | 108920 | 624.18 | 873 | 858 | 173.1 |
| A | 0 | 226 | 7855 | 40.41 | 873 | 858 | 173.1 |
| A | 12 | 194 | 6934 | 35.09 | 873 | 858 | 173.1 |
| B | 4 | 239 | 663266 | 4245.07 | 846 | 828 | 156.0 |
| B | 10 | 245 | 203707 | 1300.1 | 846 | 828 | 156.0 |
| B | 15 | 201 | 148973 | 949.35 | 846 | 828 | 156.0 |
| C | 13 | 61 | 6380 | 28.88 | 846 | 853 | 191.4 |
| C | 0 | 207 | 2668 | 9.48 | 846 | 853 | 191.4 |
| C | 3 | 202 | 2077 | 6.4 | 846 | 853 | 191.4 |
| D | 1 | 52 | 263257 | 1213.16 | 839 | 824 | 216.3 |
| D | 10 | 199 | 204817 | 943.01 | 839 | 824 | 216.3 |
| D | 8 | 195 | 66931 | 305.6 | 839 | 824 | 216.3 |
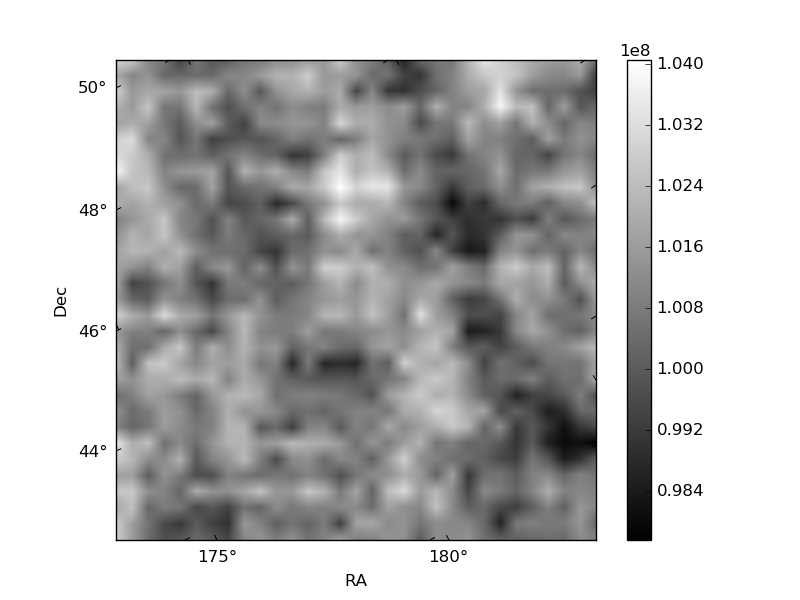
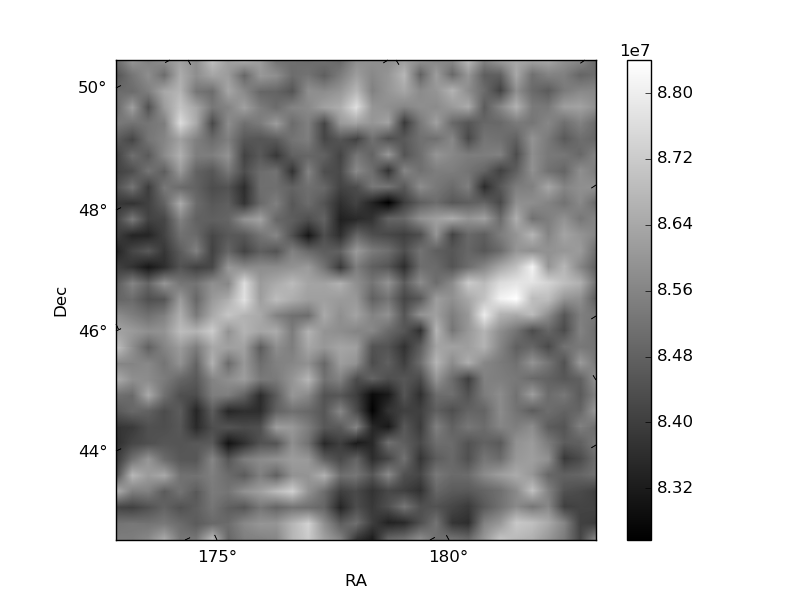
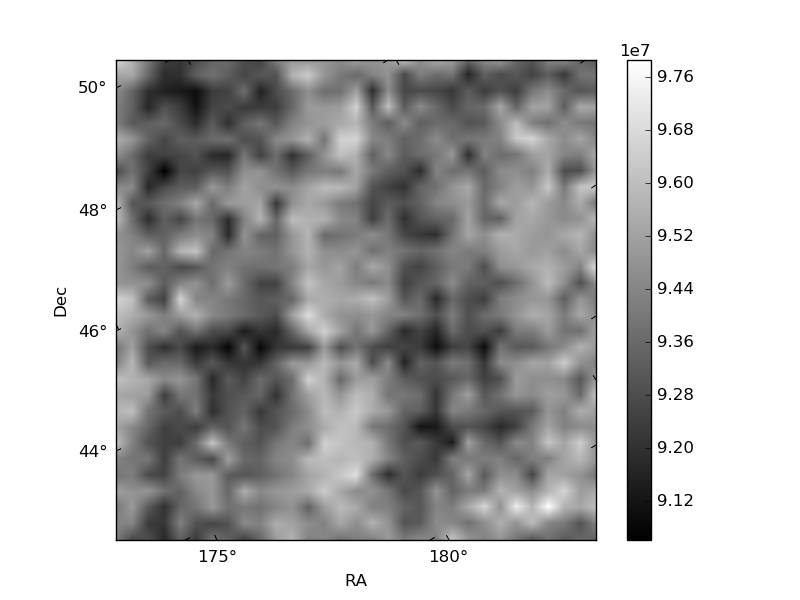
Histogram calculated using DETX and DETY for each event in the final _common_clean file
| Quadrant A | 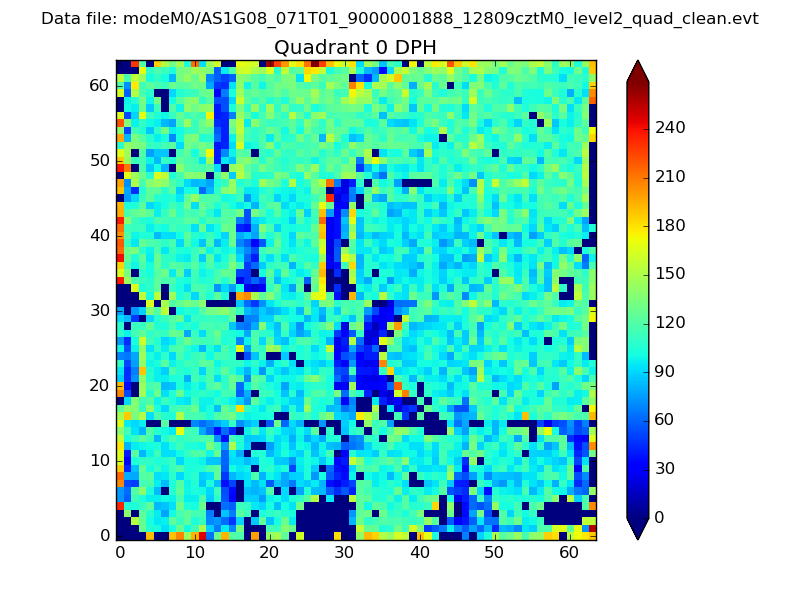 |
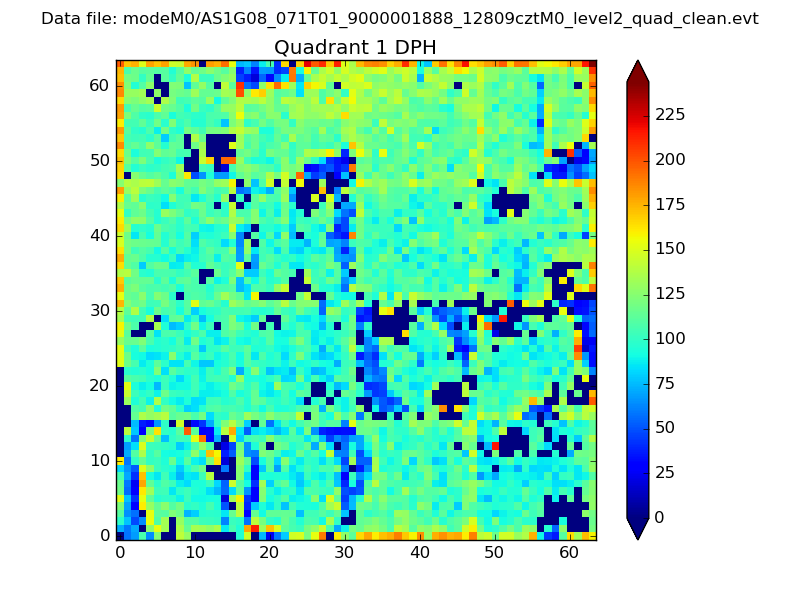 |
Quadrant B |
|---|---|---|---|
| Quadrant D | 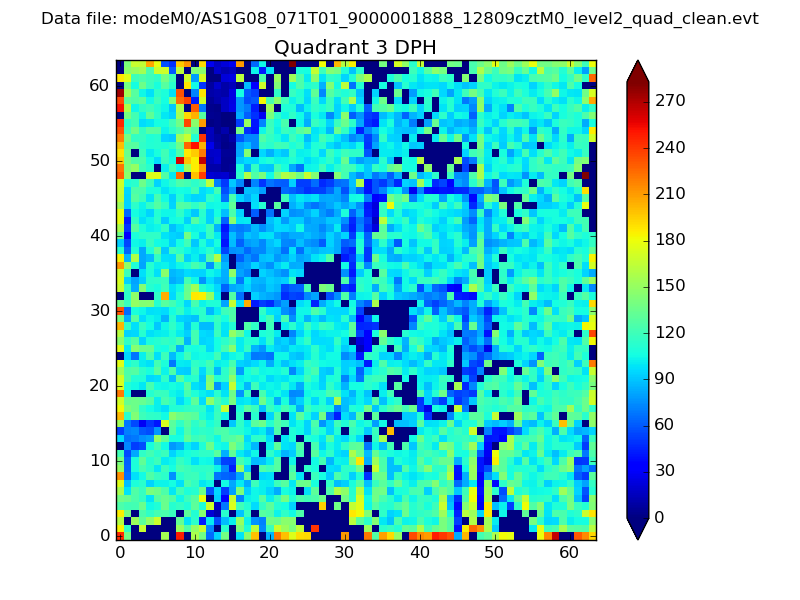 |
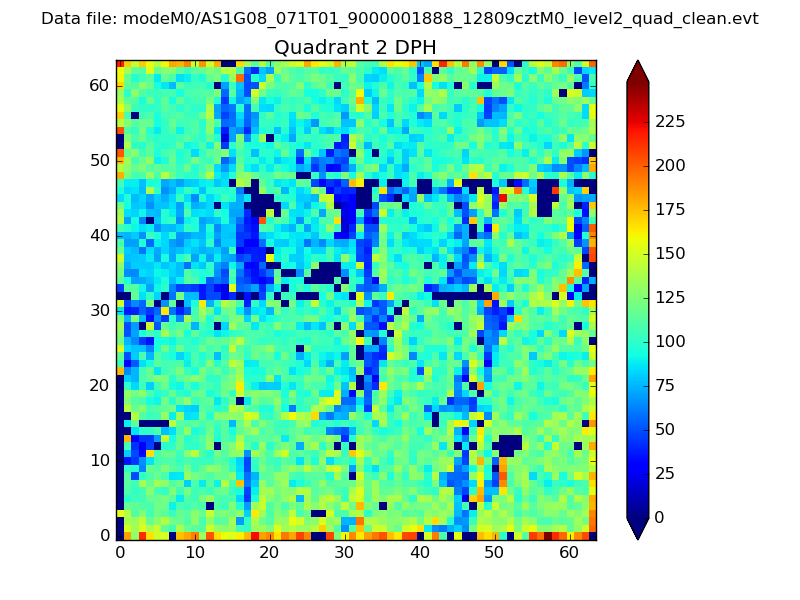 |
Quadrant C |
| Plot type | Count rate plots | Images |
|---|---|---|
| Comparison with Poisson distribution Blue bars denote a histogram of data divided into 1 sec bins. Red curve is a Poisson curve with rate = median count rate of data. |
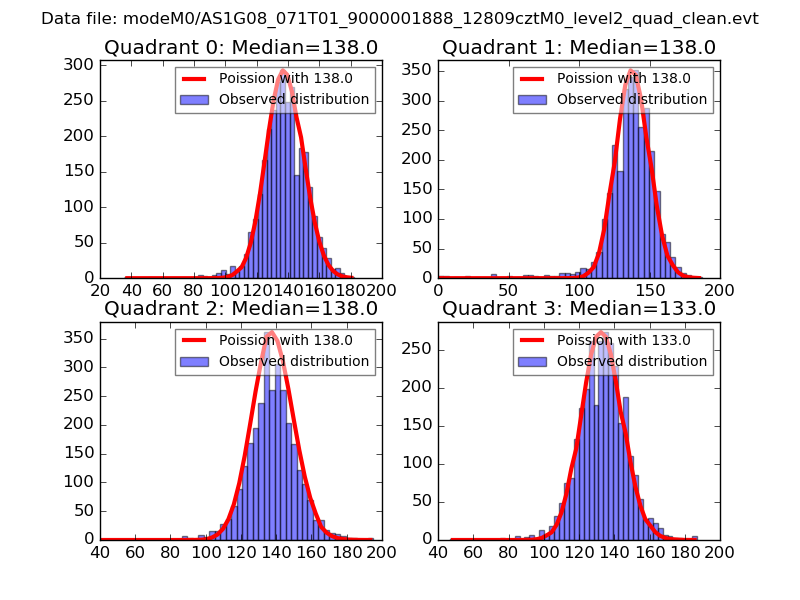 |
 |
| Quadrant-wise count rates Data is divided into 100 sec bins |
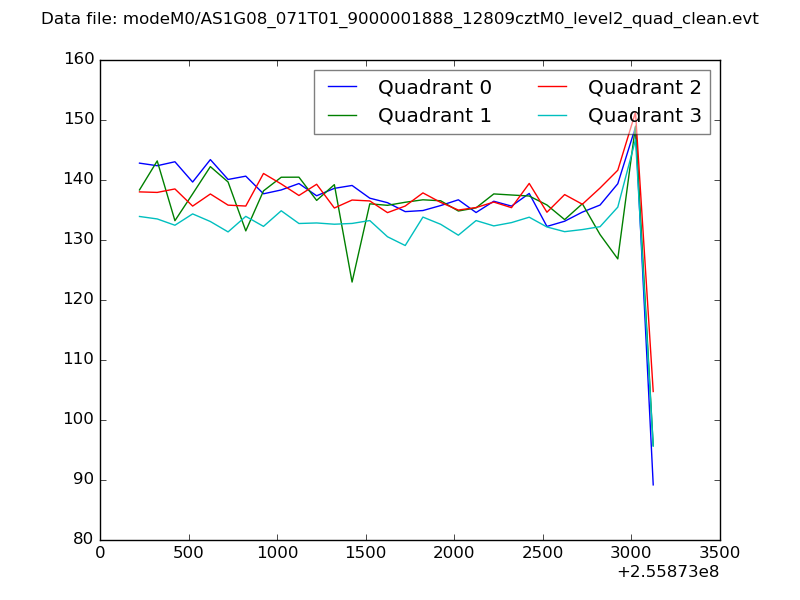 |
|
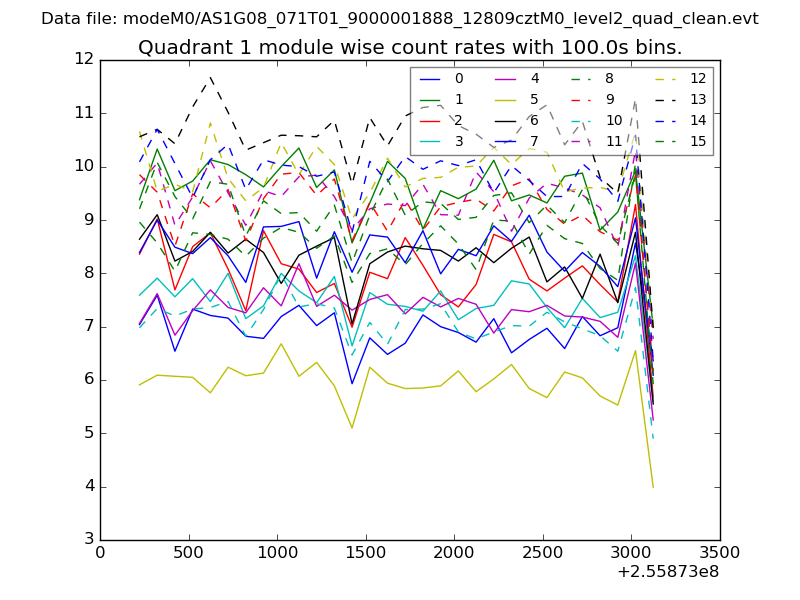
| Module-wise count rates for Quadrant A Data is divided into 100 sec bins |
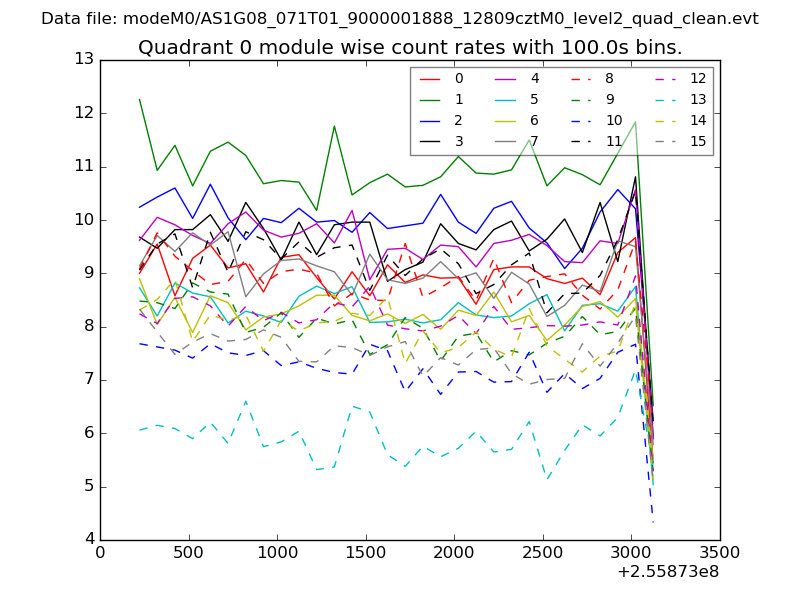 |
 |
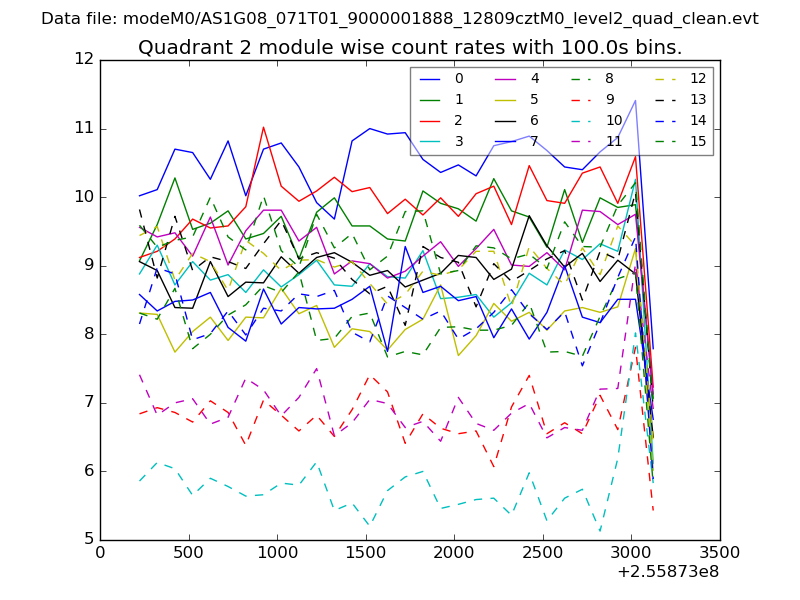
| Module-wise count rates for Quadrant B Data is divided into 100 sec bins |
 |
 |
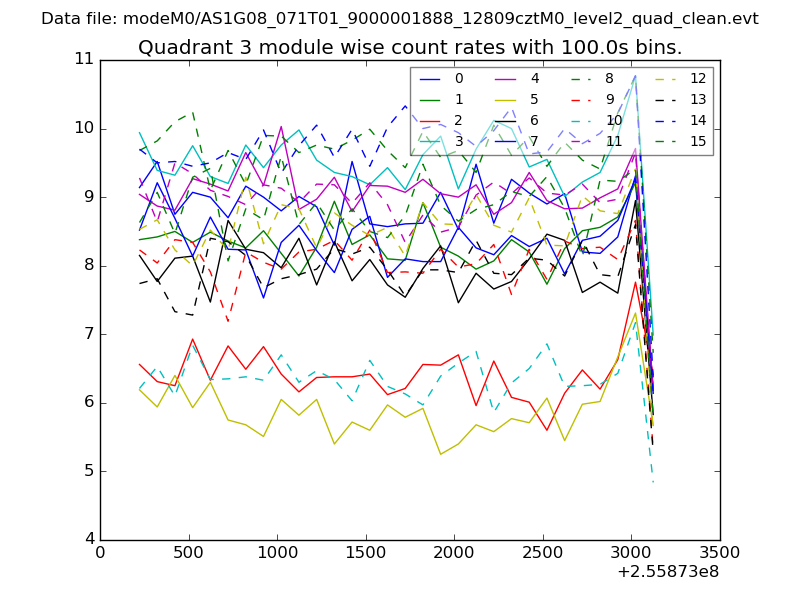
| Module-wise count rates for Quadrant C Data is divided into 100 sec bins |
 |
 |
| Module-wise count rates for Quadrant D Data is divided into 100 sec bins |
 |
 |
| Parameter | Plot |
|---|---|
| CZT HV Monitor | 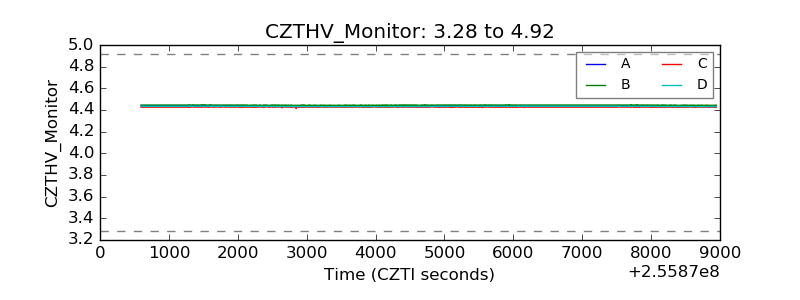 |
| D_VDD |  |
| Temperature 1 | 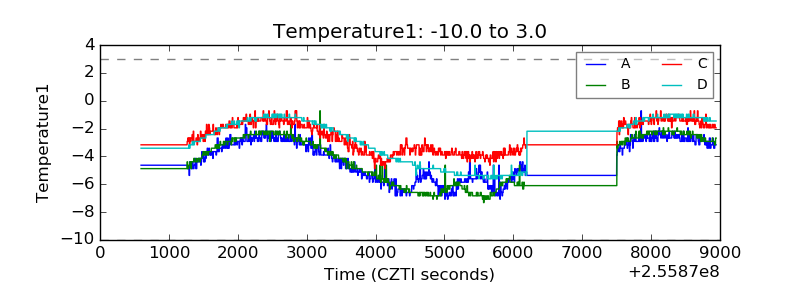 |
| Veto HV Monitor | 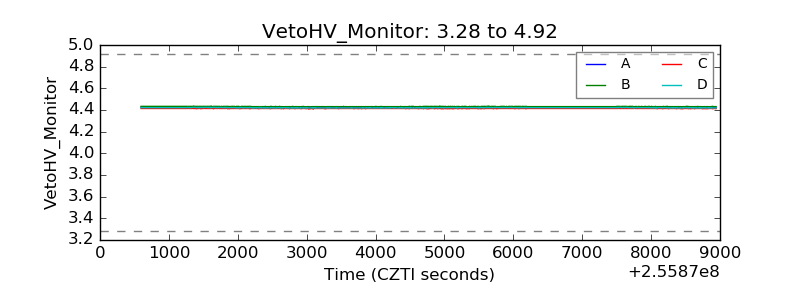 |
| Veto LLD | 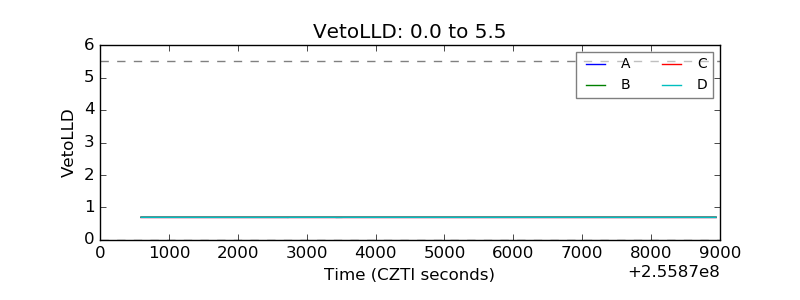 |
| Alpha Counter |  |
| _CPM_Rate | 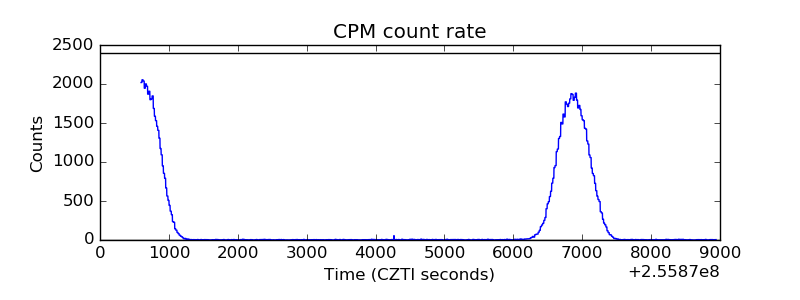 |
| CZT Counter | 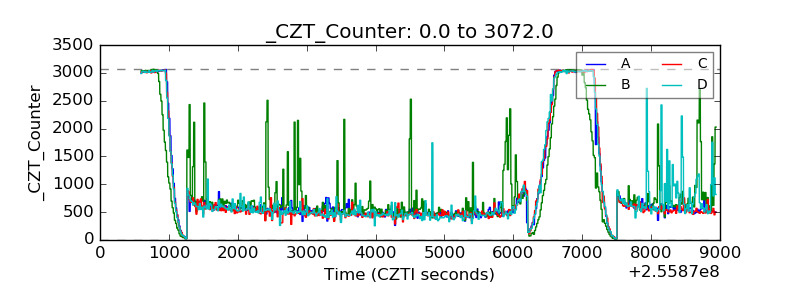 |
| +2.5 Volts monitor |  |
| +5 Volts monitor |  |
| _ROLL_ROT | 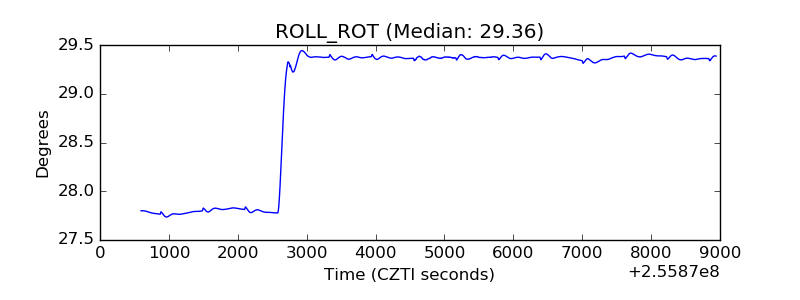 |
| _Roll_DEC | 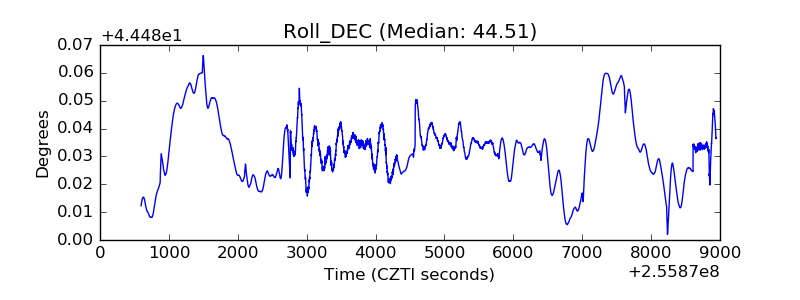 |
| _Roll_RA | 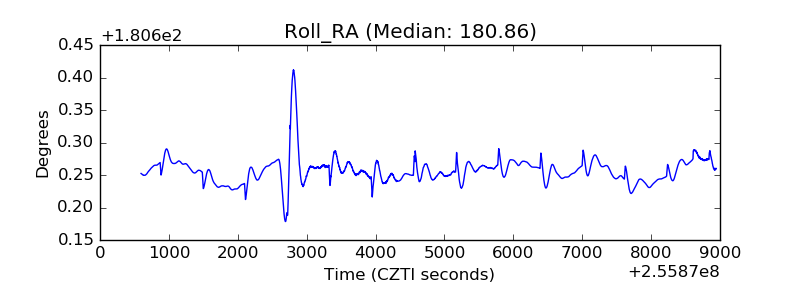 |
| Veto Counter | 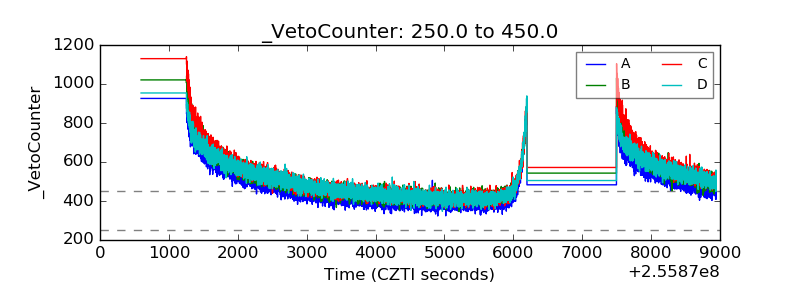 |