| Param | Original file | Final file |
|---|---|---|
| Filename | modeM0/AS1G08_071T01_9000001888_12813cztM0_level2.evt | modeM0/AS1G08_071T01_9000001888_12813cztM0_level2_quad_clean.evt |
| Size (bytes) | 512,271,360 | 101,240,640 |
| Size | 488.5 MB | 96.6 MB |
| Events in quadrant A | 3,419,404 | 647,929 |
| Events in quadrant B | 4,397,442 | 643,266 |
| Events in quadrant C | 3,282,325 | 652,917 |
| Events in quadrant D | 3,923,860 | 618,329 |
| Mode SS | |||
|---|---|---|---|
| Quadrant | BADHDUFLAG | Total packets | Discarded packets |
| A | 0 | 148 | 0 |
| B | 0 | 148 | 0 |
| C | 0 | 148 | 0 |
| D | 0 | 148 | 0 |
| Mode M9 | |||
|---|---|---|---|
| Quadrant | BADHDUFLAG | Total packets | Discarded packets |
| A | 0 | 4 | 0 |
| B | 0 | 4 | 0 |
| C | 0 | 4 | 0 |
| D | 0 | 5 | 0 |
| Mode M0 | |||
|---|---|---|---|
| Quadrant | BADHDUFLAG | Total packets | Discarded packets |
| A | 0 | 15131 | 4 |
| B | 0 | 17964 | 3 |
| C | 0 | 14804 | 3 |
| D | 0 | 16686 | 3 |
| Quadrant | Total seconds | Saturated seconds | Saturation percentage |
|---|---|---|---|
| A | 7226 | 29 | 0.401329% |
| B | 7226 | 320 | 4.428453% |
| C | 7226 | 36 | 0.498201% |
| D | 7226 | 164 | 2.269582% |
Noise dominated data is calculated using 1-second bins in cleaned event files. If a bin has >2000 counts, and if more than 50% of those come from <1% of pixels, then it is considered to be noise-dominated and hence unusable.
| Quadrant | # 1 sec bins | Bins with >0 counts | Bins with >2000 counts | High rate bins dominated by noise | Noise dominated (total time) | Noise dominated (detector-on time) | Marked lightcurve |
|---|---|---|---|---|---|---|---|
| A | 7692 | 7228 | 0 | 0 | 0.00% | 0.00% | 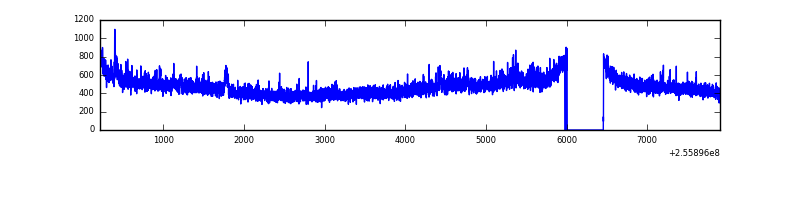 |
| B | 7692 | 7228 | 142 | 142 | 1.85% | 1.96% | 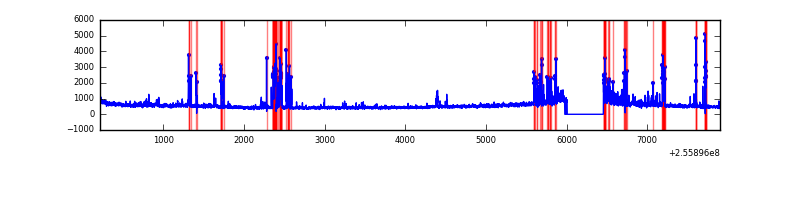 |
| C | 7692 | 7228 | 0 | 0 | 0.00% | 0.00% |  |
| D | 7692 | 7228 | 124 | 124 | 1.61% | 1.72% | 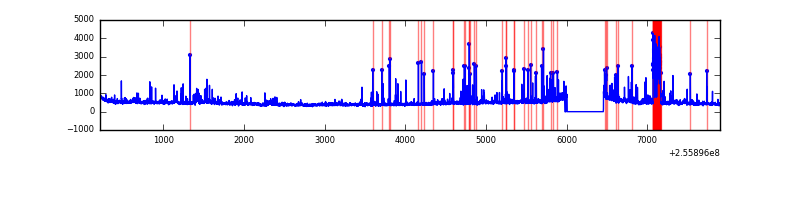 |
Top three noisy pixels from each quadrant. If the there are fewer than three noisy pixels in the level2.evt file, extra rows are filled as -1
| Pixel properties | Quadrant properties | ||||||
|---|---|---|---|---|---|---|---|
| Quadrant | DetID | PixID | Counts | Sigma | Mean | Median | Sigma |
| A | 12 | 189 | 107532 | 615.87 | 857 | 837 | 173.2 |
| A | 8 | 15 | 14537 | 79.08 | 857 | 837 | 173.2 |
| A | 0 | 226 | 7662 | 39.4 | 857 | 837 | 173.2 |
| B | 4 | 239 | 506693 | 3116.93 | 849 | 828 | 162.3 |
| B | 0 | 219 | 265510 | 1630.86 | 849 | 828 | 162.3 |
| B | 15 | 201 | 147234 | 902.09 | 849 | 828 | 162.3 |
| C | 13 | 61 | 6138 | 27.05 | 841 | 845 | 195.7 |
| C | 8 | 222 | 2019 | 6.0 | 841 | 845 | 195.7 |
| C | 3 | 202 | 2007 | 5.94 | 841 | 845 | 195.7 |
| D | 1 | 52 | 450040 | 2233.38 | 825 | 799 | 201.1 |
| D | 8 | 195 | 287870 | 1427.16 | 825 | 799 | 201.1 |
| D | 13 | 172 | 33347 | 161.81 | 825 | 799 | 201.1 |
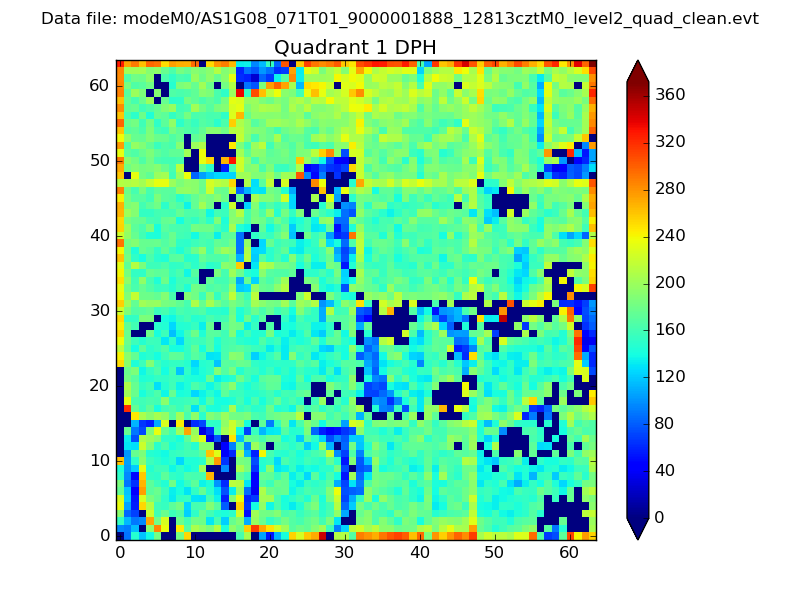
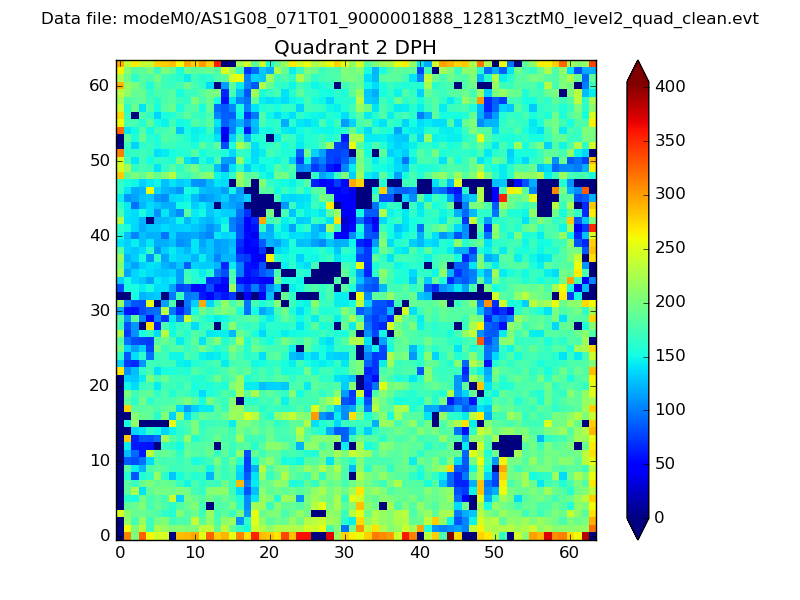
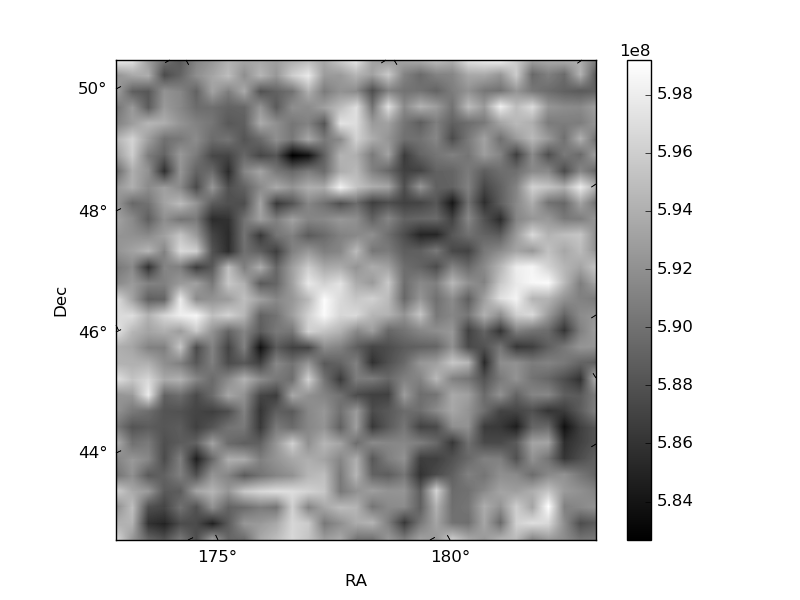
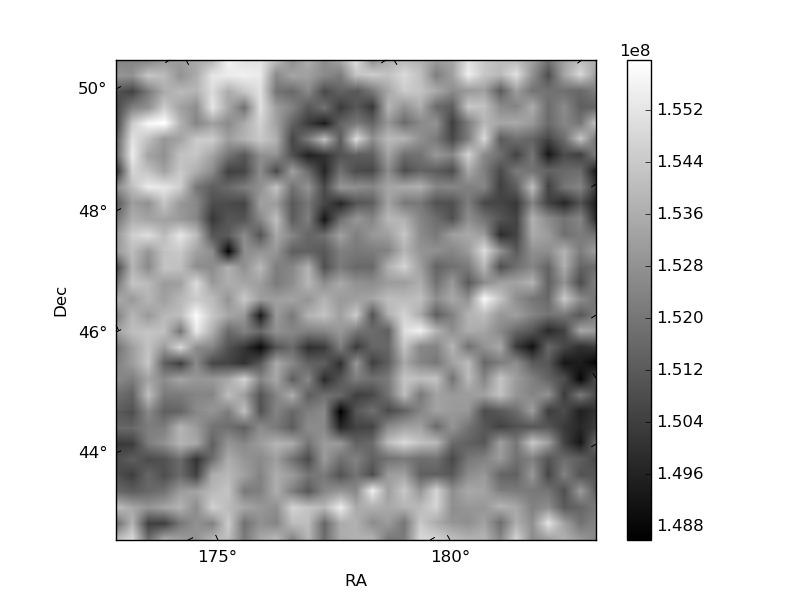
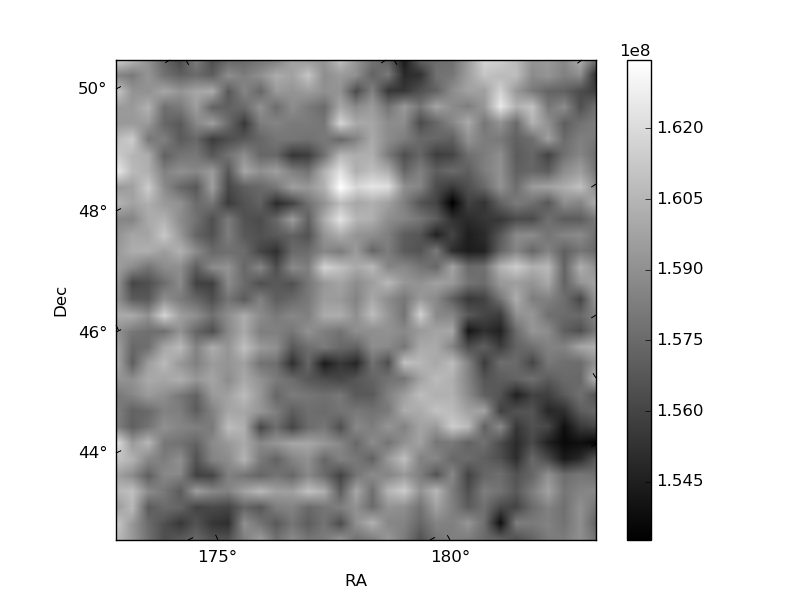
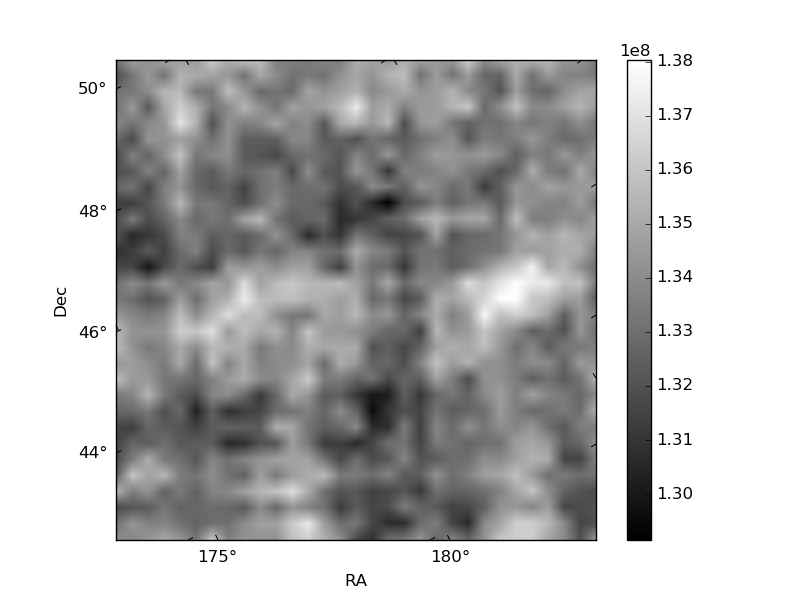
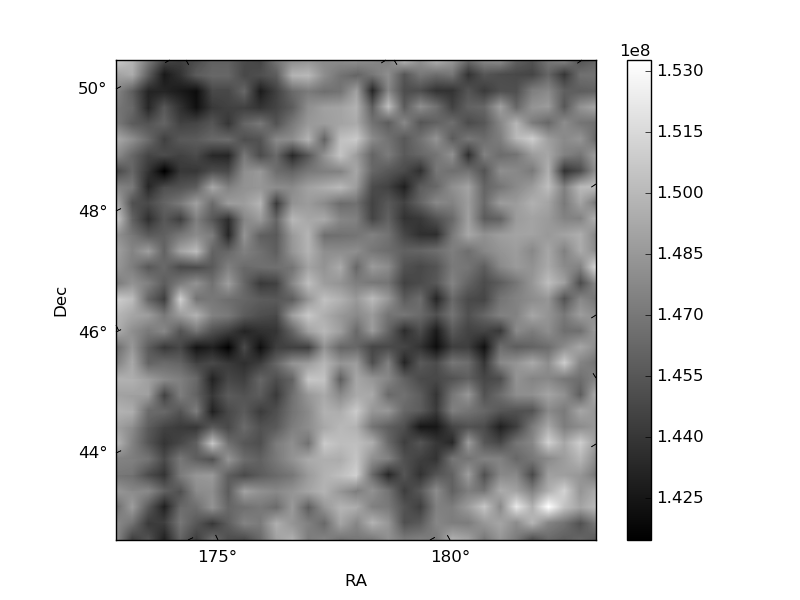
Histogram calculated using DETX and DETY for each event in the final _common_clean file
| Quadrant A | 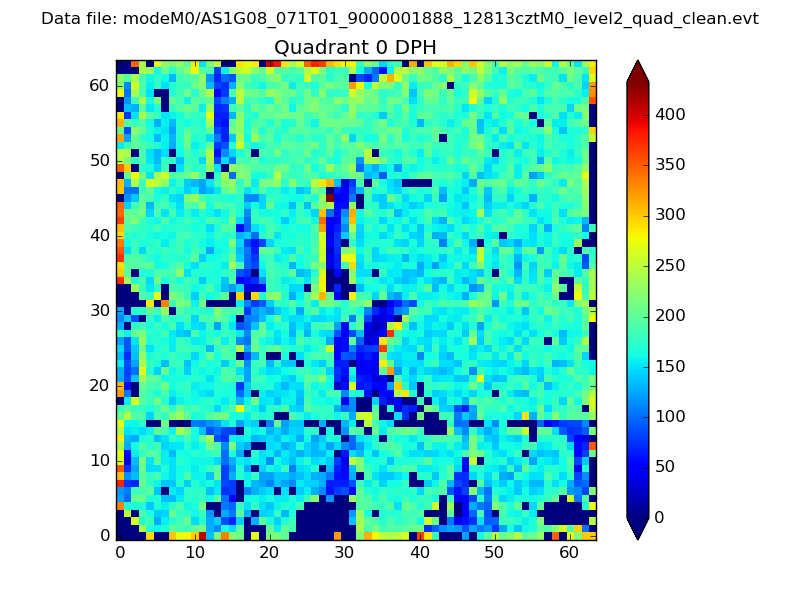 |
 |
Quadrant B |
|---|---|---|---|
| Quadrant D | 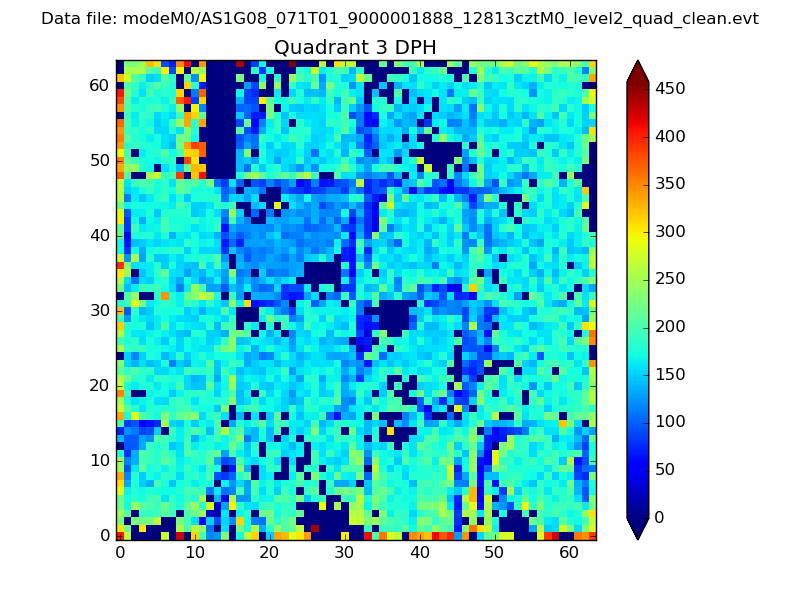 |
 |
Quadrant C |
| Plot type | Count rate plots | Images |
|---|---|---|
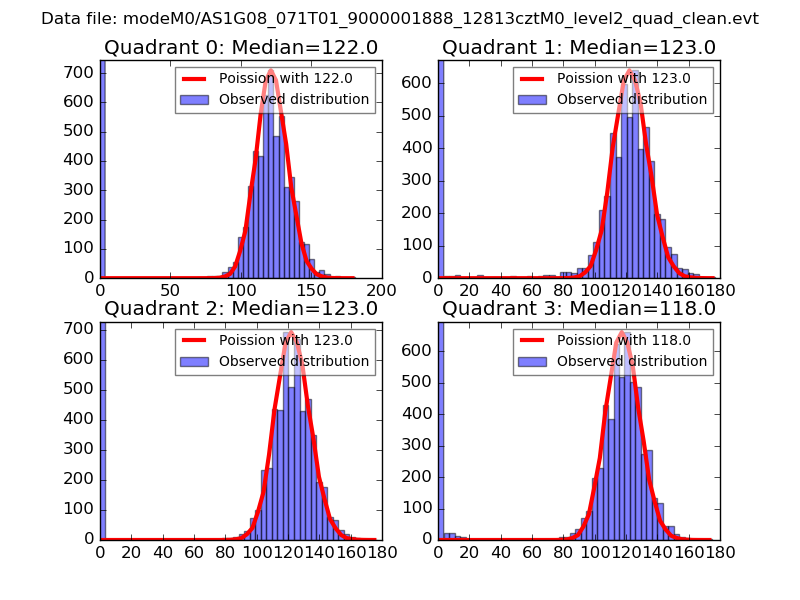
| Comparison with Poisson distribution Blue bars denote a histogram of data divided into 1 sec bins. Red curve is a Poisson curve with rate = median count rate of data. |
 |
 |
| Quadrant-wise count rates Data is divided into 100 sec bins |
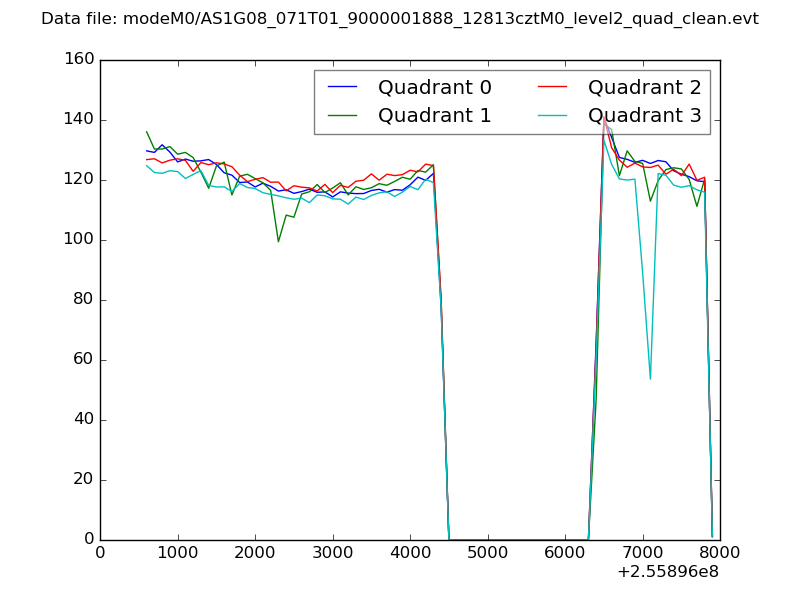 |
|
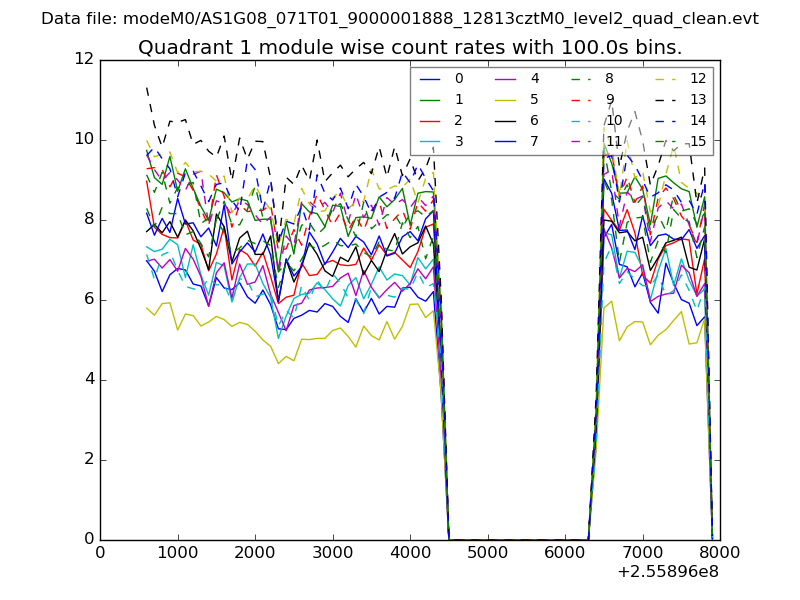
| Module-wise count rates for Quadrant A Data is divided into 100 sec bins |
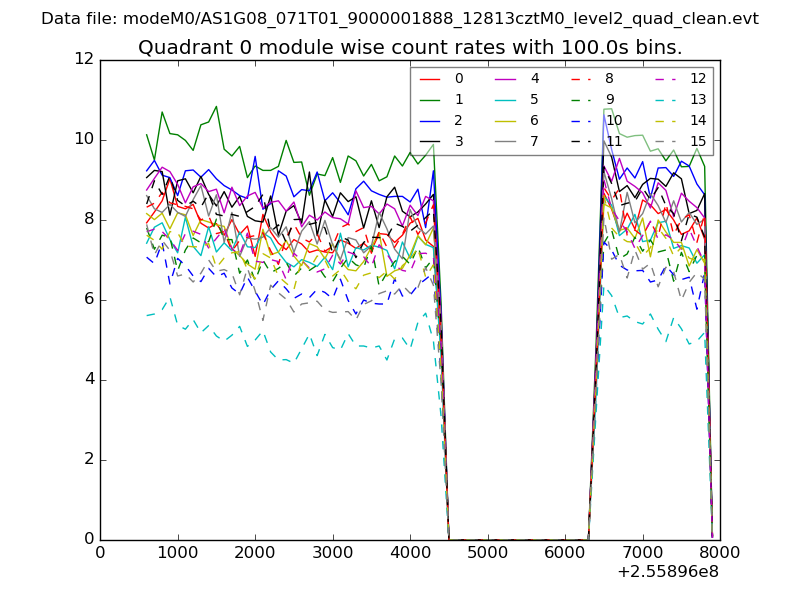 |
 |
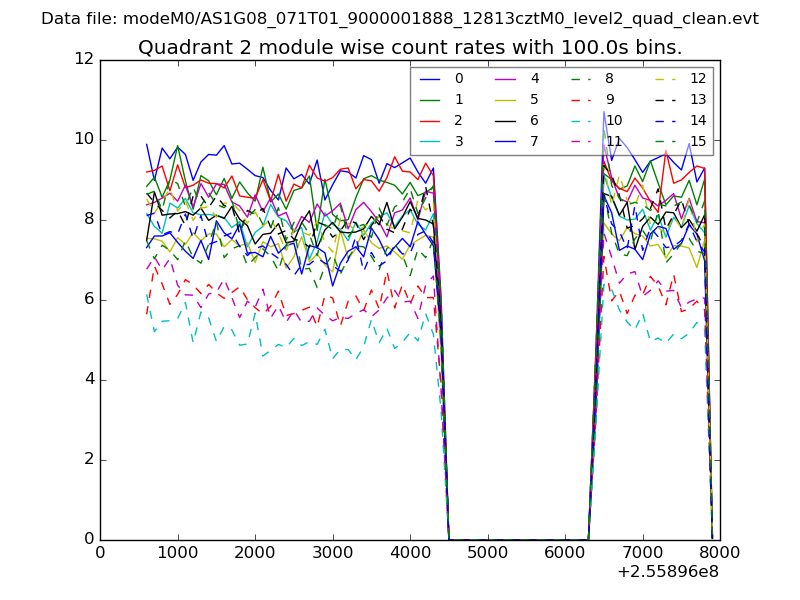
| Module-wise count rates for Quadrant B Data is divided into 100 sec bins |
 |
 |
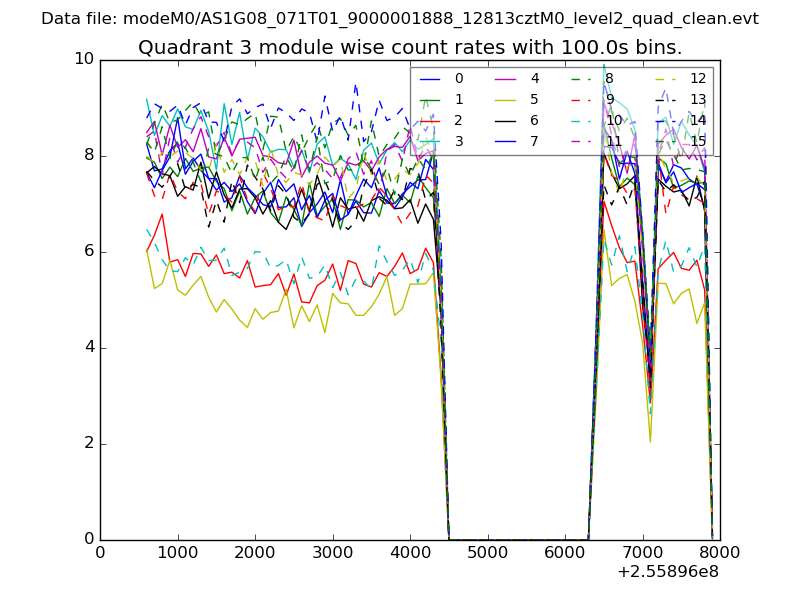
| Module-wise count rates for Quadrant C Data is divided into 100 sec bins |
 |
 |
| Module-wise count rates for Quadrant D Data is divided into 100 sec bins |
 |
 |
| Parameter | Plot |
|---|---|
| CZT HV Monitor | 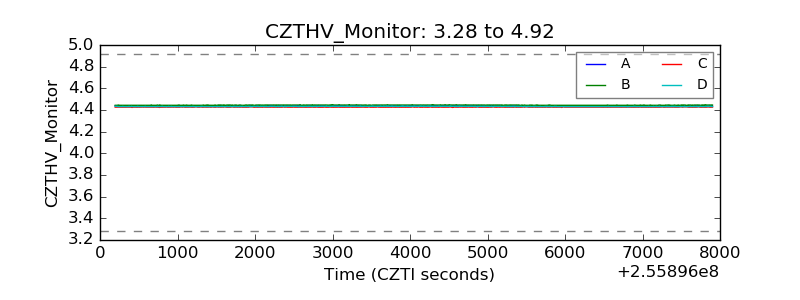 |
| D_VDD | 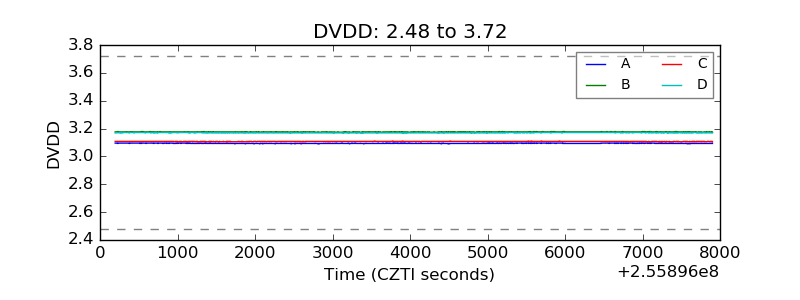 |
| Temperature 1 | 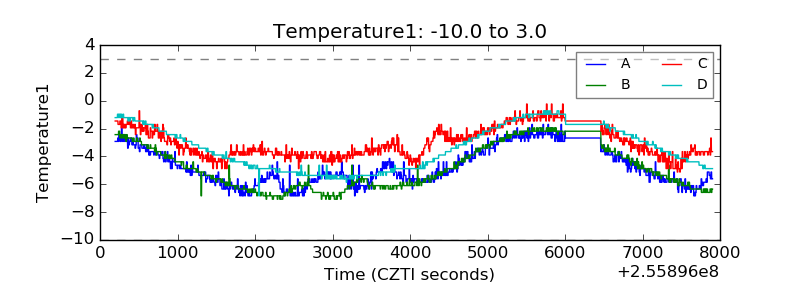 |
| Veto HV Monitor |  |
| Veto LLD | 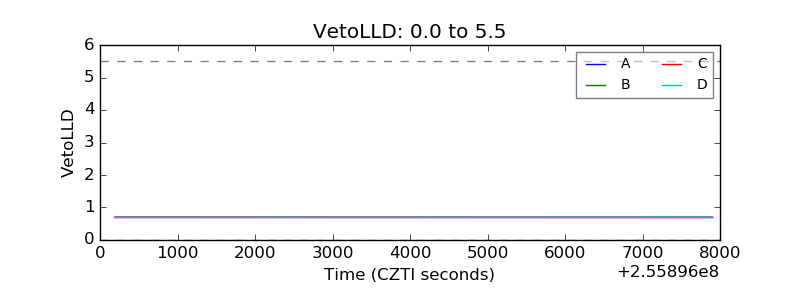 |
| Alpha Counter | 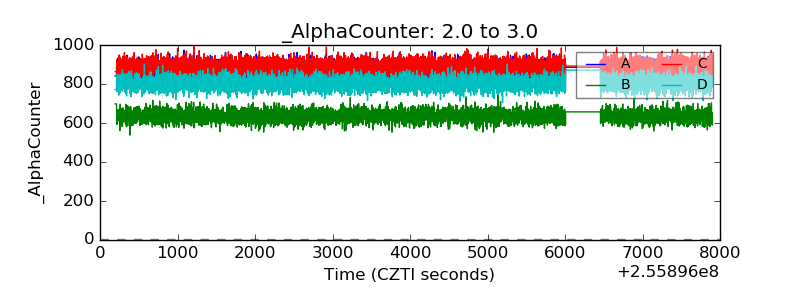 |
| _CPM_Rate | 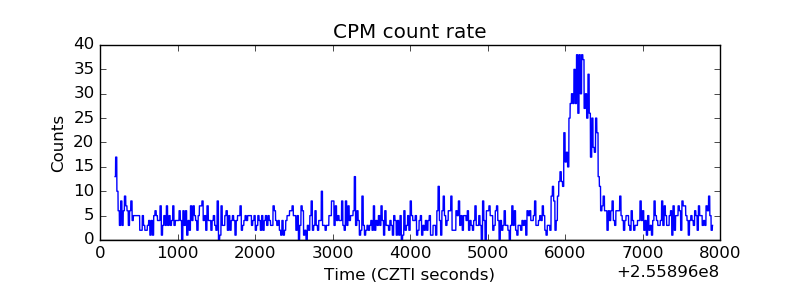 |
| CZT Counter | 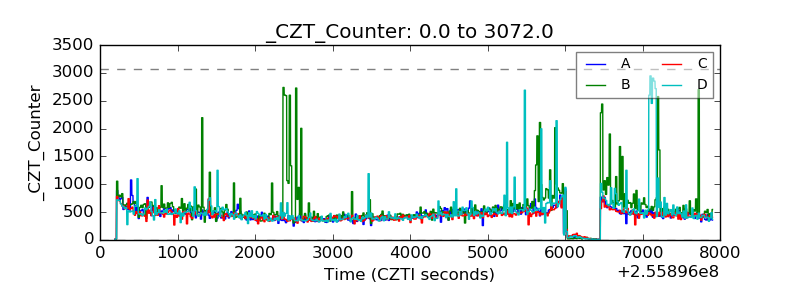 |
| +2.5 Volts monitor |  |
| +5 Volts monitor |  |
| _ROLL_ROT | 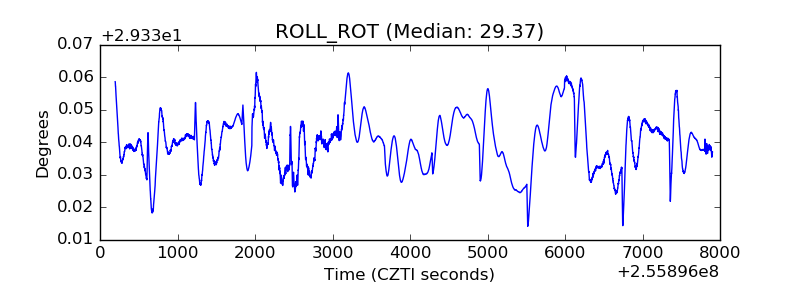 |
| _Roll_DEC |  |
| _Roll_RA | 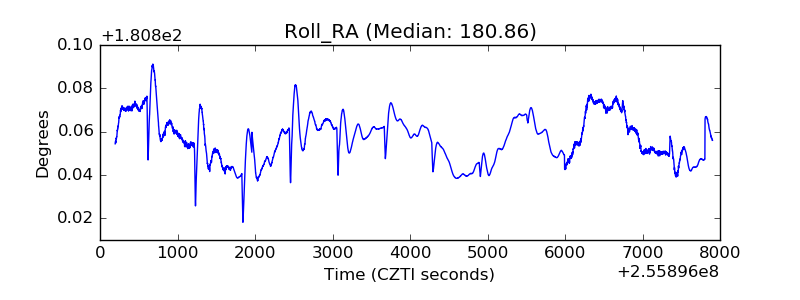 |
| Veto Counter | 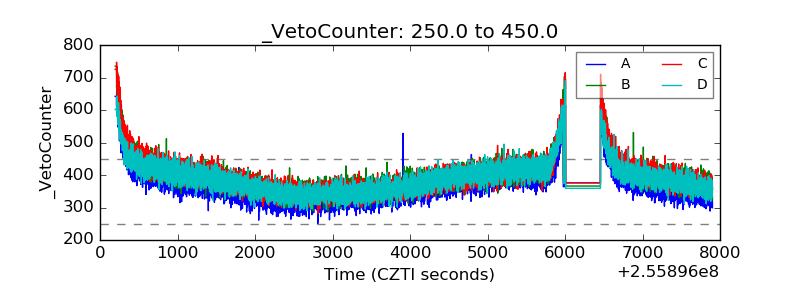 |