| Param | Original file | Final file |
|---|---|---|
| Filename | modeM0/AS1G08_071T01_9000001888_12814cztM0_level2.evt | modeM0/AS1G08_071T01_9000001888_12814cztM0_level2_quad_clean.evt |
| Size (bytes) | 569,306,880 | 105,062,400 |
| Size | 542.9 MB | 100.2 MB |
| Events in quadrant A | 3,872,492 | 664,819 |
| Events in quadrant B | 4,741,820 | 664,092 |
| Events in quadrant C | 3,686,710 | 671,067 |
| Events in quadrant D | 4,397,651 | 625,578 |
| Mode SS | |||
|---|---|---|---|
| Quadrant | BADHDUFLAG | Total packets | Discarded packets |
| A | 0 | 166 | 0 |
| B | 0 | 166 | 0 |
| C | 0 | 166 | 0 |
| D | 0 | 166 | 0 |
| Mode M9 | |||
|---|---|---|---|
| Quadrant | BADHDUFLAG | Total packets | Discarded packets |
| A | 0 | 6 | 0 |
| B | 0 | 6 | 0 |
| C | 0 | 6 | 0 |
| D | 0 | 6 | 0 |
| Mode M0 | |||
|---|---|---|---|
| Quadrant | BADHDUFLAG | Total packets | Discarded packets |
| A | 0 | 16968 | 4 |
| B | 0 | 19550 | 3 |
| C | 0 | 16582 | 3 |
| D | 0 | 18799 | 3 |
| Quadrant | Total seconds | Saturated seconds | Saturation percentage |
|---|---|---|---|
| A | 7991 | 46 | 0.575648% |
| B | 7991 | 364 | 4.555125% |
| C | 7991 | 55 | 0.688274% |
| D | 7991 | 254 | 3.178576% |
Noise dominated data is calculated using 1-second bins in cleaned event files. If a bin has >2000 counts, and if more than 50% of those come from <1% of pixels, then it is considered to be noise-dominated and hence unusable.
| Quadrant | # 1 sec bins | Bins with >0 counts | Bins with >2000 counts | High rate bins dominated by noise | Noise dominated (total time) | Noise dominated (detector-on time) | Marked lightcurve |
|---|---|---|---|---|---|---|---|
| A | 8697 | 7994 | 0 | 0 | 0.00% | 0.00% |  |
| B | 8697 | 7994 | 104 | 104 | 1.20% | 1.30% | 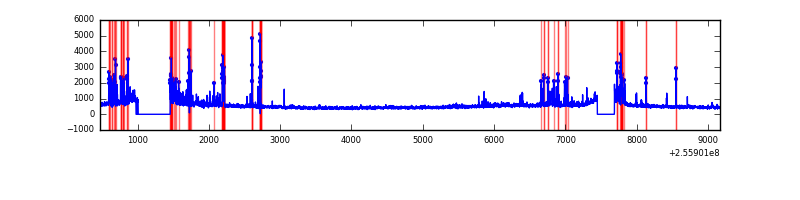 |
| C | 8697 | 7994 | 0 | 0 | 0.00% | 0.00% |  |
| D | 8697 | 7994 | 179 | 179 | 2.06% | 2.24% | 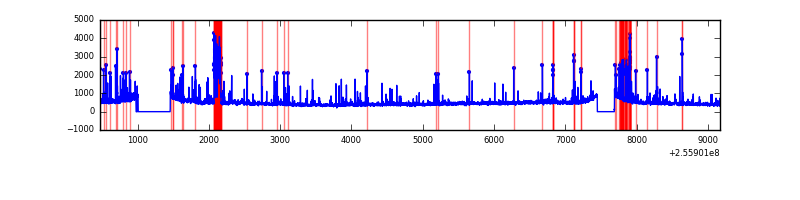 |
Top three noisy pixels from each quadrant. If the there are fewer than three noisy pixels in the level2.evt file, extra rows are filled as -1
| Pixel properties | Quadrant properties | ||||||
|---|---|---|---|---|---|---|---|
| Quadrant | DetID | PixID | Counts | Sigma | Mean | Median | Sigma |
| A | 12 | 189 | 171964 | 868.37 | 962 | 942 | 196.9 |
| A | 0 | 226 | 8658 | 39.18 | 962 | 942 | 196.9 |
| A | 12 | 194 | 7307 | 32.32 | 962 | 942 | 196.9 |
| B | 4 | 239 | 560218 | 3051.51 | 951 | 927 | 183.3 |
| B | 0 | 219 | 272022 | 1479.1 | 951 | 927 | 183.3 |
| B | 3 | 64 | 114990 | 622.33 | 951 | 927 | 183.3 |
| C | 13 | 61 | 6834 | 26.7 | 944 | 948 | 220.5 |
| C | 8 | 128 | 4459 | 15.92 | 944 | 948 | 220.5 |
| C | 8 | 112 | 2482 | 6.96 | 944 | 948 | 220.5 |
| D | 1 | 52 | 676693 | 3006.08 | 918 | 892 | 224.8 |
| D | 8 | 195 | 160393 | 709.49 | 918 | 892 | 224.8 |
| D | 13 | 172 | 44218 | 192.72 | 918 | 892 | 224.8 |
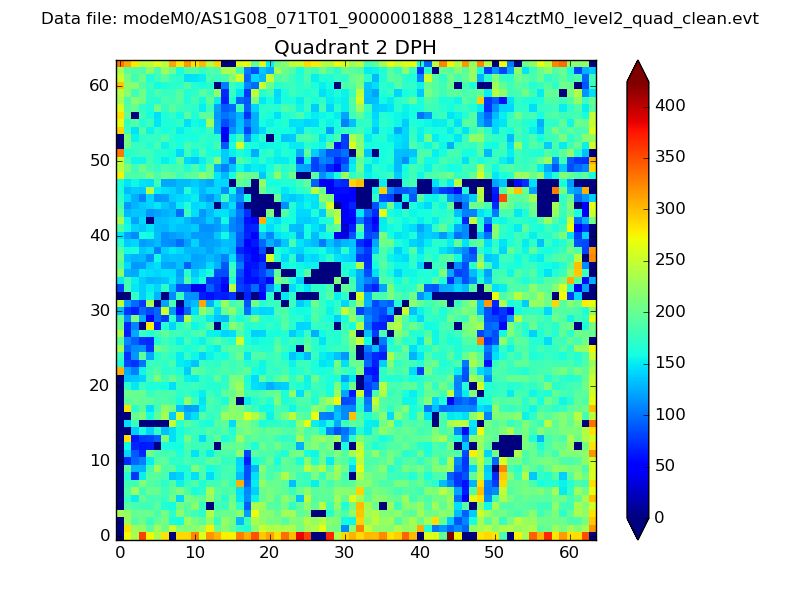
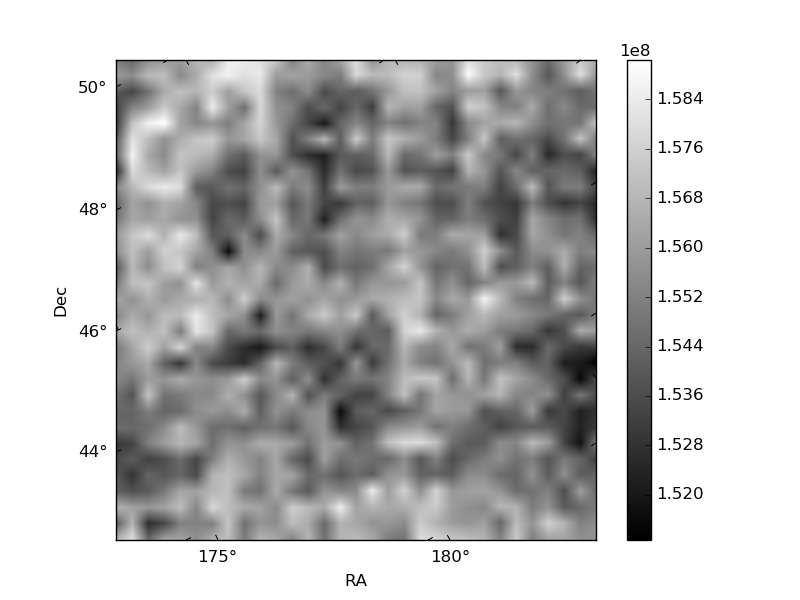
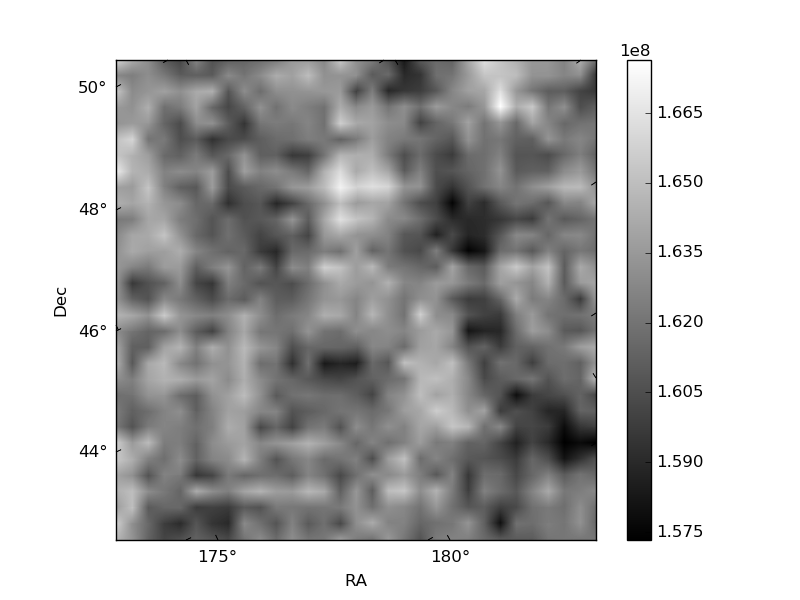
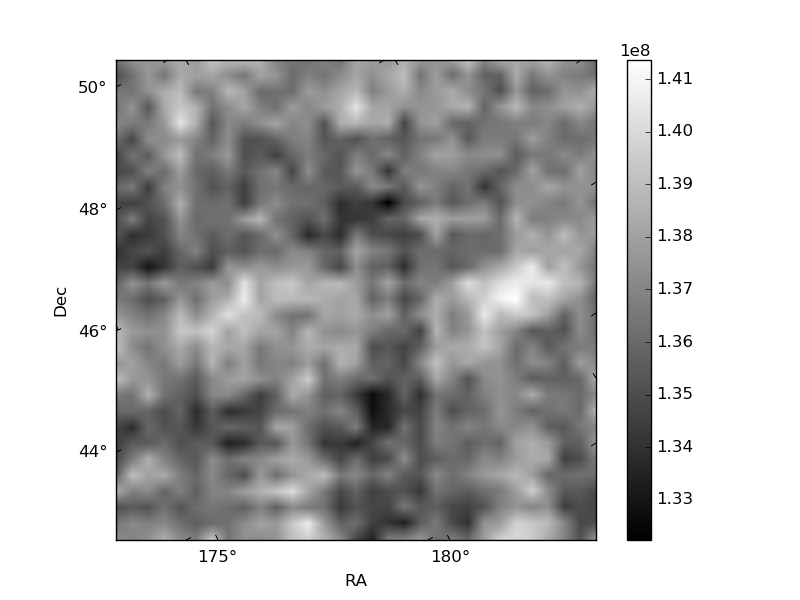
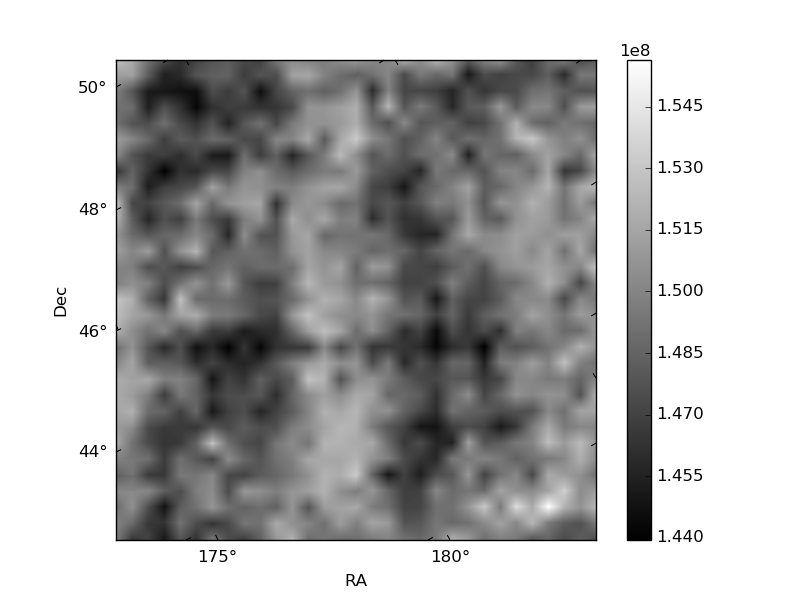
Histogram calculated using DETX and DETY for each event in the final _common_clean file
| Quadrant A | 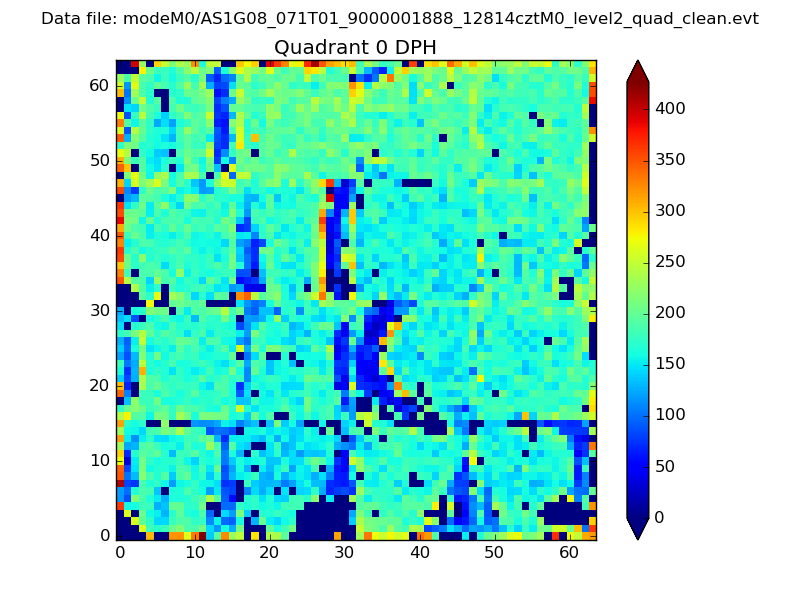 |
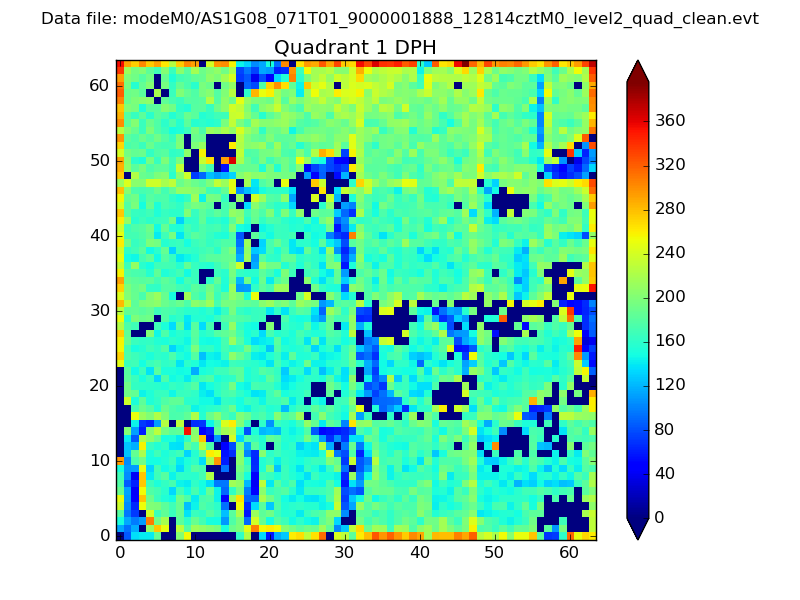 |
Quadrant B |
|---|---|---|---|
| Quadrant D | 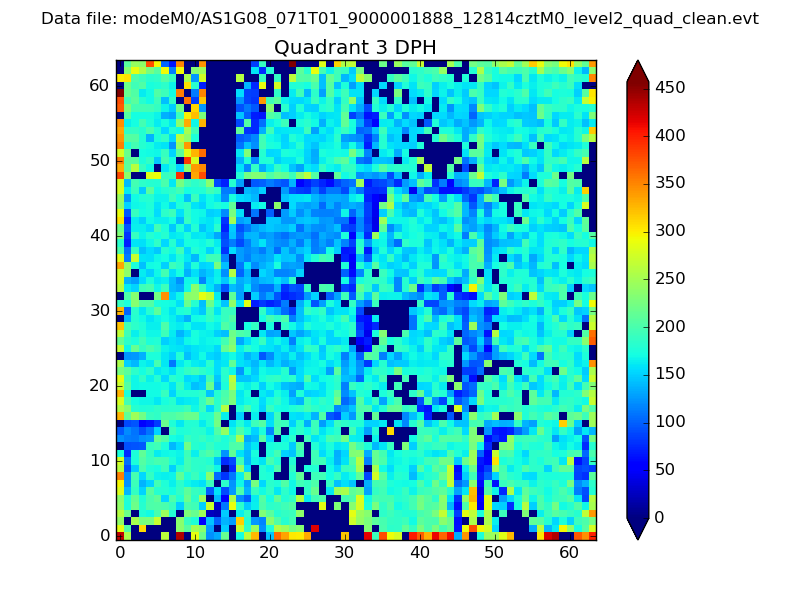 |
 |
Quadrant C |
| Plot type | Count rate plots | Images |
|---|---|---|
| Comparison with Poisson distribution Blue bars denote a histogram of data divided into 1 sec bins. Red curve is a Poisson curve with rate = median count rate of data. |
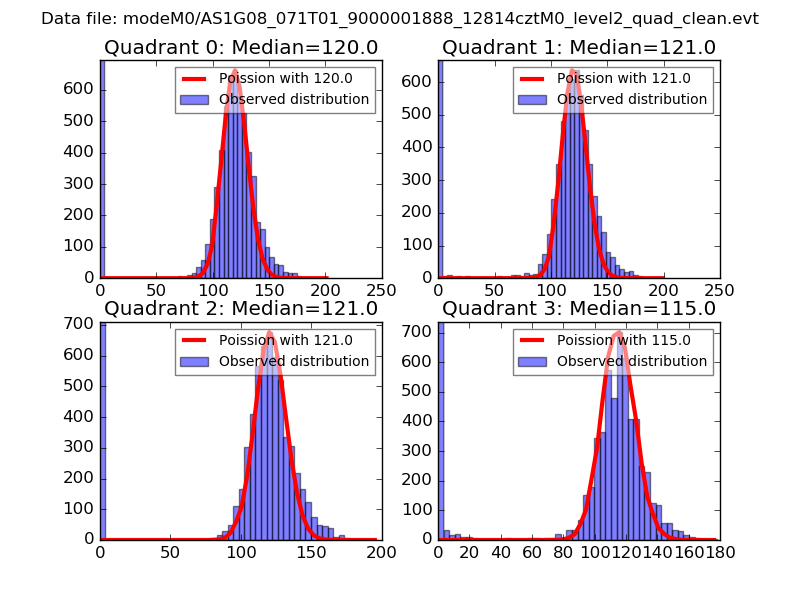 |
 |
| Quadrant-wise count rates Data is divided into 100 sec bins |
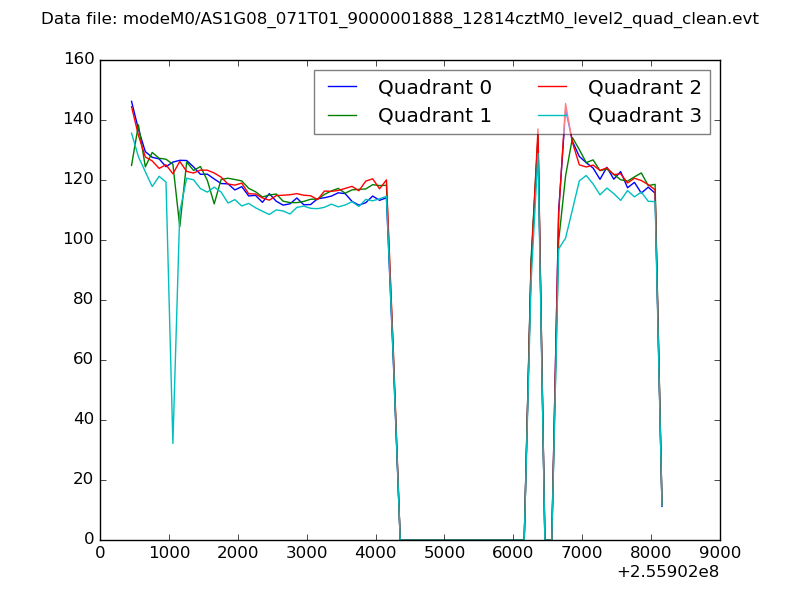 |
|
| Module-wise count rates for Quadrant A Data is divided into 100 sec bins |
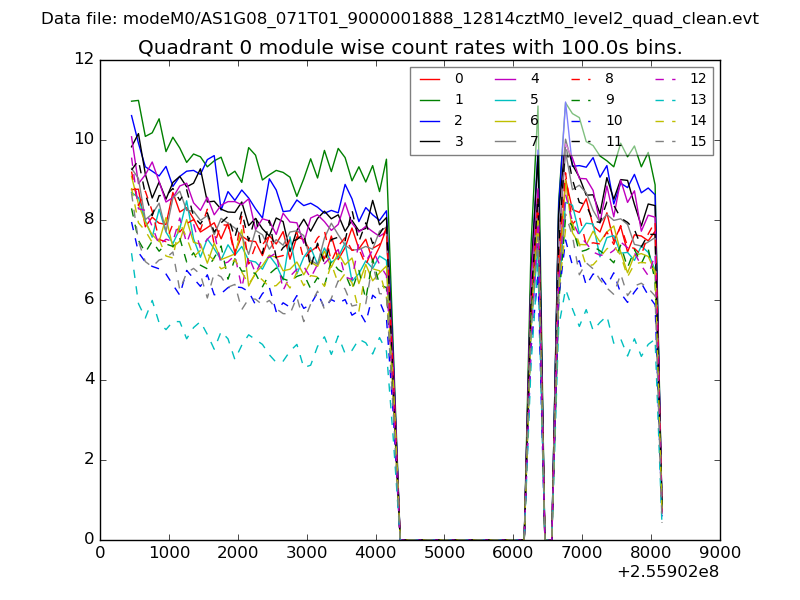 |
 |
| Module-wise count rates for Quadrant B Data is divided into 100 sec bins |
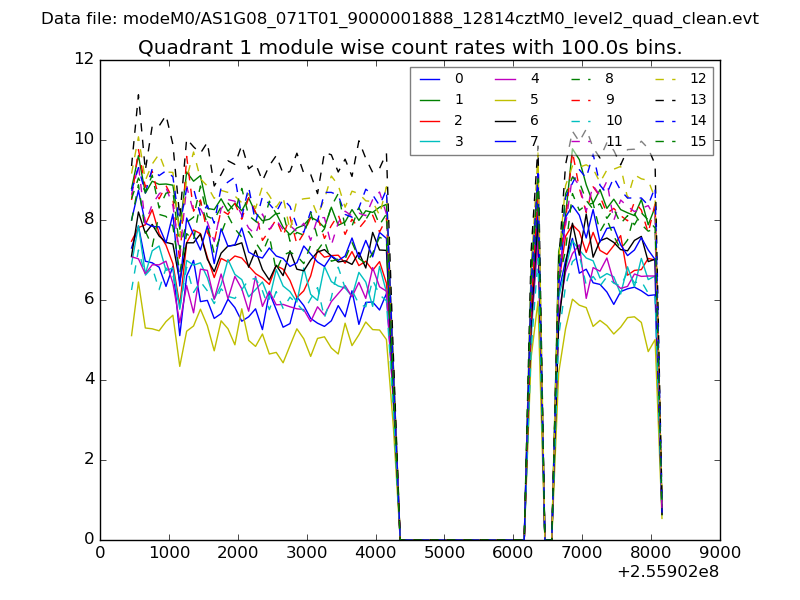 |
 |
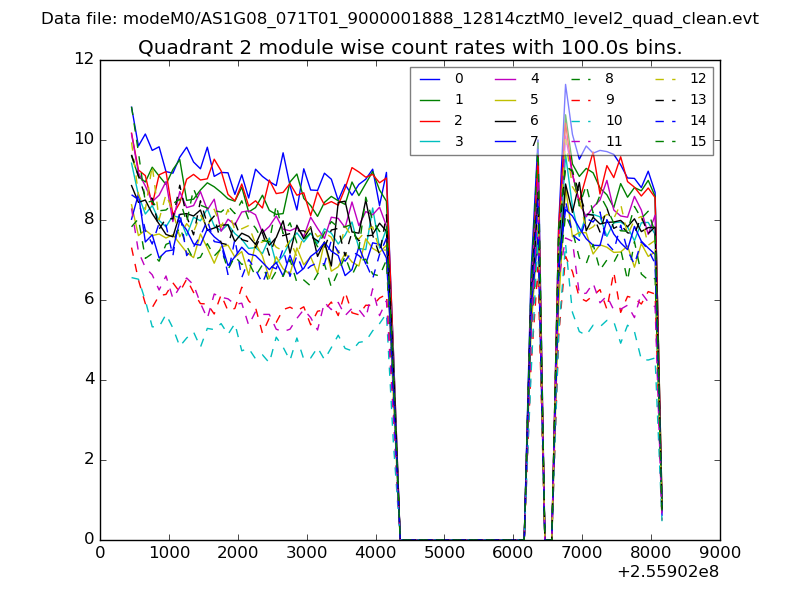
| Module-wise count rates for Quadrant C Data is divided into 100 sec bins |
 |
 |
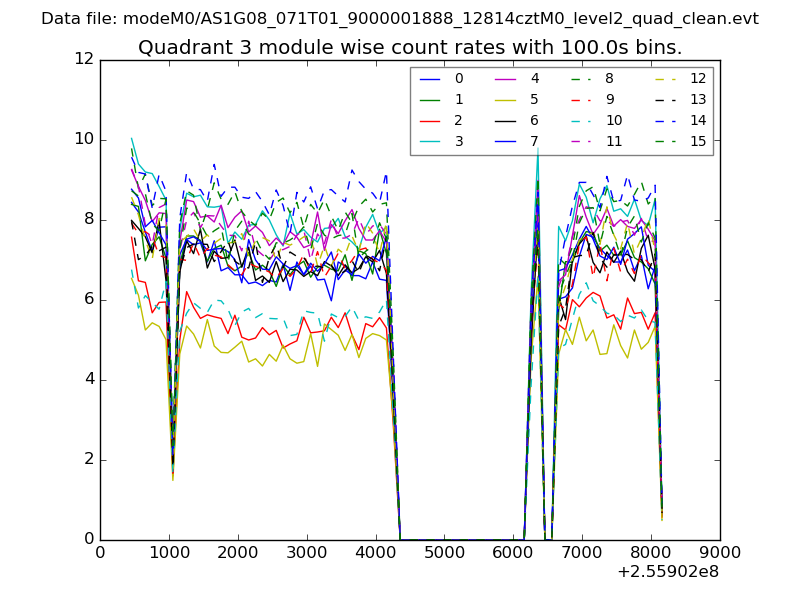
| Module-wise count rates for Quadrant D Data is divided into 100 sec bins |
 |
 |
| Parameter | Plot |
|---|---|
| CZT HV Monitor | 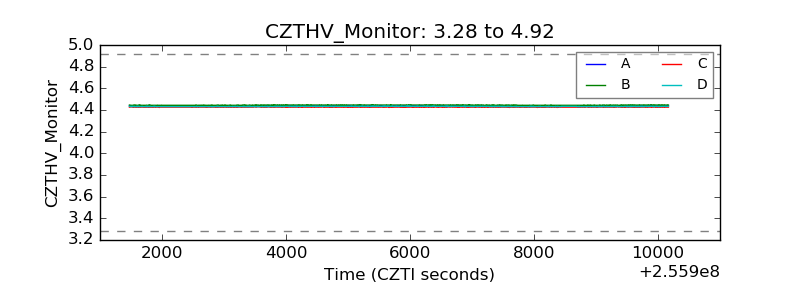 |
| D_VDD | 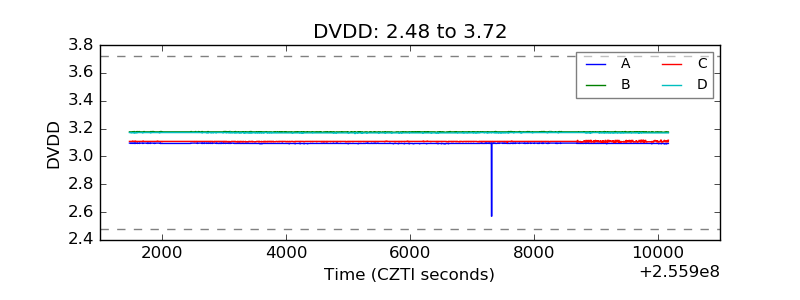 |
| Temperature 1 | 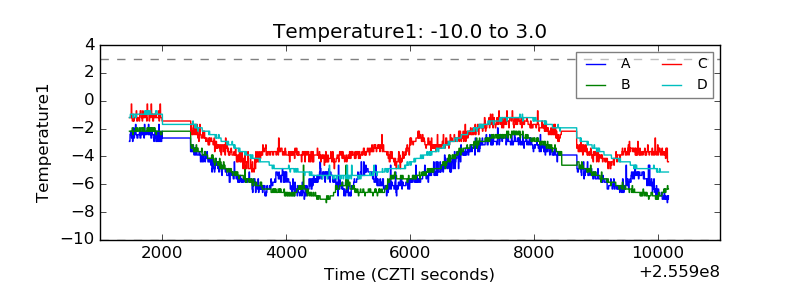 |
| Veto HV Monitor | 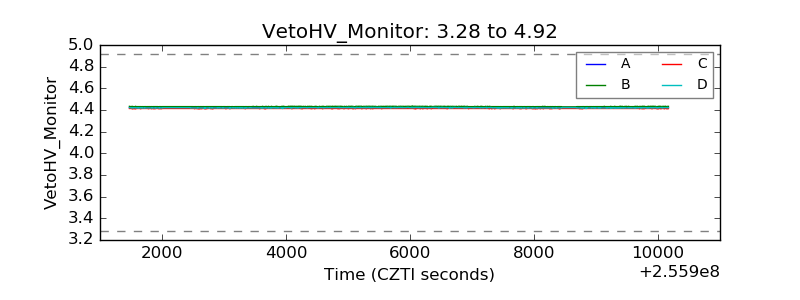 |
| Veto LLD | 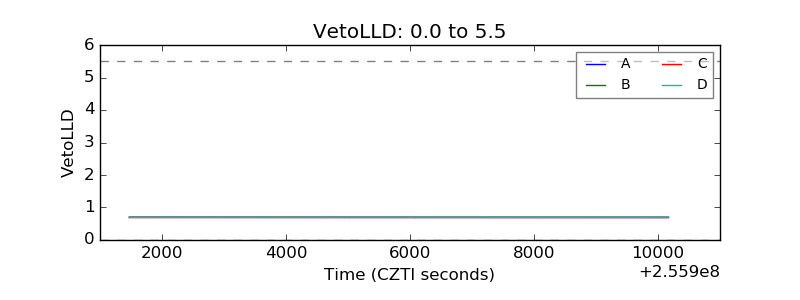 |
| Alpha Counter | 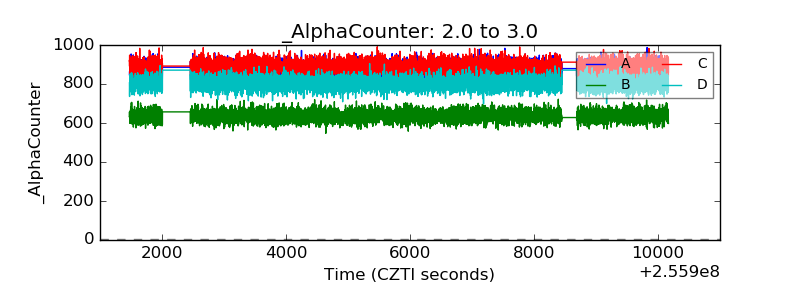 |
| _CPM_Rate | 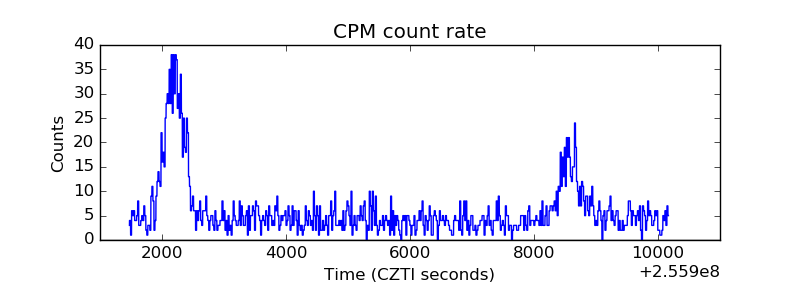 |
| CZT Counter | 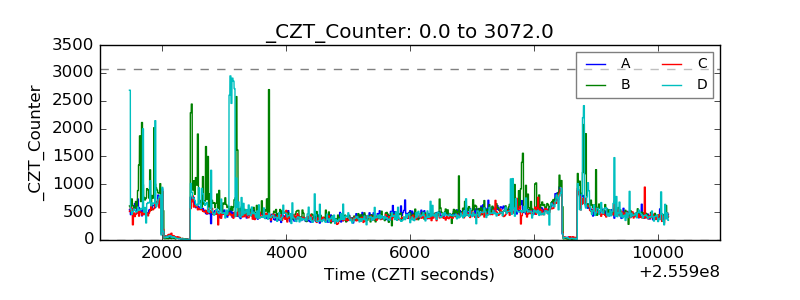 |
| +2.5 Volts monitor |  |
| +5 Volts monitor |  |
| _ROLL_ROT | 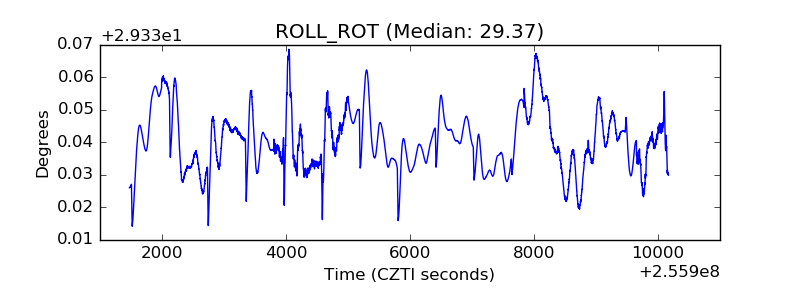 |
| _Roll_DEC | 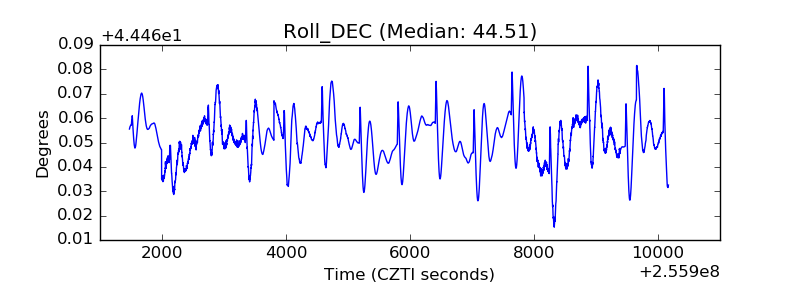 |
| _Roll_RA | 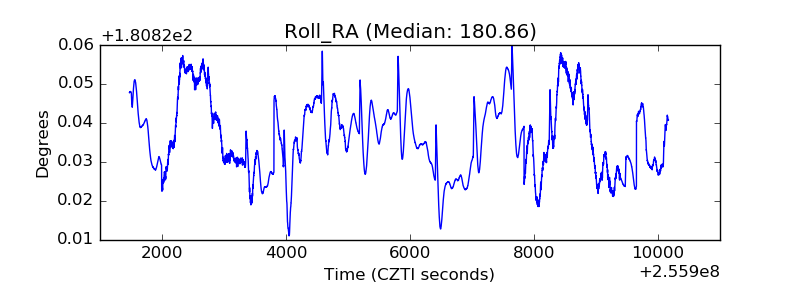 |
| Veto Counter | 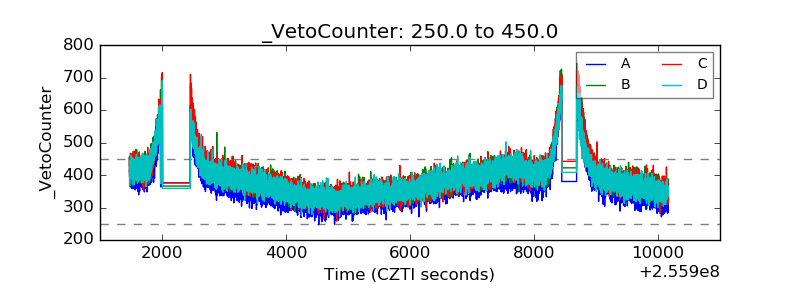 |