| Param | Original file | Final file |
|---|---|---|
| Filename | modeM0/AS1G08_071T01_9000001888_12815cztM0_level2.evt | modeM0/AS1G08_071T01_9000001888_12815cztM0_level2_quad_clean.evt |
| Size (bytes) | 526,864,320 | 108,097,920 |
| Size | 502.5 MB | 103.1 MB |
| Events in quadrant A | 3,659,493 | 689,677 |
| Events in quadrant B | 4,361,624 | 685,133 |
| Events in quadrant C | 3,504,893 | 697,664 |
| Events in quadrant D | 3,904,624 | 663,068 |
| Mode SS | |||
|---|---|---|---|
| Quadrant | BADHDUFLAG | Total packets | Discarded packets |
| A | 0 | 160 | 0 |
| B | 0 | 160 | 0 |
| C | 0 | 160 | 0 |
| D | 0 | 160 | 0 |
| Mode M9 | |||
|---|---|---|---|
| Quadrant | BADHDUFLAG | Total packets | Discarded packets |
| A | 0 | 5 | 0 |
| B | 0 | 5 | 0 |
| C | 0 | 5 | 0 |
| D | 0 | 5 | 0 |
| Mode M0 | |||
|---|---|---|---|
| Quadrant | BADHDUFLAG | Total packets | Discarded packets |
| A | 0 | 16375 | 3 |
| B | 0 | 18227 | 2 |
| C | 0 | 16032 | 2 |
| D | 0 | 17432 | 2 |
| Quadrant | Total seconds | Saturated seconds | Saturation percentage |
|---|---|---|---|
| A | 7731 | 77 | 0.995990% |
| B | 7731 | 396 | 5.122235% |
| C | 7731 | 66 | 0.853706% |
| D | 7731 | 166 | 2.147200% |
Noise dominated data is calculated using 1-second bins in cleaned event files. If a bin has >2000 counts, and if more than 50% of those come from <1% of pixels, then it is considered to be noise-dominated and hence unusable.
| Quadrant | # 1 sec bins | Bins with >0 counts | Bins with >2000 counts | High rate bins dominated by noise | Noise dominated (total time) | Noise dominated (detector-on time) | Marked lightcurve |
|---|---|---|---|---|---|---|---|
| A | 8293 | 7735 | 0 | 0 | 0.00% | 0.00% | 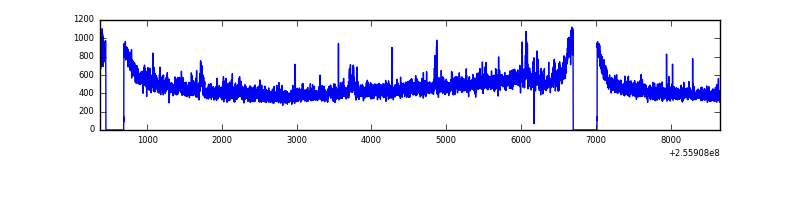 |
| B | 8293 | 7735 | 139 | 139 | 1.68% | 1.80% | 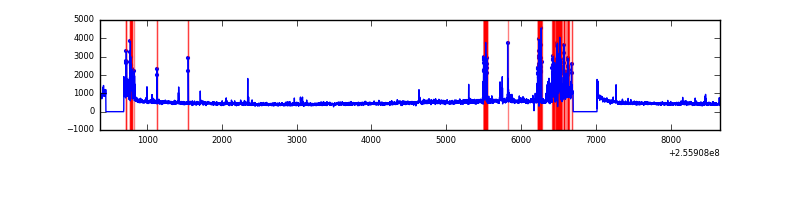 |
| C | 8293 | 7735 | 0 | 0 | 0.00% | 0.00% | 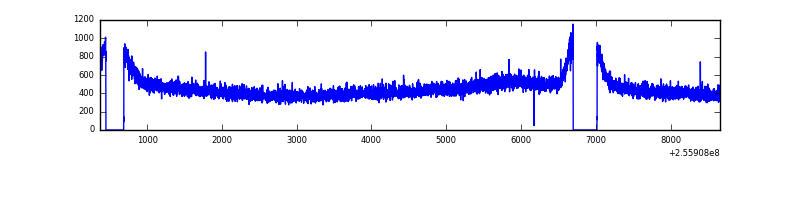 |
| D | 8293 | 7735 | 102 | 102 | 1.23% | 1.32% | 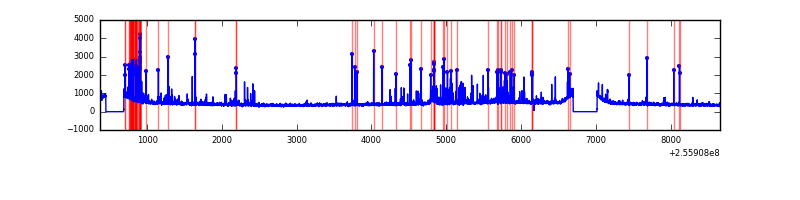 |
Top three noisy pixels from each quadrant. If the there are fewer than three noisy pixels in the level2.evt file, extra rows are filled as -1
| Pixel properties | Quadrant properties | ||||||
|---|---|---|---|---|---|---|---|
| Quadrant | DetID | PixID | Counts | Sigma | Mean | Median | Sigma |
| A | 12 | 189 | 148671 | 787.72 | 912 | 892 | 187.6 |
| A | 0 | 226 | 8006 | 37.92 | 912 | 892 | 187.6 |
| A | 12 | 194 | 6905 | 32.05 | 912 | 892 | 187.6 |
| B | 4 | 239 | 586617 | 3386.82 | 899 | 873 | 172.9 |
| B | 0 | 219 | 180331 | 1037.64 | 899 | 873 | 172.9 |
| B | 3 | 64 | 25664 | 143.34 | 899 | 873 | 172.9 |
| C | 8 | 128 | 8265 | 35.36 | 895 | 901 | 208.3 |
| C | 13 | 61 | 6521 | 26.98 | 895 | 901 | 208.3 |
| C | 8 | 112 | 4323 | 16.43 | 895 | 901 | 208.3 |
| D | 1 | 52 | 346225 | 1627.96 | 877 | 848 | 212.2 |
| D | 8 | 195 | 140733 | 659.36 | 877 | 848 | 212.2 |
| D | 2 | 136 | 72626 | 338.33 | 877 | 848 | 212.2 |
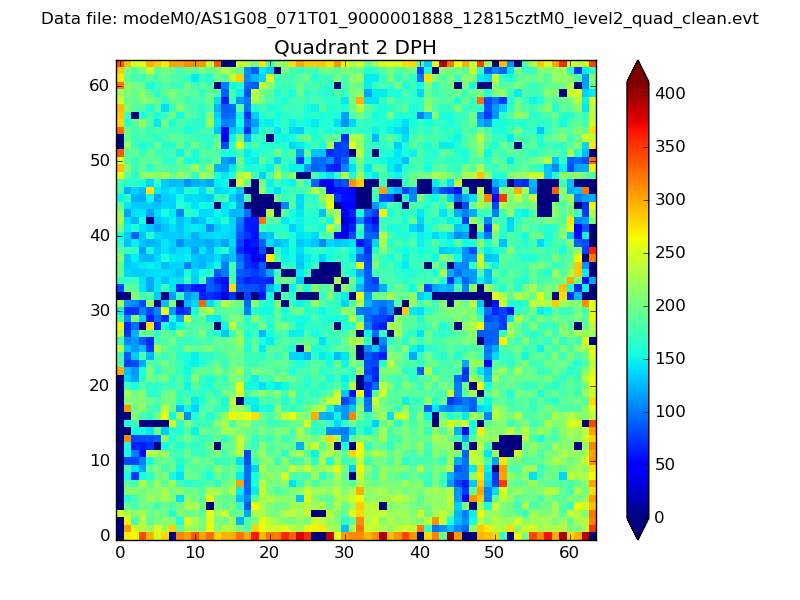
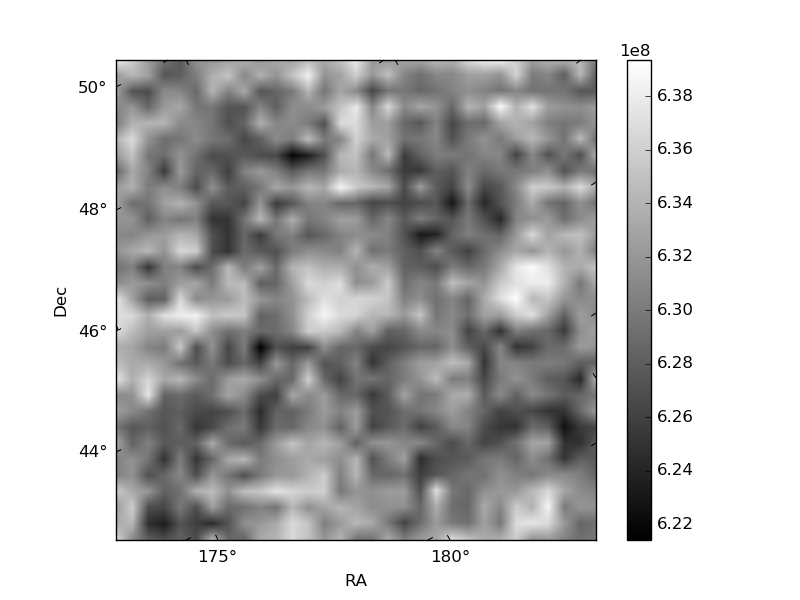
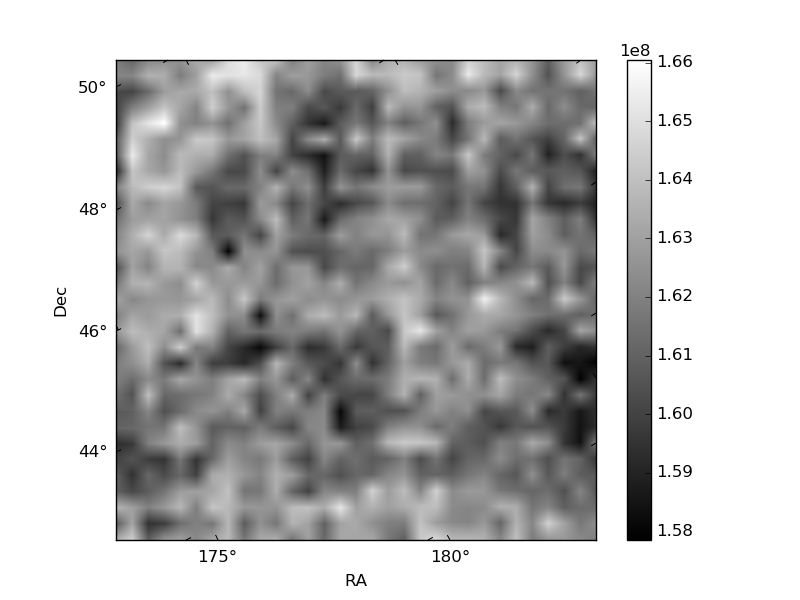
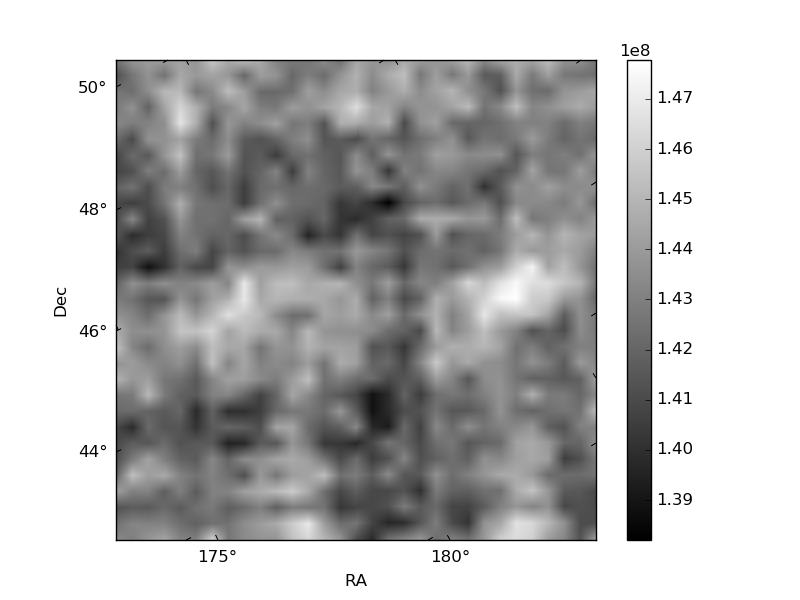
Histogram calculated using DETX and DETY for each event in the final _common_clean file
| Quadrant A | 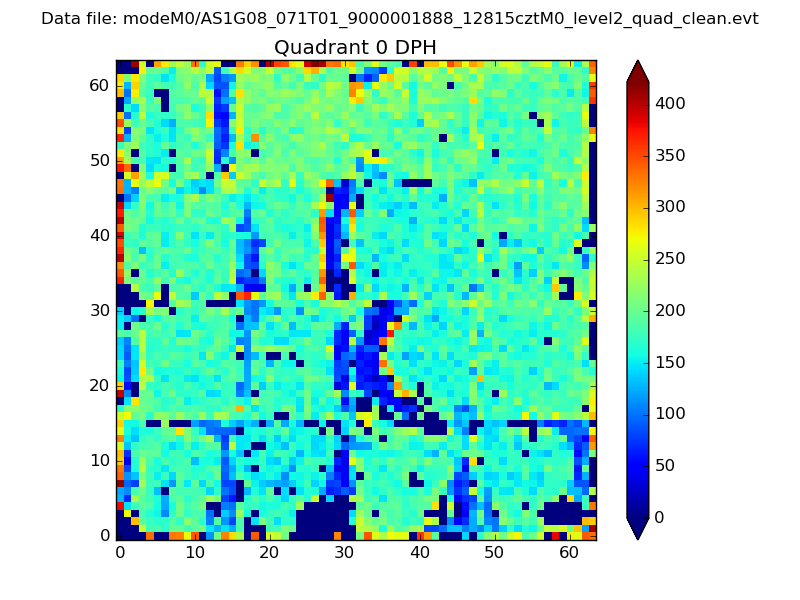 |
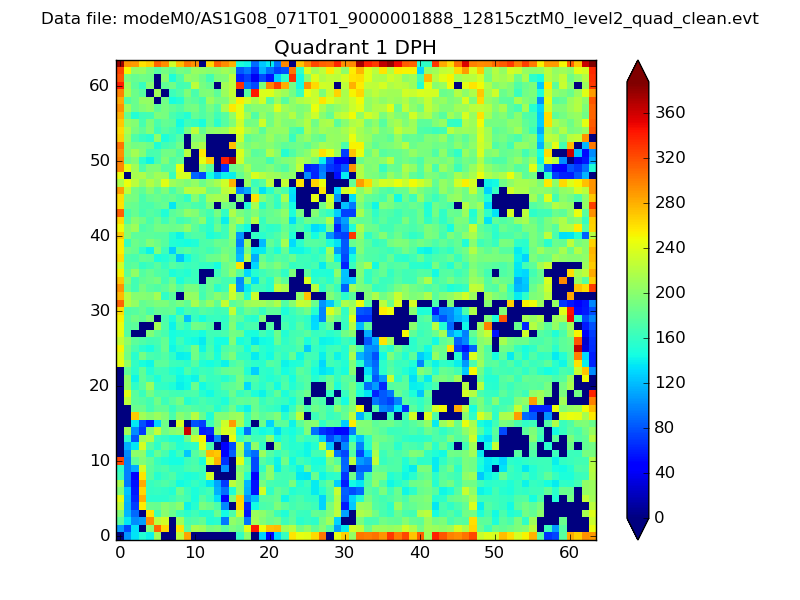 |
Quadrant B |
|---|---|---|---|
| Quadrant D | 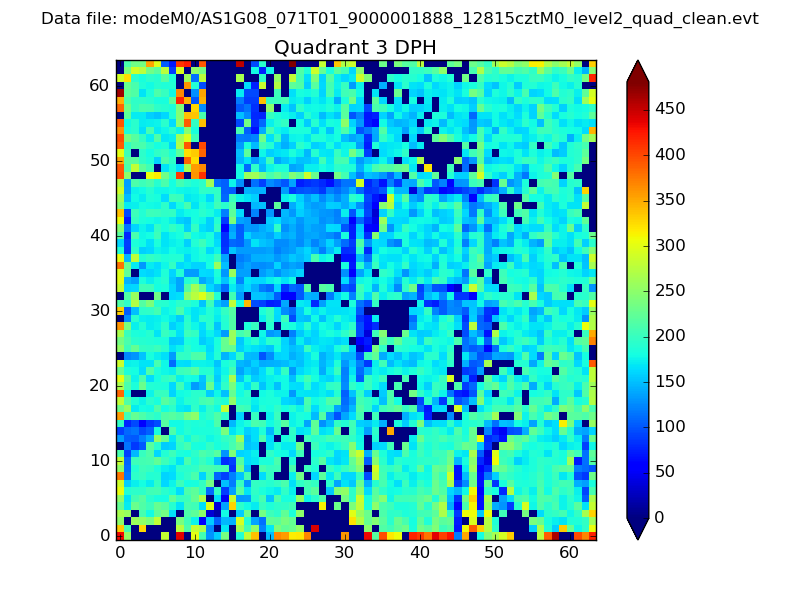 |
 |
Quadrant C |
| Plot type | Count rate plots | Images |
|---|---|---|
| Comparison with Poisson distribution Blue bars denote a histogram of data divided into 1 sec bins. Red curve is a Poisson curve with rate = median count rate of data. |
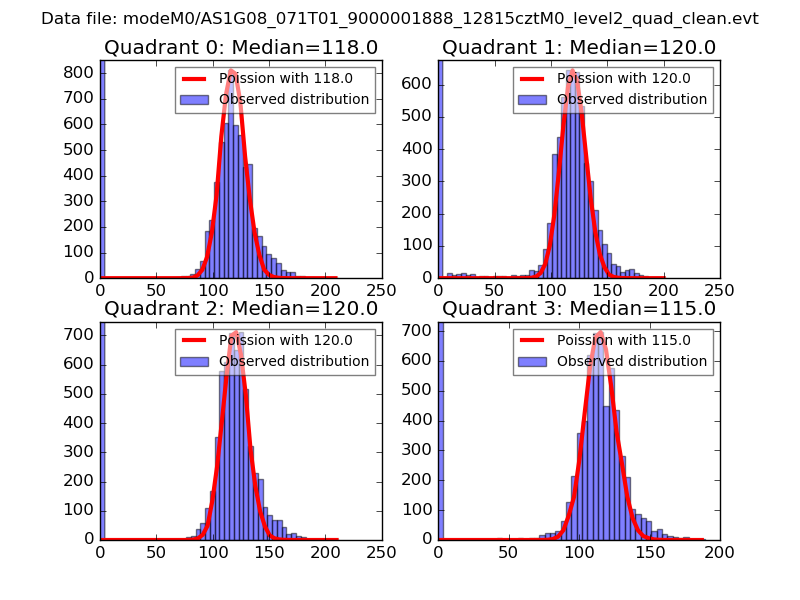 |
 |
| Quadrant-wise count rates Data is divided into 100 sec bins |
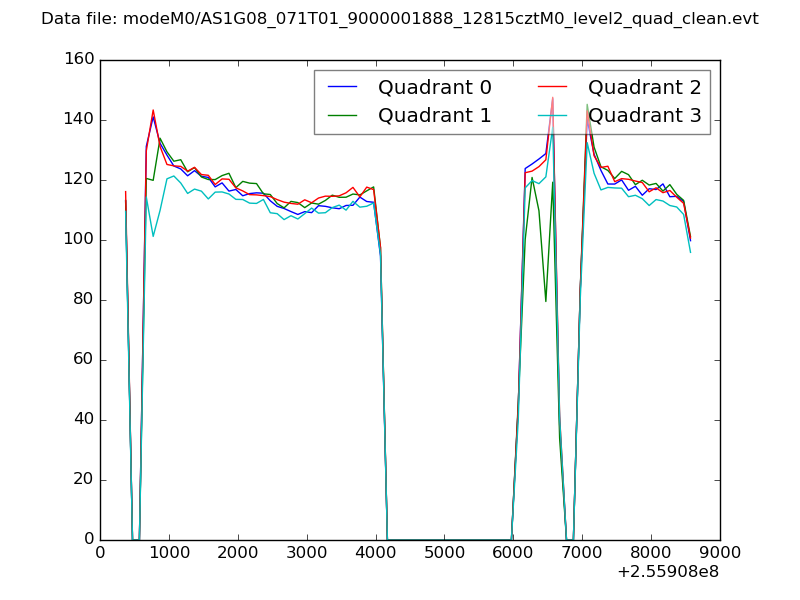 |
|
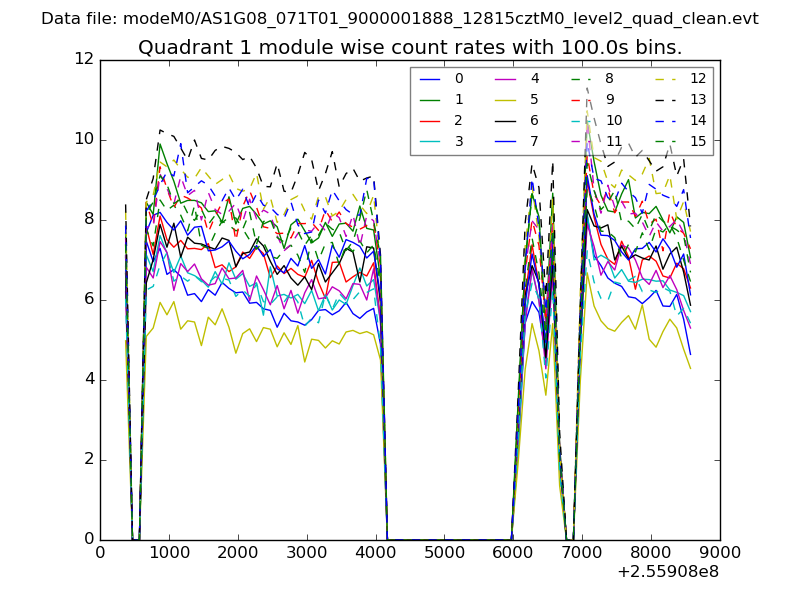
| Module-wise count rates for Quadrant A Data is divided into 100 sec bins |
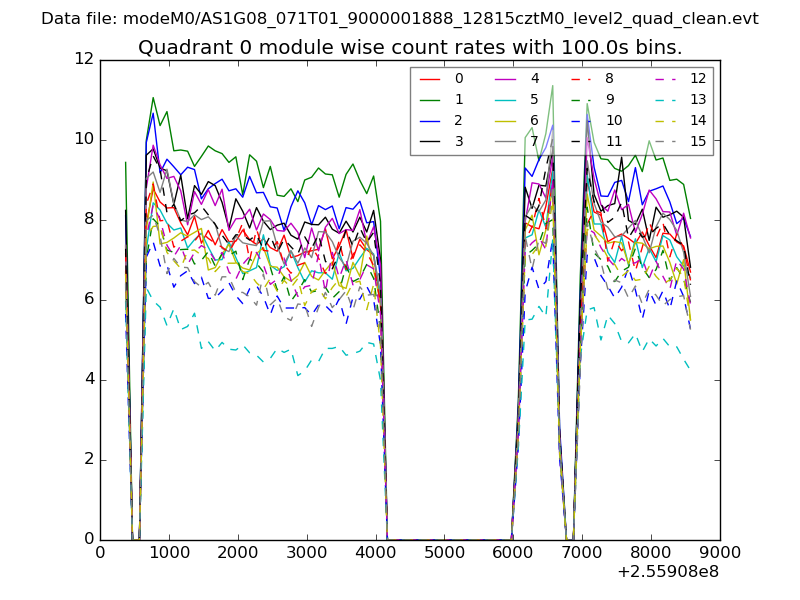 |
 |
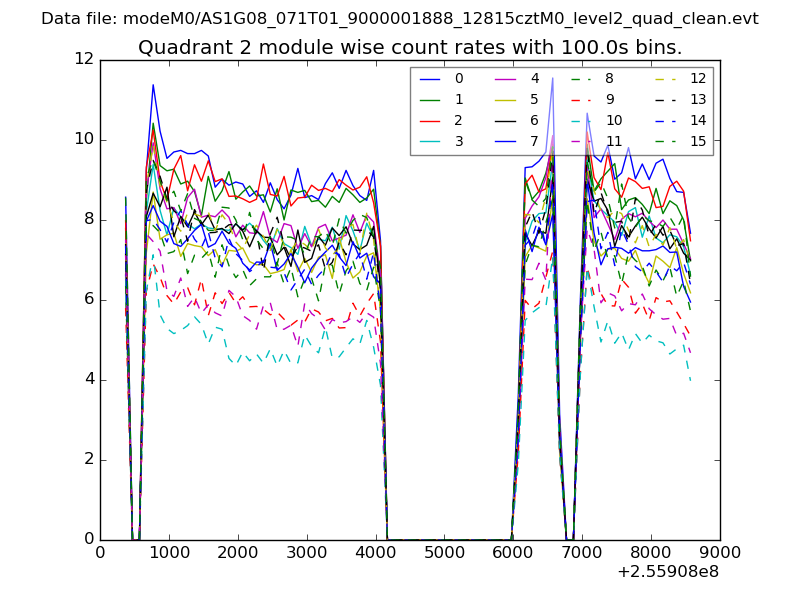
| Module-wise count rates for Quadrant B Data is divided into 100 sec bins |
 |
 |
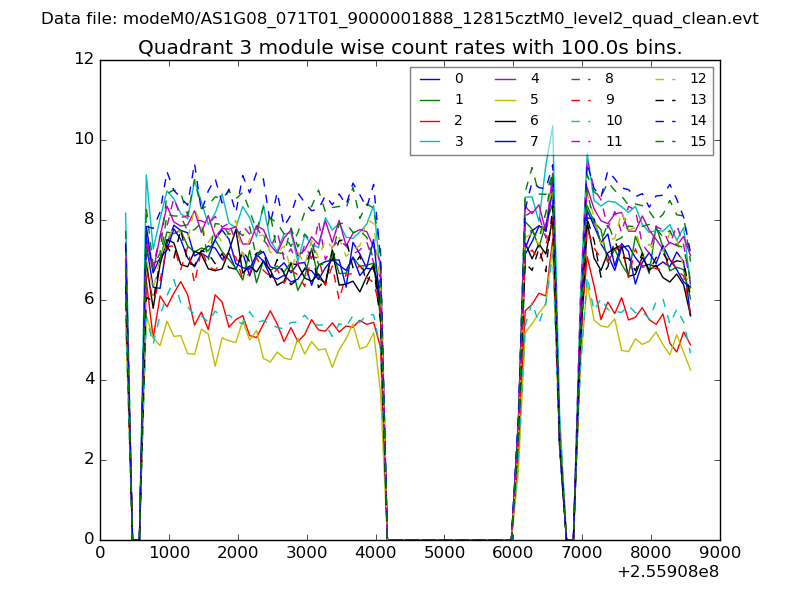
| Module-wise count rates for Quadrant C Data is divided into 100 sec bins |
 |
 |
| Module-wise count rates for Quadrant D Data is divided into 100 sec bins |
 |
 |
| Parameter | Plot |
|---|---|
| CZT HV Monitor | 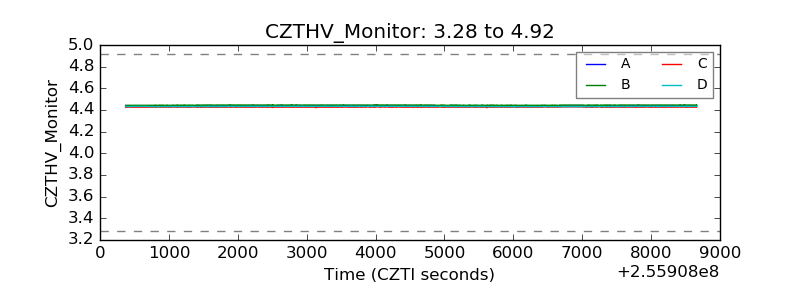 |
| D_VDD |  |
| Temperature 1 | 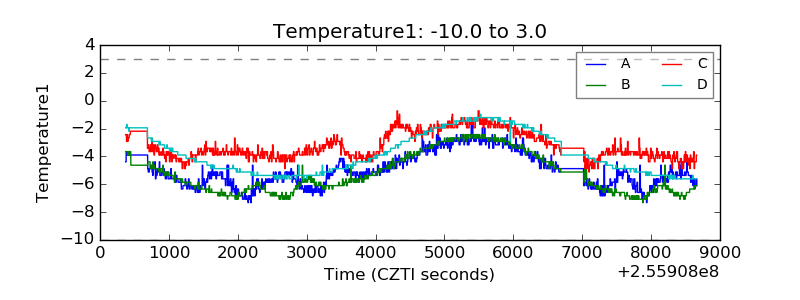 |
| Veto HV Monitor |  |
| Veto LLD |  |
| Alpha Counter | 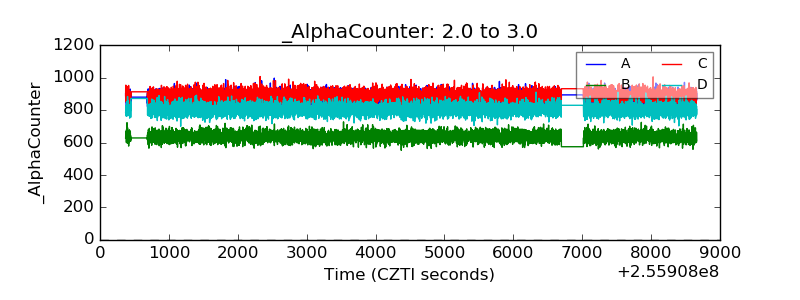 |
| _CPM_Rate | 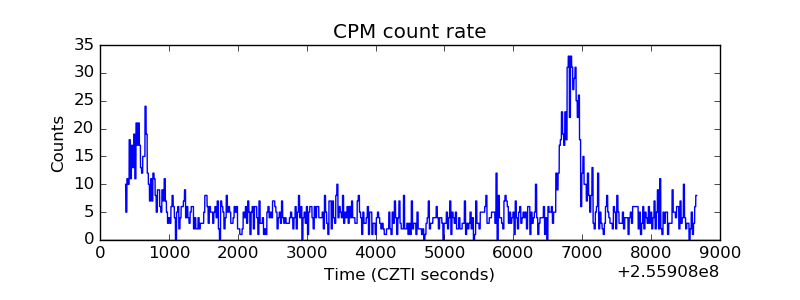 |
| CZT Counter | 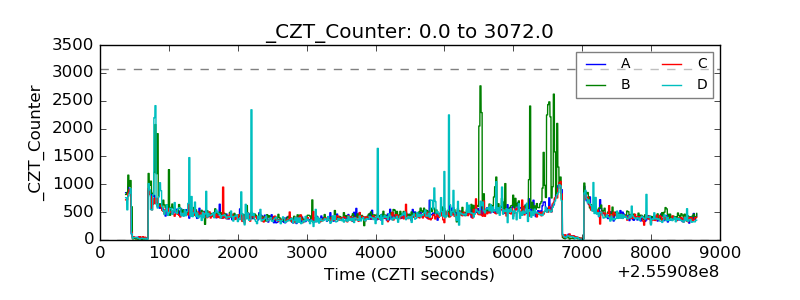 |
| +2.5 Volts monitor |  |
| +5 Volts monitor |  |
| _ROLL_ROT | 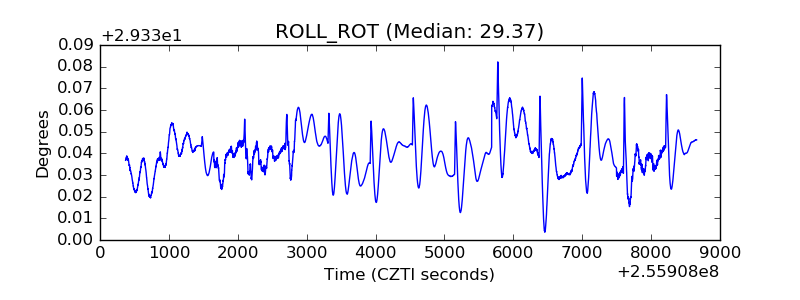 |
| _Roll_DEC | 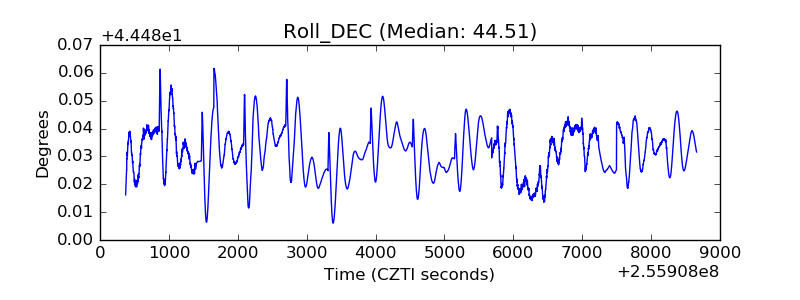 |
| _Roll_RA | 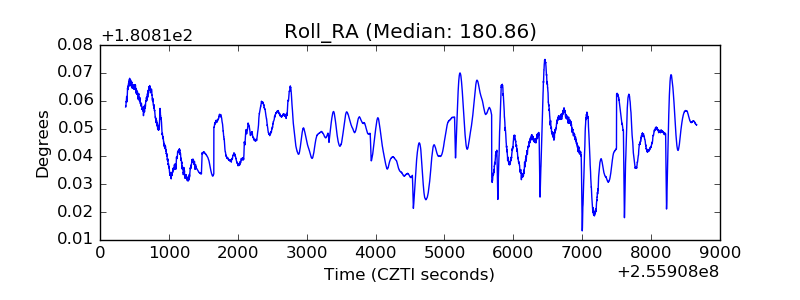 |
| Veto Counter | 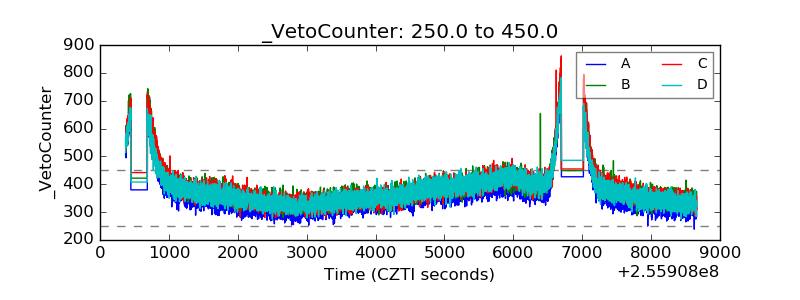 |