| Param | Original file | Final file |
|---|---|---|
| Filename | modeM0/AS1G08_071T01_9000001888_12819cztM0_level2.evt | modeM0/AS1G08_071T01_9000001888_12819cztM0_level2_quad_clean.evt |
| Size (bytes) | 459,927,360 | 89,988,480 |
| Size | 438.6 MB | 85.8 MB |
| Events in quadrant A | 3,270,917 | 570,367 |
| Events in quadrant B | 3,890,443 | 570,931 |
| Events in quadrant C | 2,977,609 | 570,759 |
| Events in quadrant D | 3,335,833 | 547,368 |
| Mode SS | |||
|---|---|---|---|
| Quadrant | BADHDUFLAG | Total packets | Discarded packets |
| A | 0 | 136 | 0 |
| B | 0 | 136 | 0 |
| C | 0 | 136 | 0 |
| D | 0 | 136 | 0 |
| Mode M9 | |||
|---|---|---|---|
| Quadrant | BADHDUFLAG | Total packets | Discarded packets |
| A | 0 | 13 | 0 |
| B | 0 | 13 | 0 |
| C | 0 | 13 | 0 |
| D | 0 | 14 | 0 |
| Mode M0 | |||
|---|---|---|---|
| Quadrant | BADHDUFLAG | Total packets | Discarded packets |
| A | 0 | 13771 | 3 |
| B | 0 | 15697 | 2 |
| C | 0 | 13478 | 2 |
| D | 0 | 14497 | 2 |
| Quadrant | Total seconds | Saturated seconds | Saturation percentage |
|---|---|---|---|
| A | 6679 | 46 | 0.688726% |
| B | 6679 | 283 | 4.237161% |
| C | 6679 | 24 | 0.359335% |
| D | 6679 | 84 | 1.257673% |
Noise dominated data is calculated using 1-second bins in cleaned event files. If a bin has >2000 counts, and if more than 50% of those come from <1% of pixels, then it is considered to be noise-dominated and hence unusable.
| Quadrant | # 1 sec bins | Bins with >0 counts | Bins with >2000 counts | High rate bins dominated by noise | Noise dominated (total time) | Noise dominated (detector-on time) | Marked lightcurve |
|---|---|---|---|---|---|---|---|
| A | 7685 | 6681 | 0 | 0 | 0.00% | 0.00% | 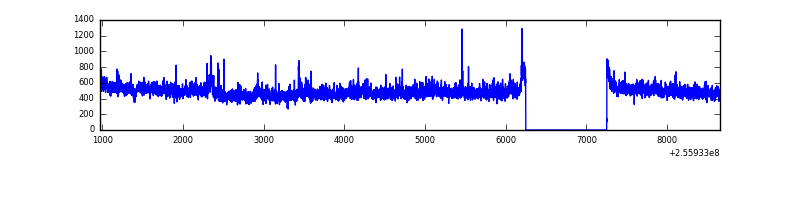 |
| B | 7685 | 6681 | 140 | 140 | 1.82% | 2.10% | 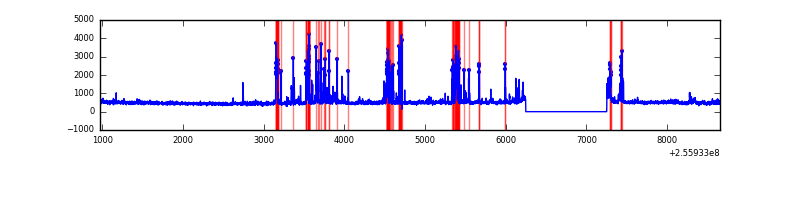 |
| C | 7685 | 6681 | 0 | 0 | 0.00% | 0.00% | 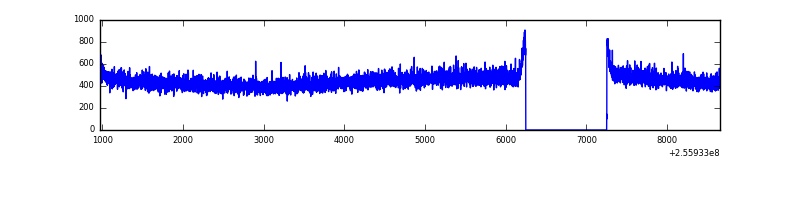 |
| D | 7685 | 6681 | 54 | 54 | 0.70% | 0.81% | 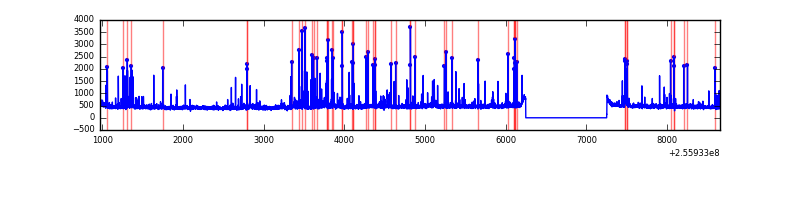 |
Top three noisy pixels from each quadrant. If the there are fewer than three noisy pixels in the level2.evt file, extra rows are filled as -1
| Pixel properties | Quadrant properties | ||||||
|---|---|---|---|---|---|---|---|
| Quadrant | DetID | PixID | Counts | Sigma | Mean | Median | Sigma |
| A | 12 | 189 | 106512 | 649.04 | 796 | 780 | 162.9 |
| A | 15 | 222 | 106084 | 646.41 | 796 | 780 | 162.9 |
| A | 0 | 226 | 7040 | 38.42 | 796 | 780 | 162.9 |
| B | 4 | 239 | 562087 | 3742.2 | 781 | 761 | 150.0 |
| B | 3 | 64 | 107539 | 711.86 | 781 | 761 | 150.0 |
| B | 0 | 219 | 90487 | 598.18 | 781 | 761 | 150.0 |
| C | 13 | 61 | 5725 | 27.88 | 763 | 765 | 177.9 |
| C | 3 | 202 | 1835 | 6.02 | 763 | 765 | 177.9 |
| C | -1 | -1 | -1 | -1.0 | 763 | 765 | 177.9 |
| D | 8 | 195 | 147594 | 808.66 | 762 | 740 | 181.6 |
| D | 1 | 52 | 135671 | 743.0 | 762 | 740 | 181.6 |
| D | 2 | 136 | 73908 | 402.9 | 762 | 740 | 181.6 |
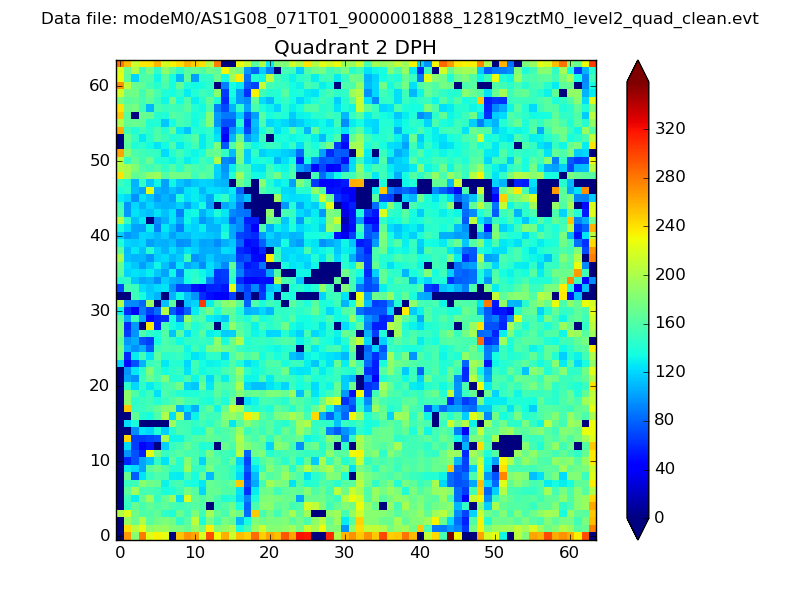
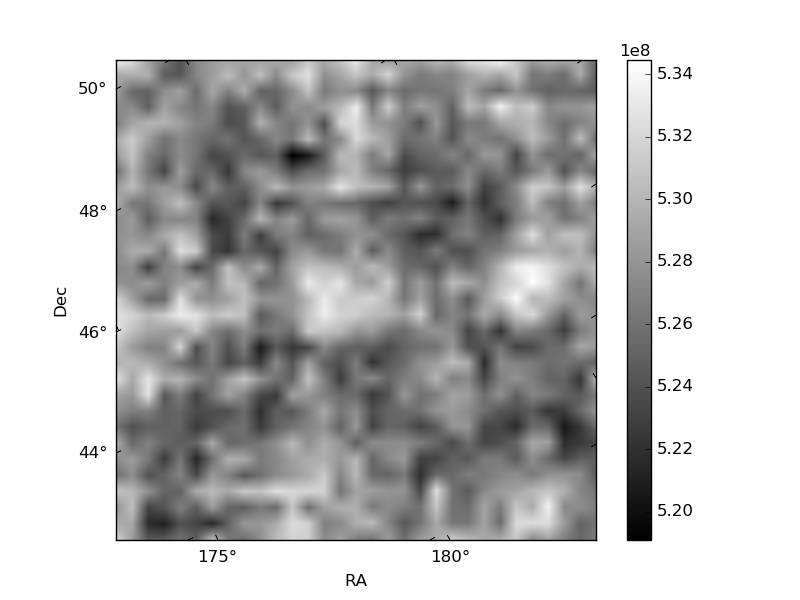
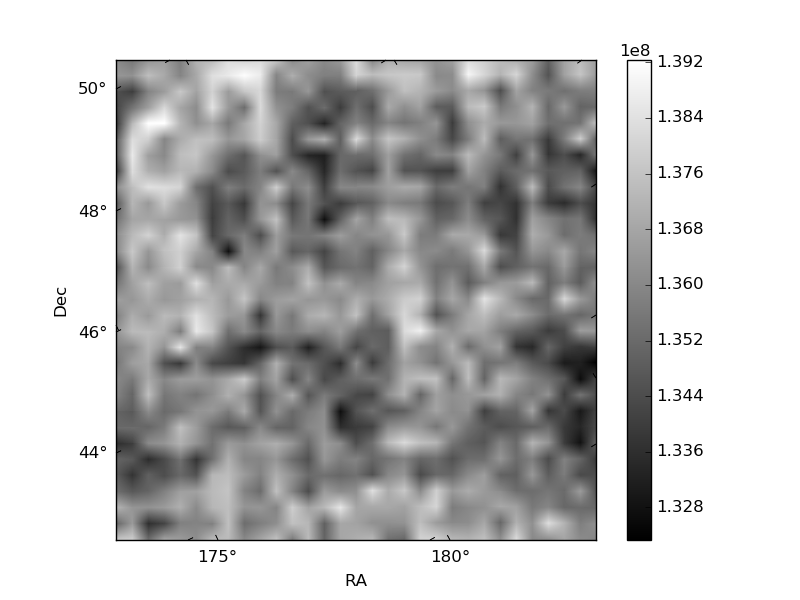
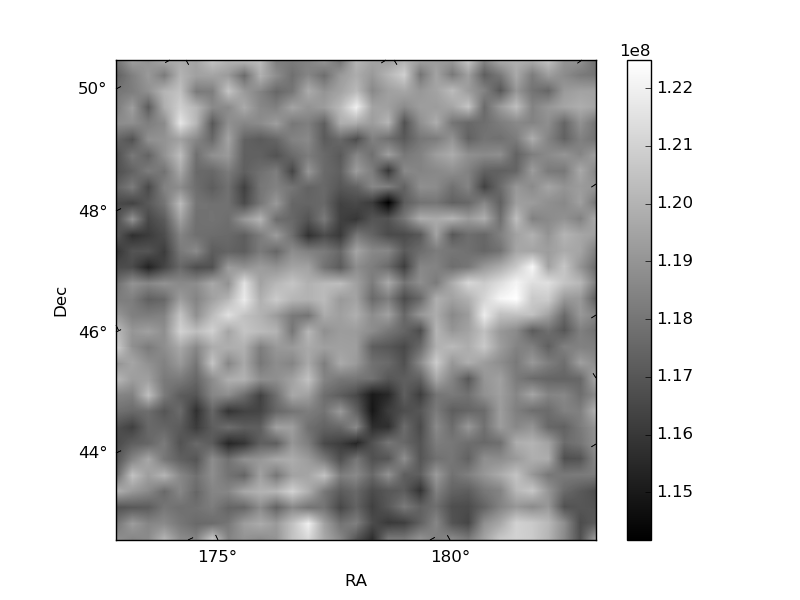
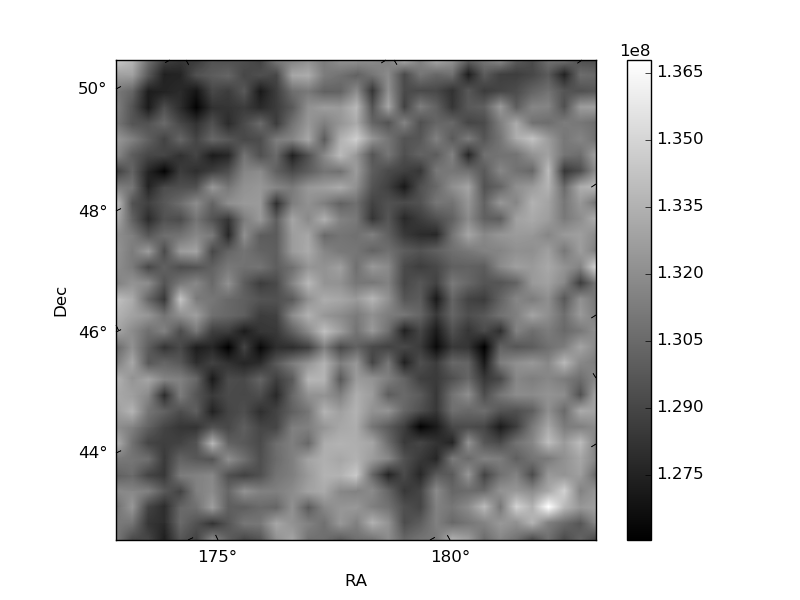
Histogram calculated using DETX and DETY for each event in the final _common_clean file
| Quadrant A | 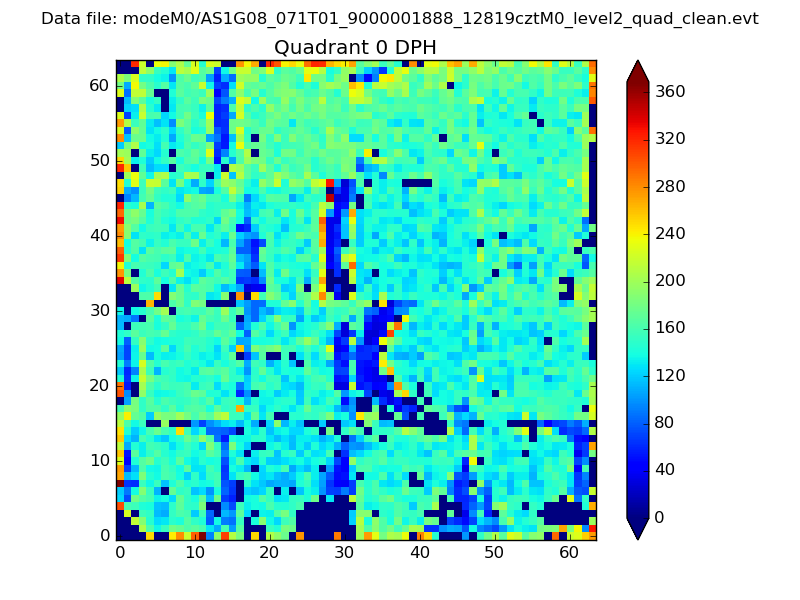 |
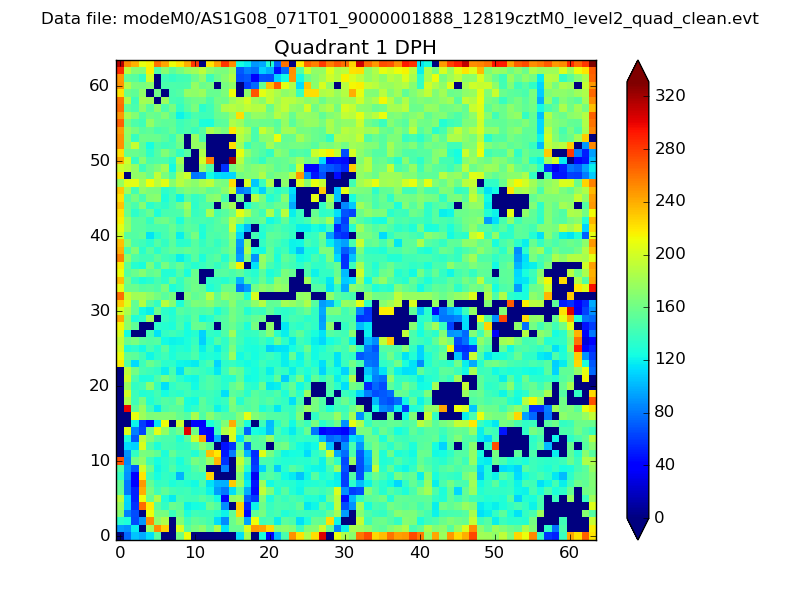 |
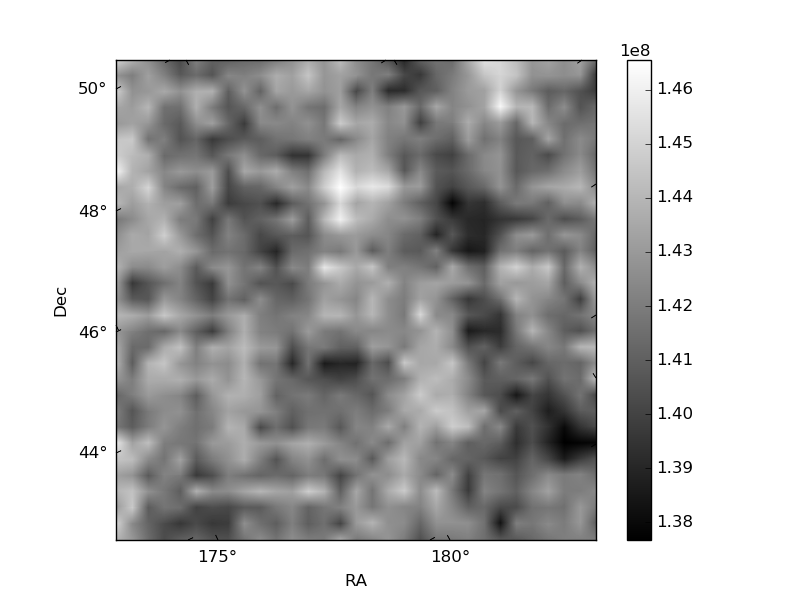
Quadrant B |
|---|---|---|---|
| Quadrant D | 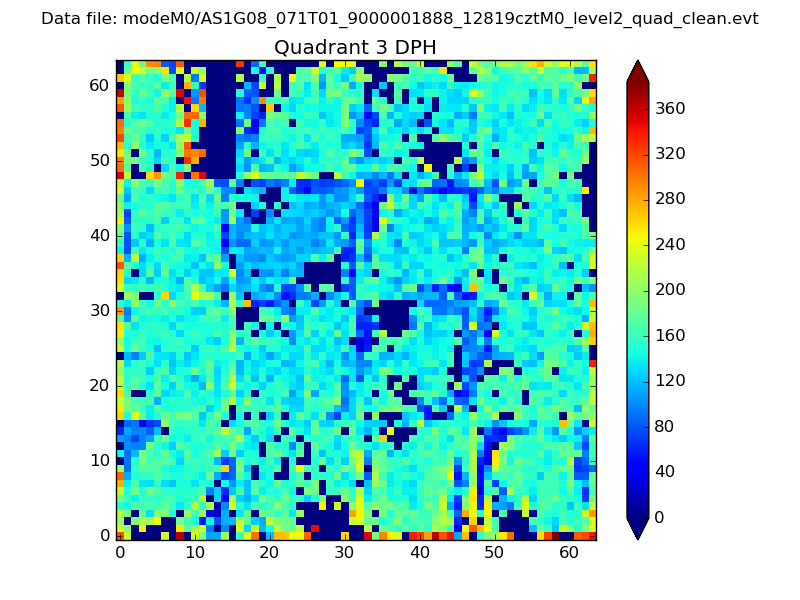 |
 |
Quadrant C |
| Plot type | Count rate plots | Images |
|---|---|---|
| Comparison with Poisson distribution Blue bars denote a histogram of data divided into 1 sec bins. Red curve is a Poisson curve with rate = median count rate of data. |
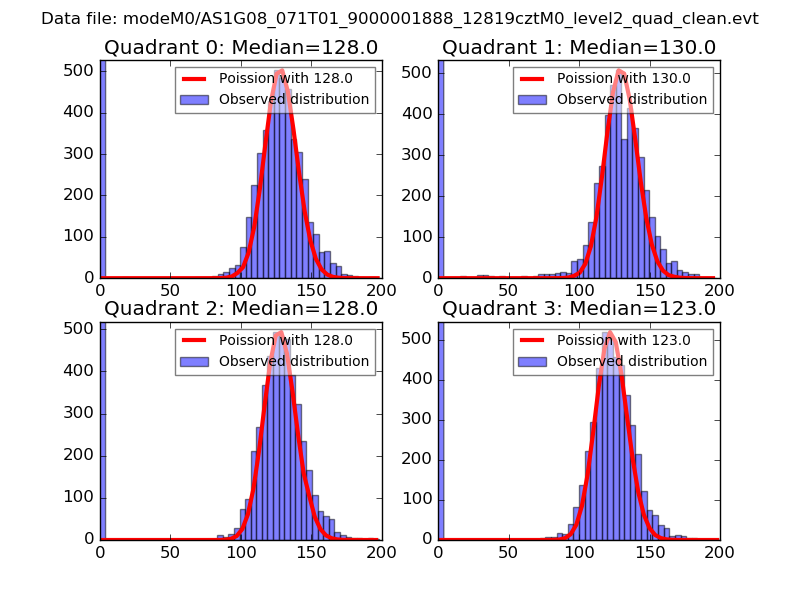 |
 |
| Quadrant-wise count rates Data is divided into 100 sec bins |
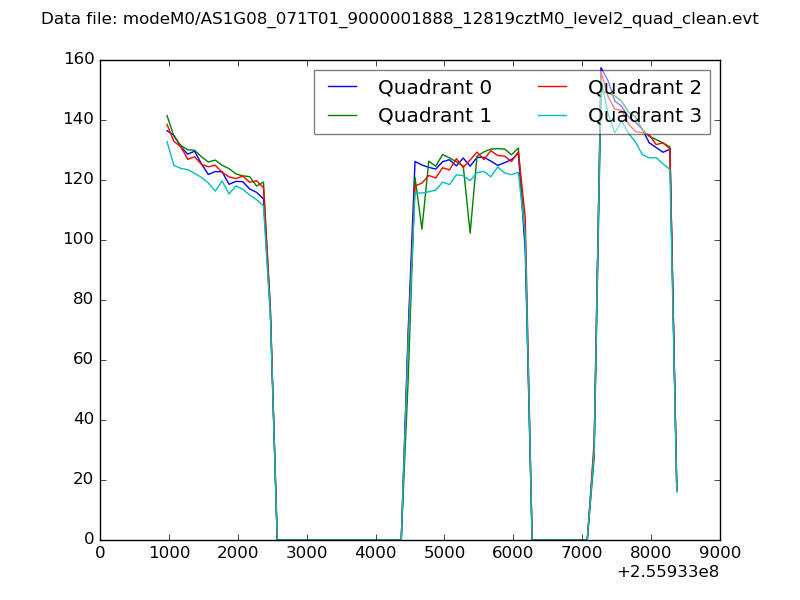 |
|
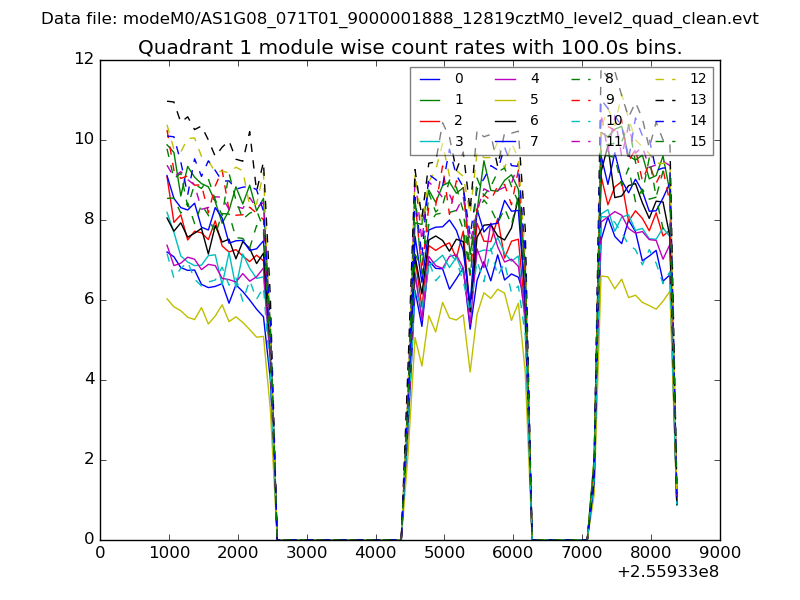
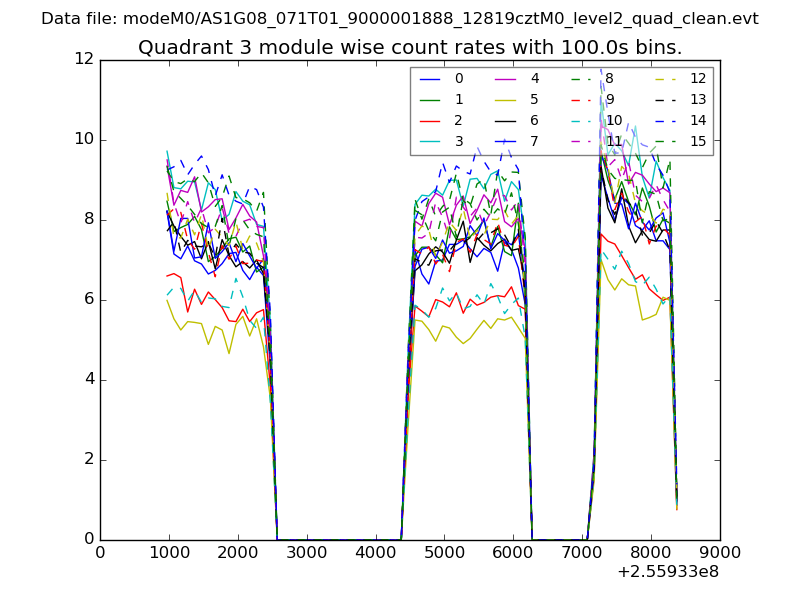
| Module-wise count rates for Quadrant A Data is divided into 100 sec bins |
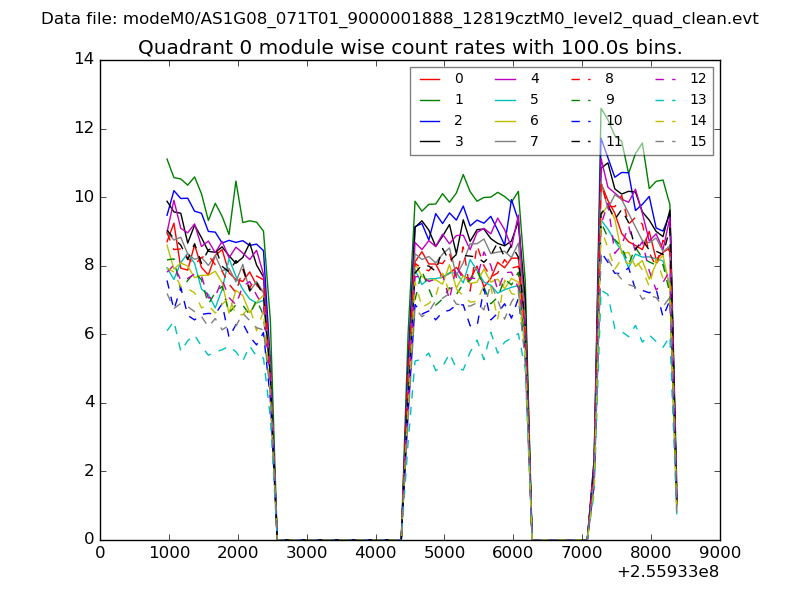 |
 |
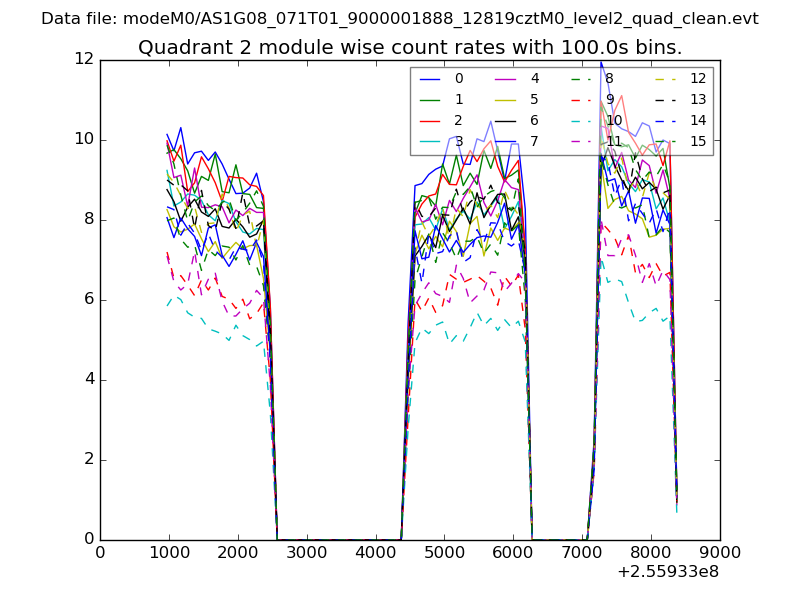
| Module-wise count rates for Quadrant B Data is divided into 100 sec bins |
 |
 |
| Module-wise count rates for Quadrant C Data is divided into 100 sec bins |
 |
 |
| Module-wise count rates for Quadrant D Data is divided into 100 sec bins |
 |
 |
| Parameter | Plot |
|---|---|
| CZT HV Monitor | 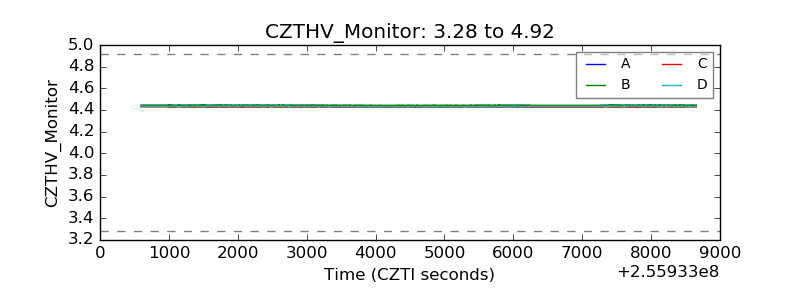 |
| D_VDD | 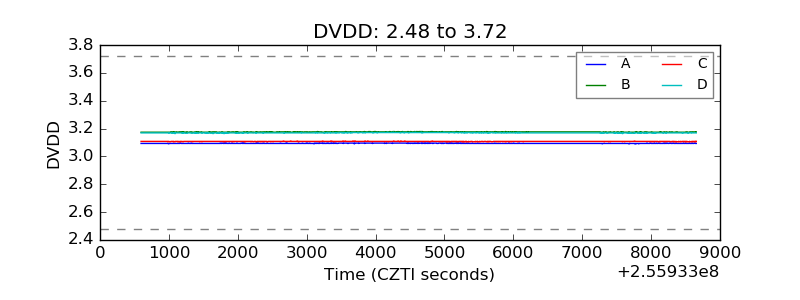 |
| Temperature 1 | 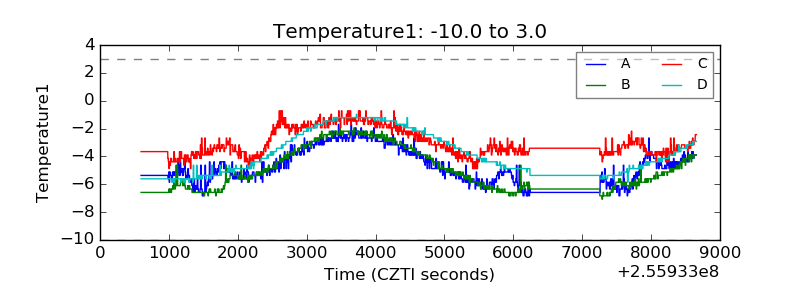 |
| Veto HV Monitor |  |
| Veto LLD | 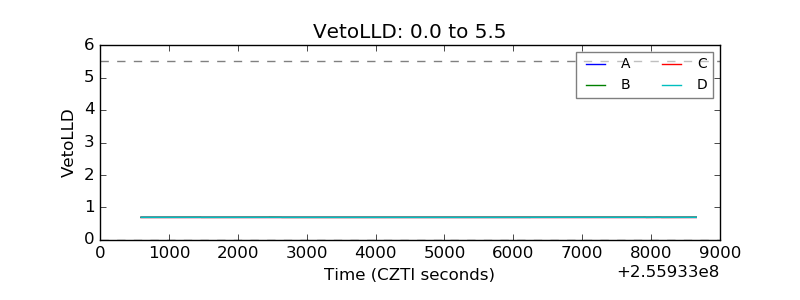 |
| Alpha Counter | 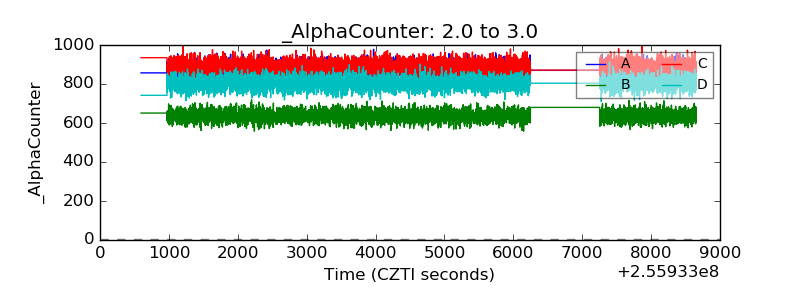 |
| _CPM_Rate | 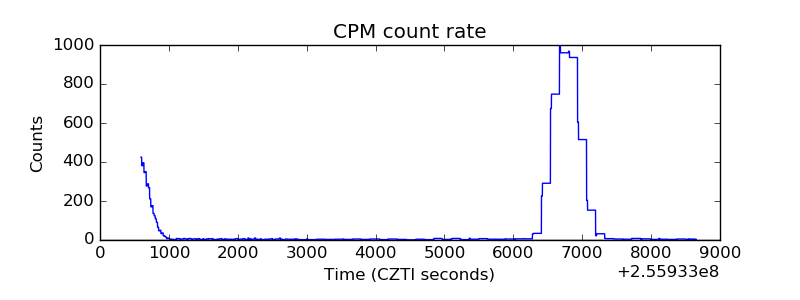 |
| CZT Counter | 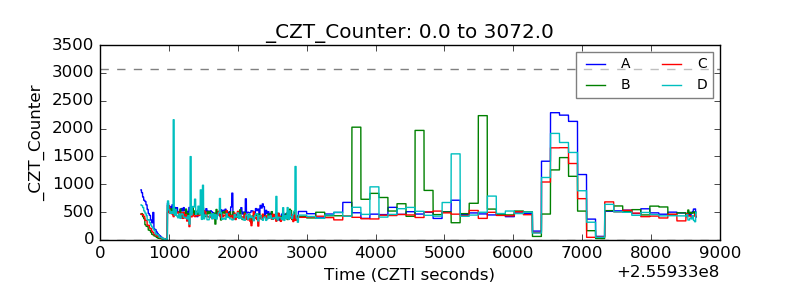 |
| +2.5 Volts monitor |  |
| +5 Volts monitor |  |
| _ROLL_ROT | 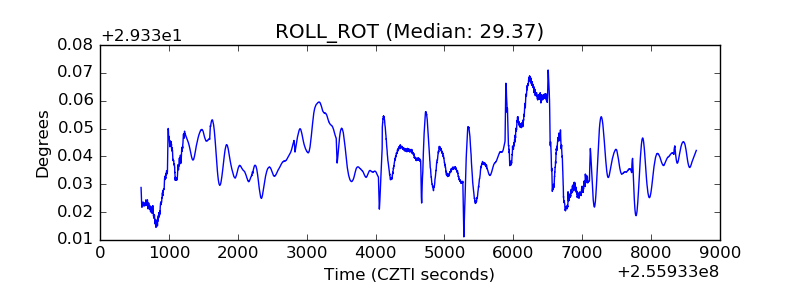 |
| _Roll_DEC | 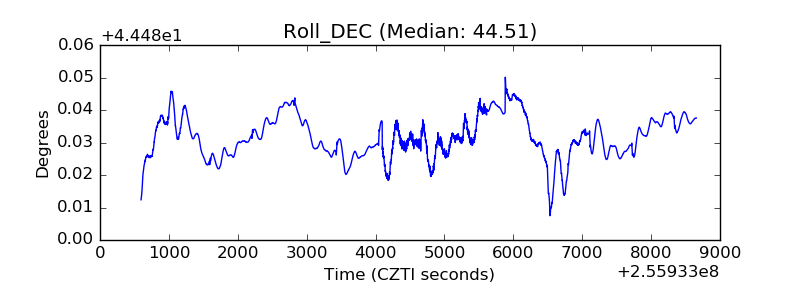 |
| _Roll_RA | 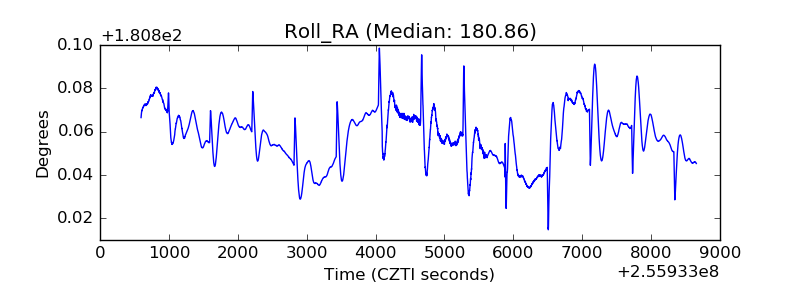 |
| Veto Counter | 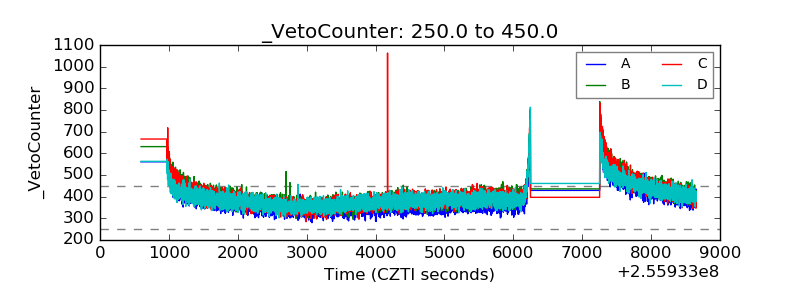 |