| Param | Original file | Final file |
|---|---|---|
| Filename | modeM0/AS1G08_071T01_9000001888_12822cztM0_level2.evt | modeM0/AS1G08_071T01_9000001888_12822cztM0_level2_quad_clean.evt |
| Size (bytes) | 487,673,280 | 72,000,000 |
| Size | 465.1 MB | 68.7 MB |
| Events in quadrant A | 3,606,496 | 439,363 |
| Events in quadrant B | 4,062,510 | 442,190 |
| Events in quadrant C | 3,056,801 | 439,231 |
| Events in quadrant D | 3,617,052 | 420,835 |
| Mode SS | |||
|---|---|---|---|
| Quadrant | BADHDUFLAG | Total packets | Discarded packets |
| A | 0 | 128 | 0 |
| B | 0 | 128 | 0 |
| C | 0 | 128 | 0 |
| D | 0 | 128 | 0 |
| Mode M9 | |||
|---|---|---|---|
| Quadrant | BADHDUFLAG | Total packets | Discarded packets |
| A | 0 | 12 | 0 |
| B | 0 | 12 | 0 |
| C | 0 | 12 | 0 |
| D | 0 | 12 | 0 |
| Mode M0 | |||
|---|---|---|---|
| Quadrant | BADHDUFLAG | Total packets | Discarded packets |
| A | 0 | 14720 | 2 |
| B | 0 | 15996 | 1 |
| C | 0 | 13021 | 1 |
| D | 0 | 14752 | 1 |
| Quadrant | Total seconds | Saturated seconds | Saturation percentage |
|---|---|---|---|
| A | 6281 | 74 | 1.178156% |
| B | 6281 | 250 | 3.980258% |
| C | 6281 | 49 | 0.780131% |
| D | 6281 | 171 | 2.722496% |
Noise dominated data is calculated using 1-second bins in cleaned event files. If a bin has >2000 counts, and if more than 50% of those come from <1% of pixels, then it is considered to be noise-dominated and hence unusable.
| Quadrant | # 1 sec bins | Bins with >0 counts | Bins with >2000 counts | High rate bins dominated by noise | Noise dominated (total time) | Noise dominated (detector-on time) | Marked lightcurve |
|---|---|---|---|---|---|---|---|
| A | 7497 | 6283 | 0 | 0 | 0.00% | 0.00% | 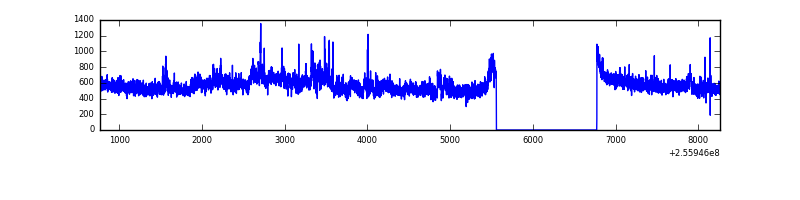 |
| B | 7497 | 6283 | 138 | 138 | 1.84% | 2.20% | 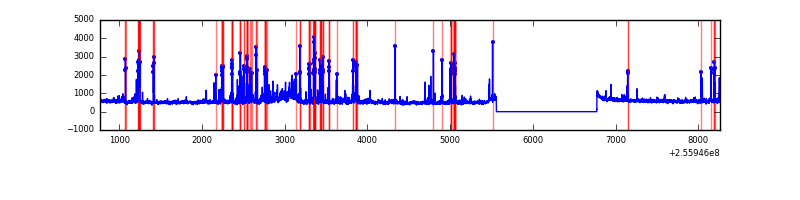 |
| C | 7497 | 6283 | 0 | 0 | 0.00% | 0.00% | 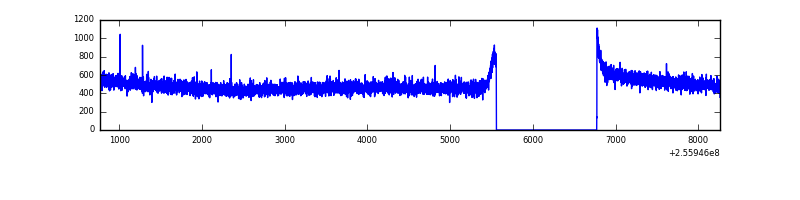 |
| D | 7497 | 6283 | 118 | 118 | 1.57% | 1.88% | 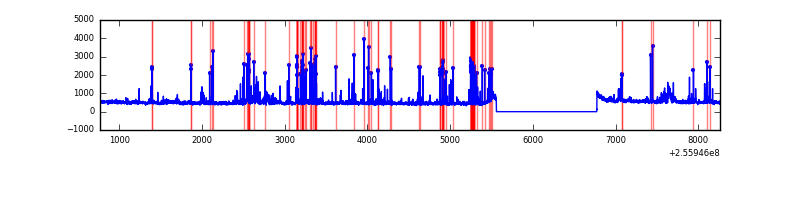 |
Top three noisy pixels from each quadrant. If the there are fewer than three noisy pixels in the level2.evt file, extra rows are filled as -1
| Pixel properties | Quadrant properties | ||||||
|---|---|---|---|---|---|---|---|
| Quadrant | DetID | PixID | Counts | Sigma | Mean | Median | Sigma |
| A | 15 | 222 | 358761 | 2172.0 | 818 | 802 | 164.8 |
| A | 12 | 189 | 101330 | 609.98 | 818 | 802 | 164.8 |
| A | 0 | 226 | 7464 | 40.42 | 818 | 802 | 164.8 |
| B | 4 | 239 | 657787 | 4378.84 | 803 | 786 | 150.0 |
| B | 0 | 219 | 128724 | 852.69 | 803 | 786 | 150.0 |
| B | 3 | 64 | 85124 | 562.1 | 803 | 786 | 150.0 |
| C | 13 | 61 | 5557 | 26.7 | 783 | 787 | 178.6 |
| C | 3 | 202 | 1996 | 6.77 | 783 | 787 | 178.6 |
| C | 14 | 234 | 1950 | 6.51 | 783 | 787 | 178.6 |
| D | 1 | 52 | 384010 | 2002.24 | 782 | 765 | 191.4 |
| D | 8 | 195 | 144961 | 753.34 | 782 | 765 | 191.4 |
| D | 13 | 172 | 61144 | 315.45 | 782 | 765 | 191.4 |
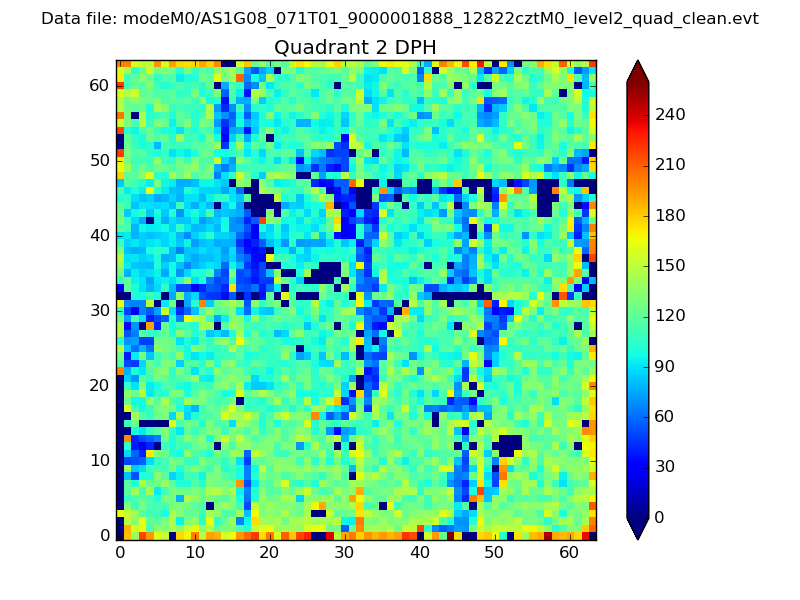
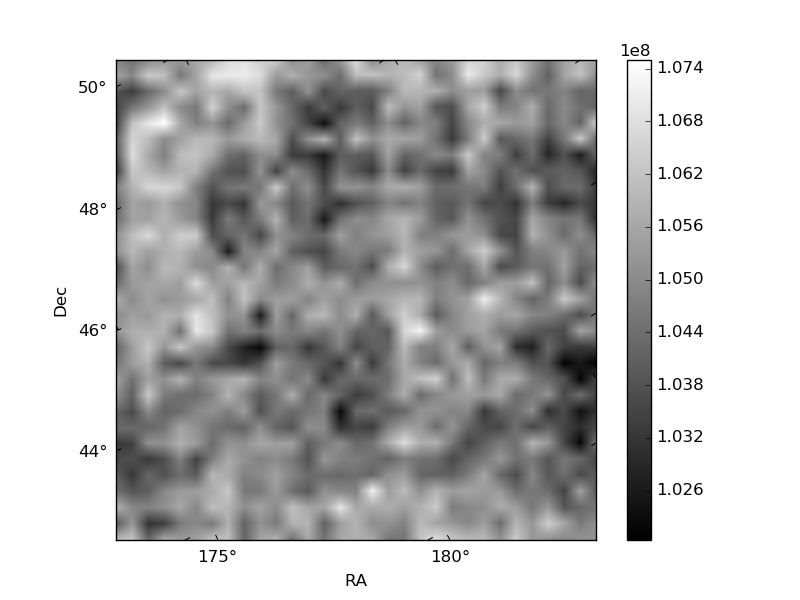
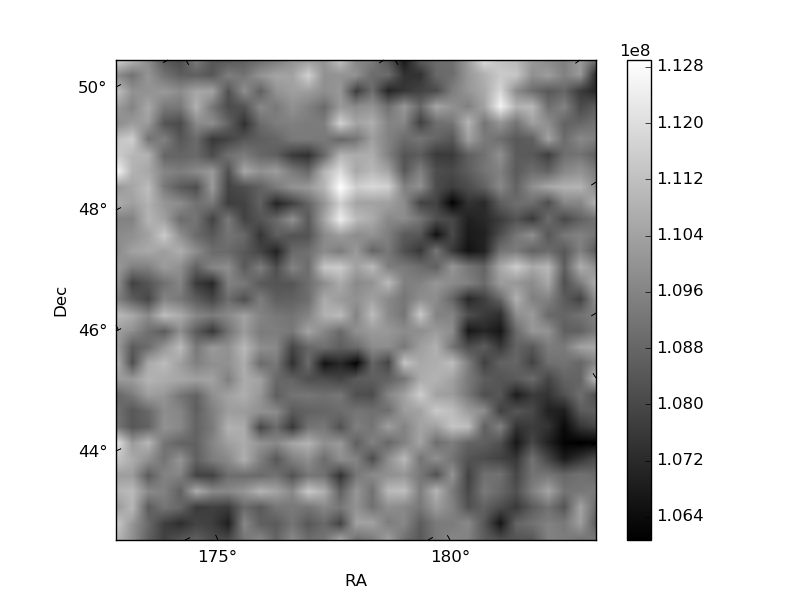
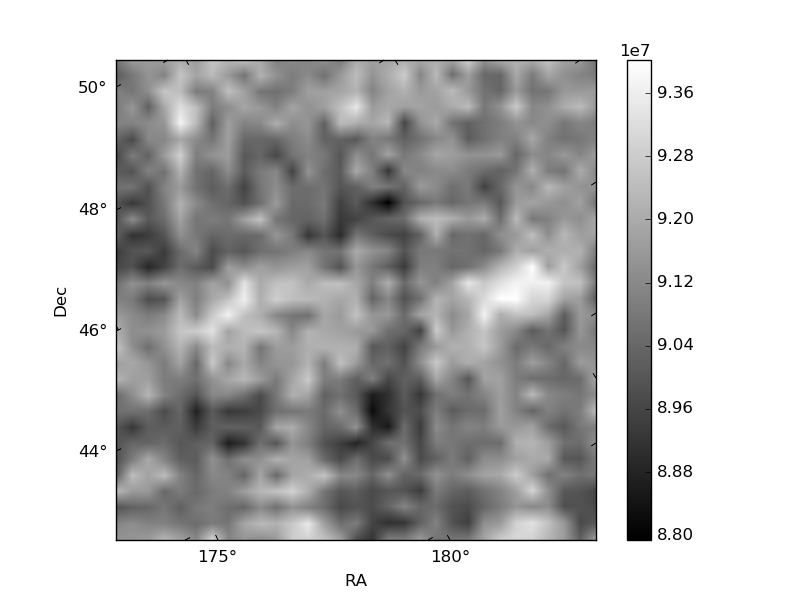
Histogram calculated using DETX and DETY for each event in the final _common_clean file
| Quadrant A | 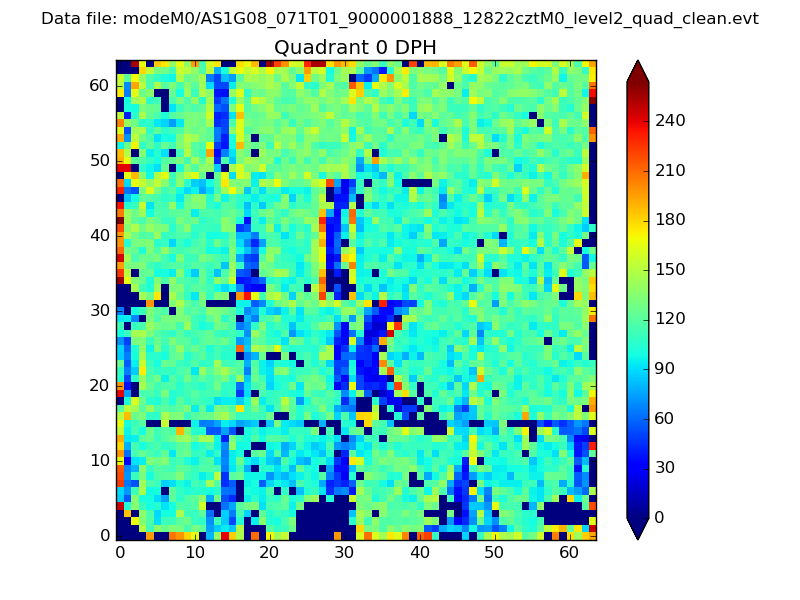 |
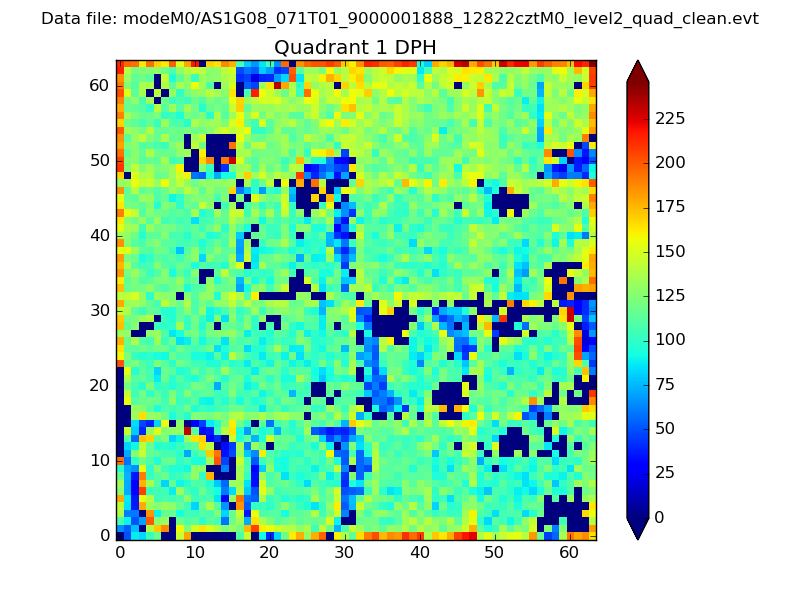 |
Quadrant B |
|---|---|---|---|
| Quadrant D | 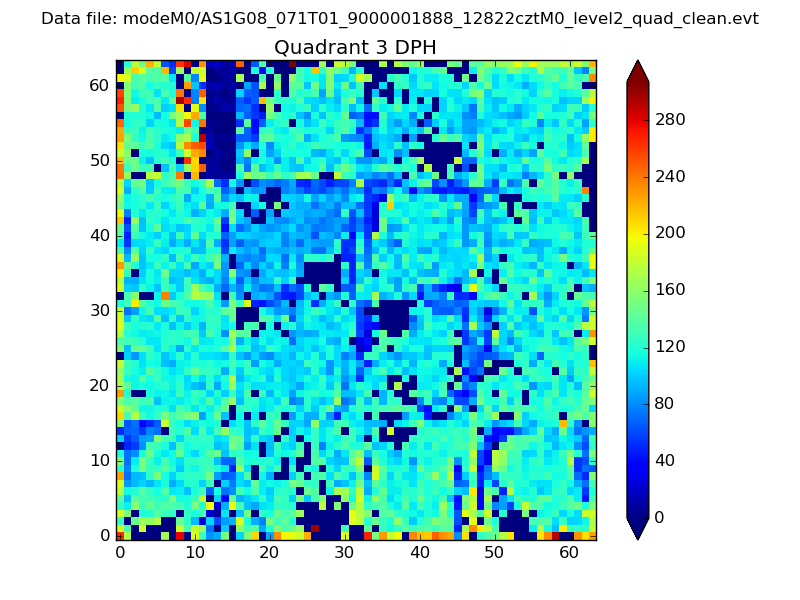 |
 |
Quadrant C |
| Plot type | Count rate plots | Images |
|---|---|---|
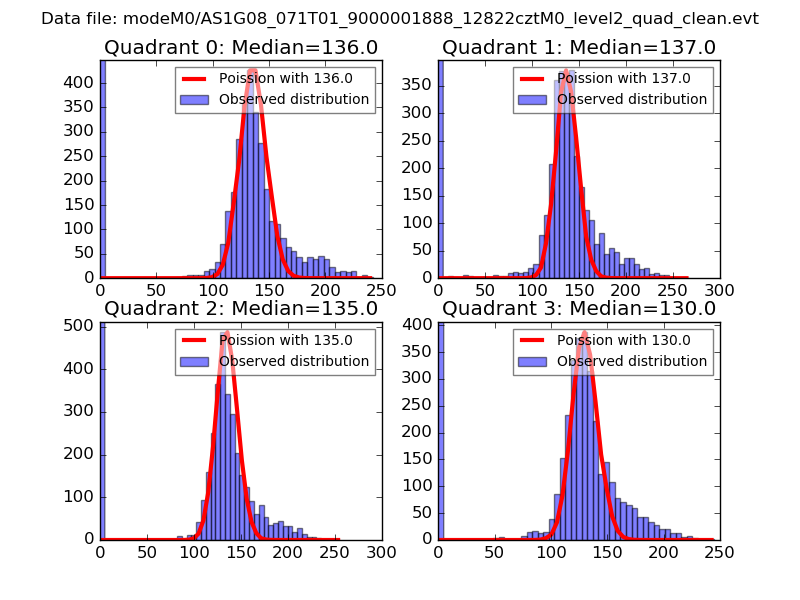
| Comparison with Poisson distribution Blue bars denote a histogram of data divided into 1 sec bins. Red curve is a Poisson curve with rate = median count rate of data. |
 |
 |
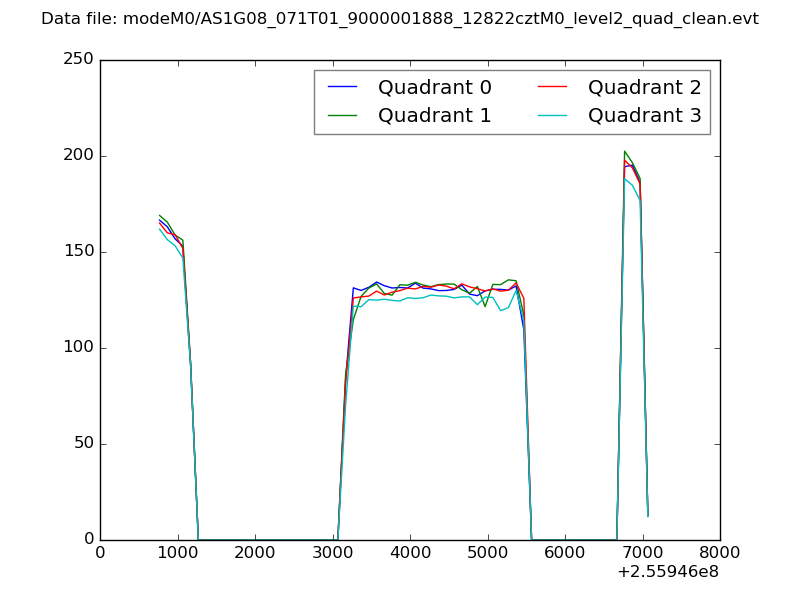
| Quadrant-wise count rates Data is divided into 100 sec bins |
 |
|
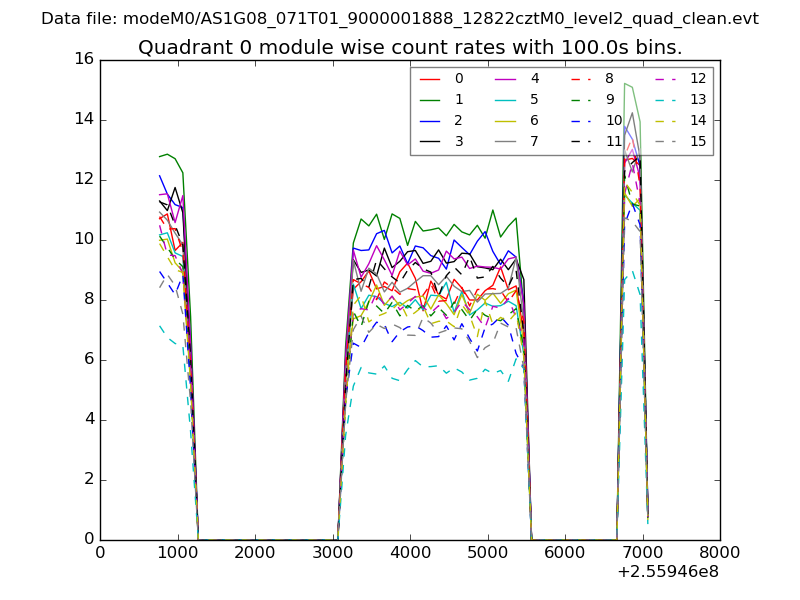
| Module-wise count rates for Quadrant A Data is divided into 100 sec bins |
 |
 |
| Module-wise count rates for Quadrant B Data is divided into 100 sec bins |
 |
 |
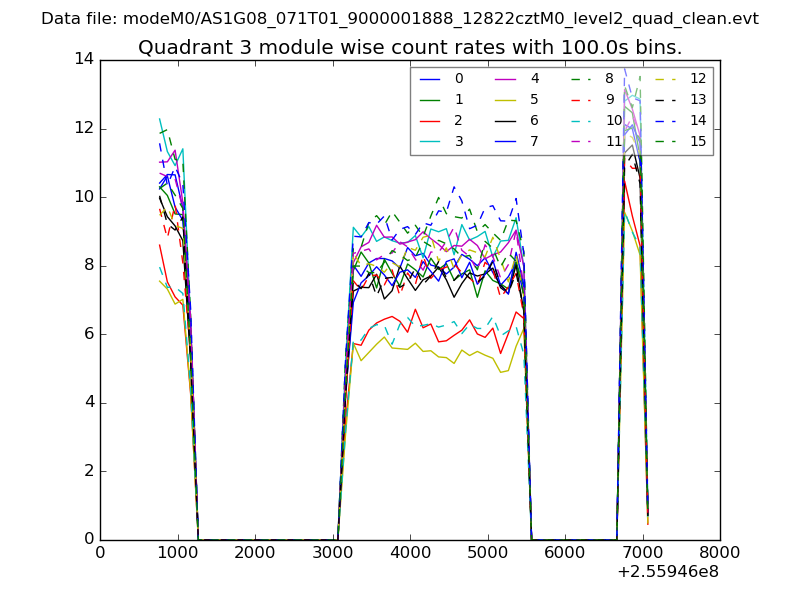
| Module-wise count rates for Quadrant C Data is divided into 100 sec bins |
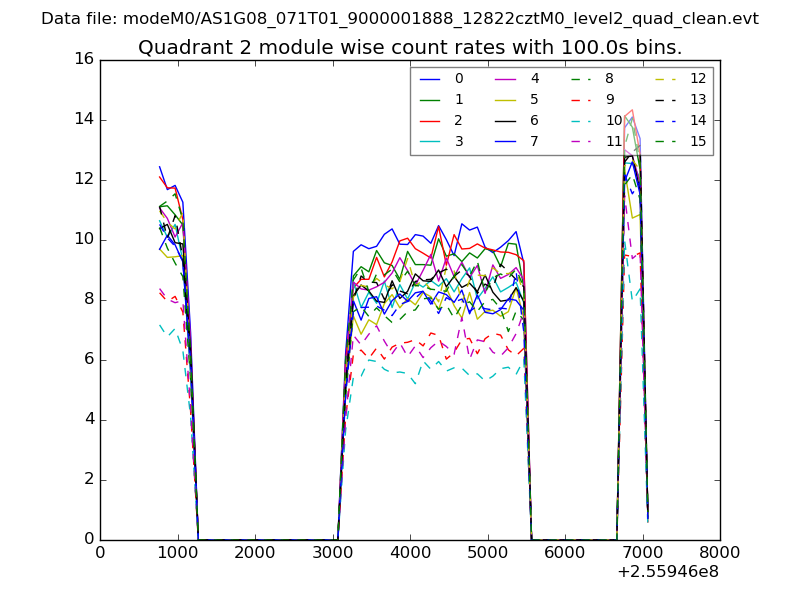 |
 |
| Module-wise count rates for Quadrant D Data is divided into 100 sec bins |
 |
 |
| Parameter | Plot |
|---|---|
| CZT HV Monitor | 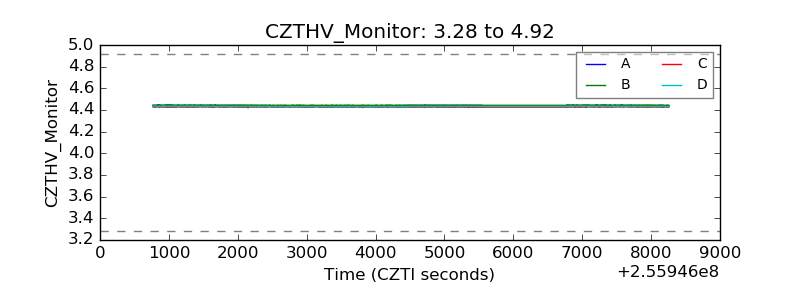 |
| D_VDD | 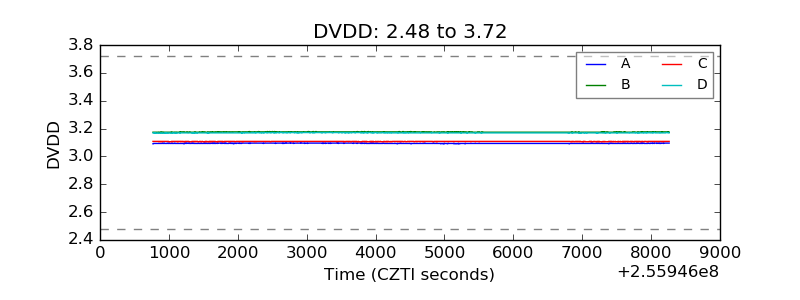 |
| Temperature 1 | 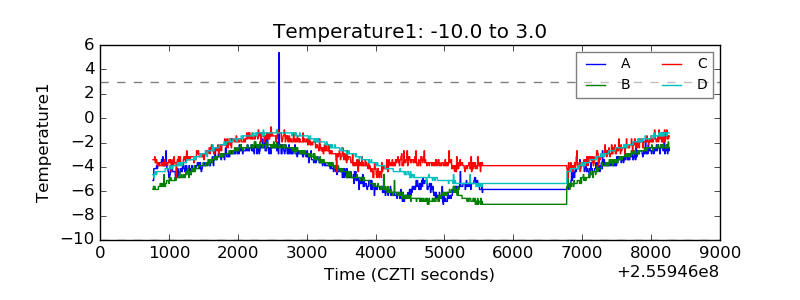 |
| Veto HV Monitor | 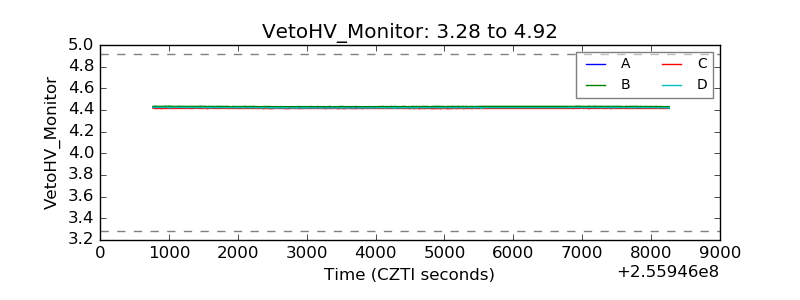 |
| Veto LLD | 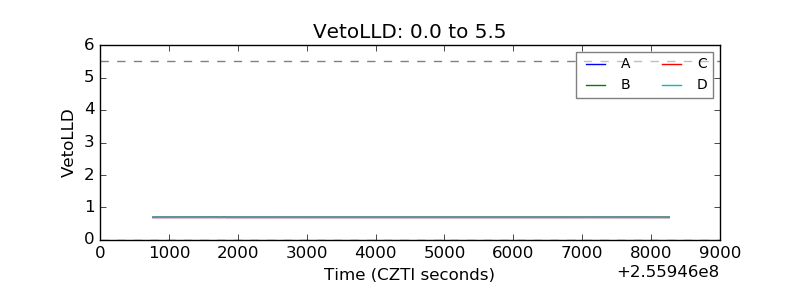 |
| Alpha Counter | 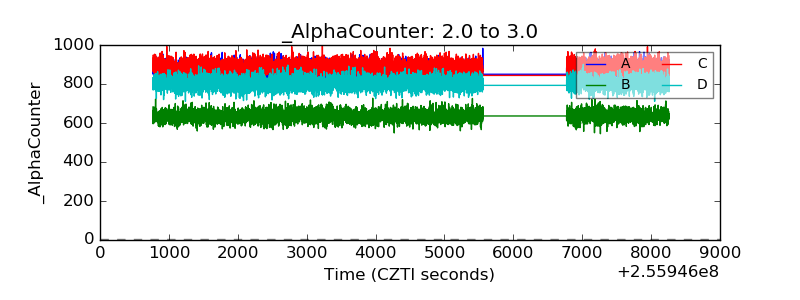 |
| _CPM_Rate | 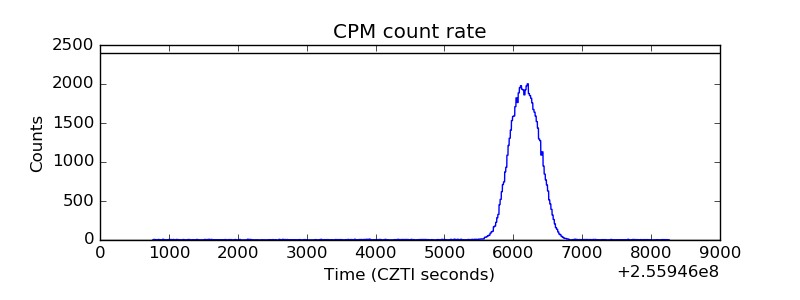 |
| CZT Counter | 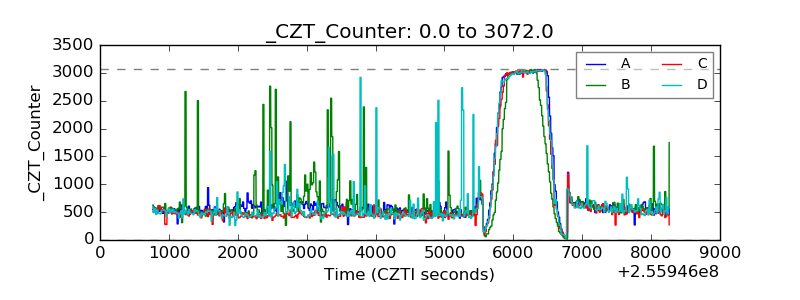 |
| +2.5 Volts monitor |  |
| +5 Volts monitor |  |
| _ROLL_ROT |  |
| _Roll_DEC | 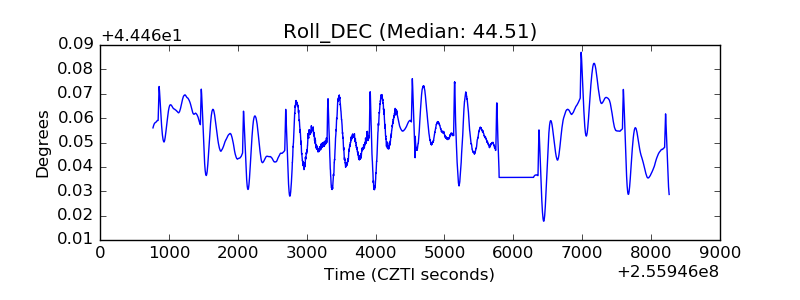 |
| _Roll_RA | 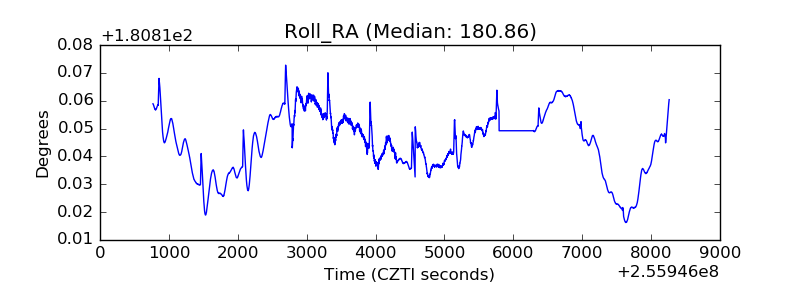 |
| Veto Counter | 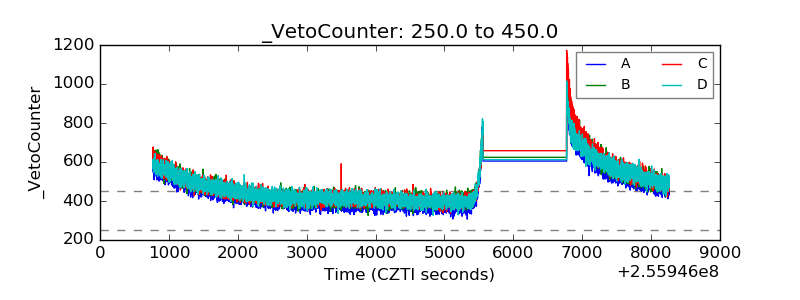 |