| Param | Original file | Final file |
|---|---|---|
| Filename | modeM0/AS1G08_071T01_9000001888_12823cztM0_level2.evt | modeM0/AS1G08_071T01_9000001888_12823cztM0_level2_quad_clean.evt |
| Size (bytes) | 508,492,800 | 69,750,720 |
| Size | 484.9 MB | 66.5 MB |
| Events in quadrant A | 3,429,459 | 426,639 |
| Events in quadrant B | 4,506,371 | 412,209 |
| Events in quadrant C | 3,265,142 | 423,286 |
| Events in quadrant D | 3,765,535 | 404,151 |
| Mode SS | |||
|---|---|---|---|
| Quadrant | BADHDUFLAG | Total packets | Discarded packets |
| A | 0 | 130 | 0 |
| B | 0 | 130 | 0 |
| C | 0 | 130 | 0 |
| D | 0 | 130 | 0 |
| Mode M9 | |||
|---|---|---|---|
| Quadrant | BADHDUFLAG | Total packets | Discarded packets |
| A | 0 | 17 | 0 |
| B | 0 | 17 | 0 |
| C | 0 | 17 | 0 |
| D | 0 | 18 | 0 |
| Mode M0 | |||
|---|---|---|---|
| Quadrant | BADHDUFLAG | Total packets | Discarded packets |
| A | 0 | 14191 | 3 |
| B | 0 | 17649 | 2 |
| C | 0 | 13573 | 2 |
| D | 0 | 15261 | 2 |
| Quadrant | Total seconds | Saturated seconds | Saturation percentage |
|---|---|---|---|
| A | 6384 | 103 | 1.613409% |
| B | 6384 | 428 | 6.704261% |
| C | 6384 | 60 | 0.939850% |
| D | 6384 | 146 | 2.286967% |
Noise dominated data is calculated using 1-second bins in cleaned event files. If a bin has >2000 counts, and if more than 50% of those come from <1% of pixels, then it is considered to be noise-dominated and hence unusable.
| Quadrant | # 1 sec bins | Bins with >0 counts | Bins with >2000 counts | High rate bins dominated by noise | Noise dominated (total time) | Noise dominated (detector-on time) | Marked lightcurve |
|---|---|---|---|---|---|---|---|
| A | 7670 | 6386 | 0 | 0 | 0.00% | 0.00% | 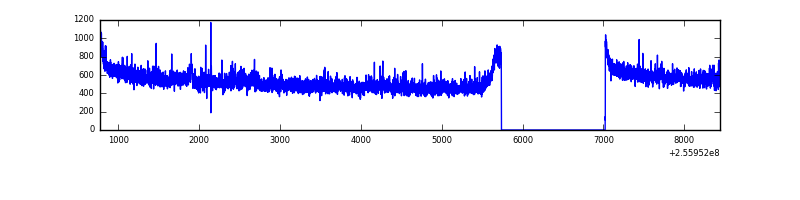 |
| B | 7670 | 6386 | 237 | 237 | 3.09% | 3.71% | 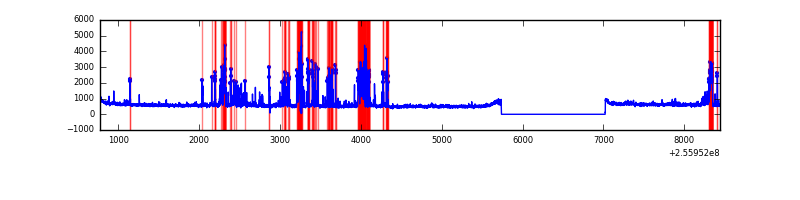 |
| C | 7670 | 6386 | 0 | 0 | 0.00% | 0.00% |  |
| D | 7670 | 6386 | 67 | 67 | 0.87% | 1.05% | 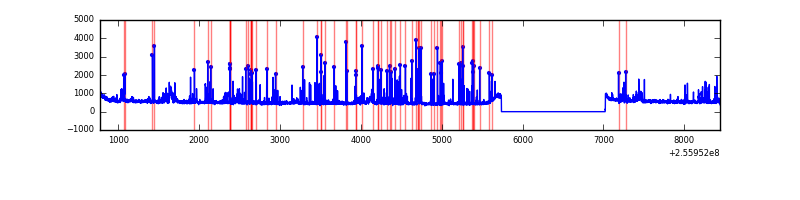 |
Top three noisy pixels from each quadrant. If the there are fewer than three noisy pixels in the level2.evt file, extra rows are filled as -1
| Pixel properties | Quadrant properties | ||||||
|---|---|---|---|---|---|---|---|
| Quadrant | DetID | PixID | Counts | Sigma | Mean | Median | Sigma |
| A | 12 | 189 | 80690 | 460.39 | 871 | 856 | 173.4 |
| A | 0 | 226 | 7817 | 40.14 | 871 | 856 | 173.4 |
| A | 12 | 194 | 6880 | 34.74 | 871 | 856 | 173.4 |
| B | 4 | 239 | 884020 | 5694.22 | 840 | 821 | 155.1 |
| B | 0 | 219 | 165737 | 1063.26 | 840 | 821 | 155.1 |
| B | 3 | 64 | 51616 | 327.49 | 840 | 821 | 155.1 |
| C | 13 | 61 | 6016 | 27.14 | 837 | 840 | 190.7 |
| C | 3 | 202 | 2153 | 6.88 | 837 | 840 | 190.7 |
| C | 3 | 203 | 1919 | 5.66 | 837 | 840 | 190.7 |
| D | 8 | 195 | 248467 | 1255.46 | 838 | 818 | 197.3 |
| D | 1 | 52 | 202184 | 1020.83 | 838 | 818 | 197.3 |
| D | 13 | 172 | 50957 | 254.18 | 838 | 818 | 197.3 |
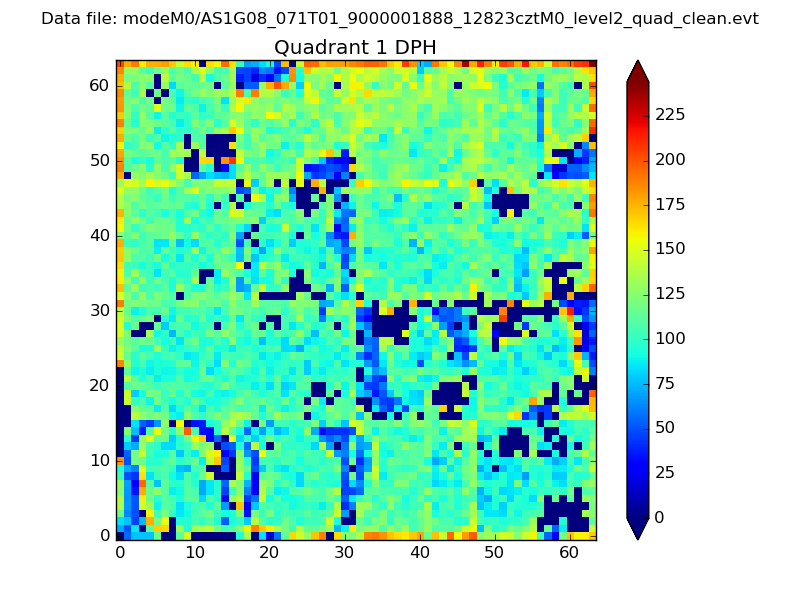
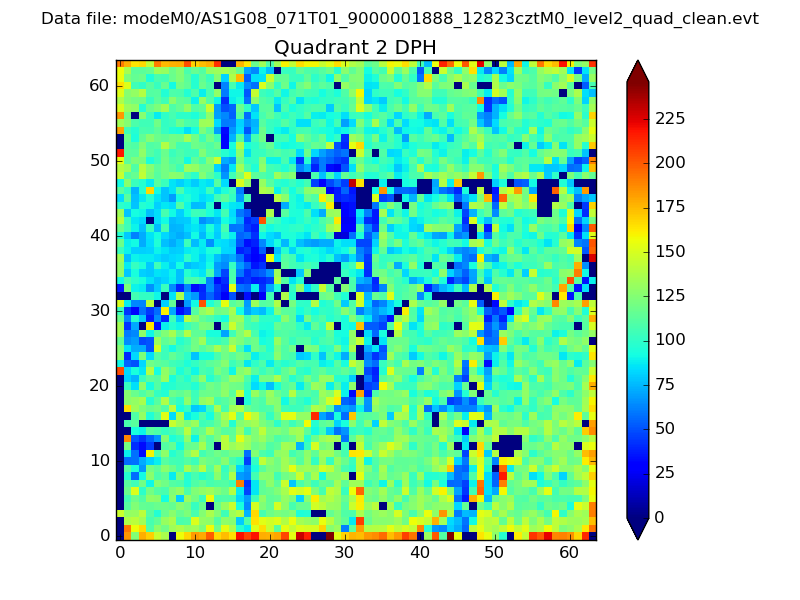
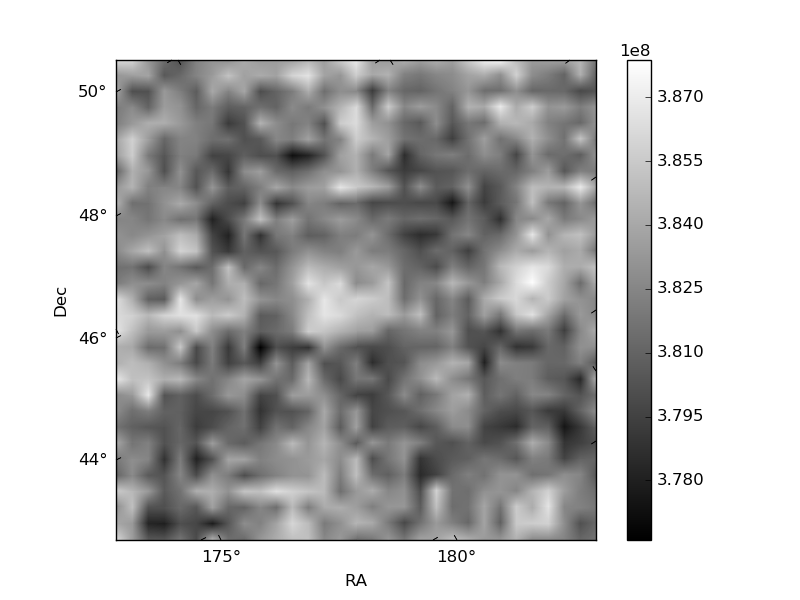
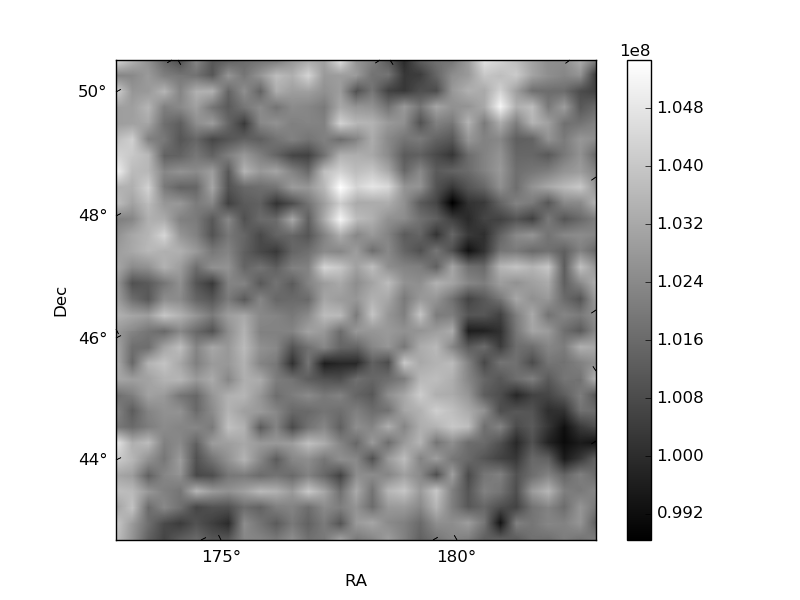
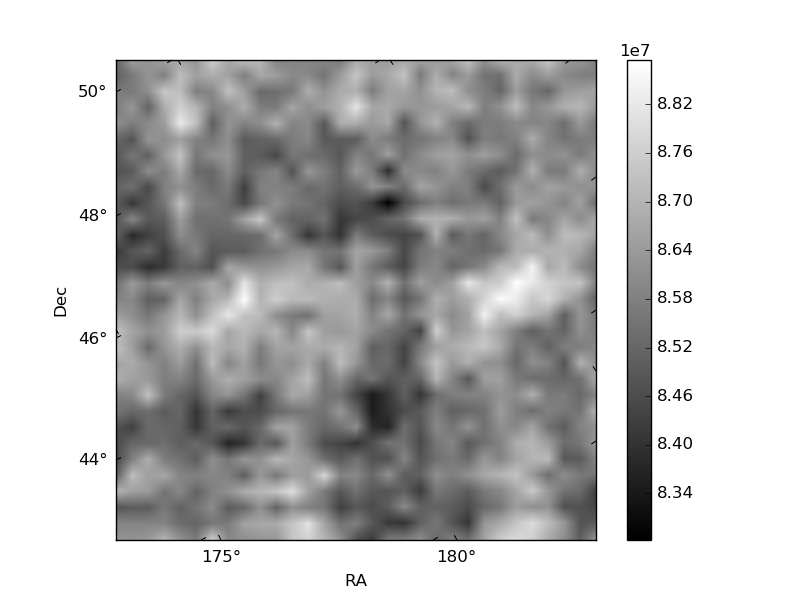
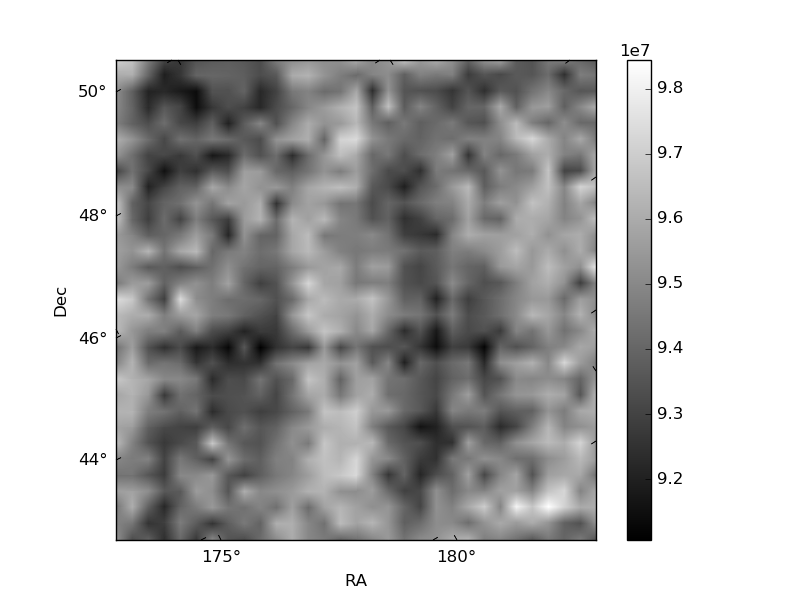
Histogram calculated using DETX and DETY for each event in the final _common_clean file
| Quadrant A | 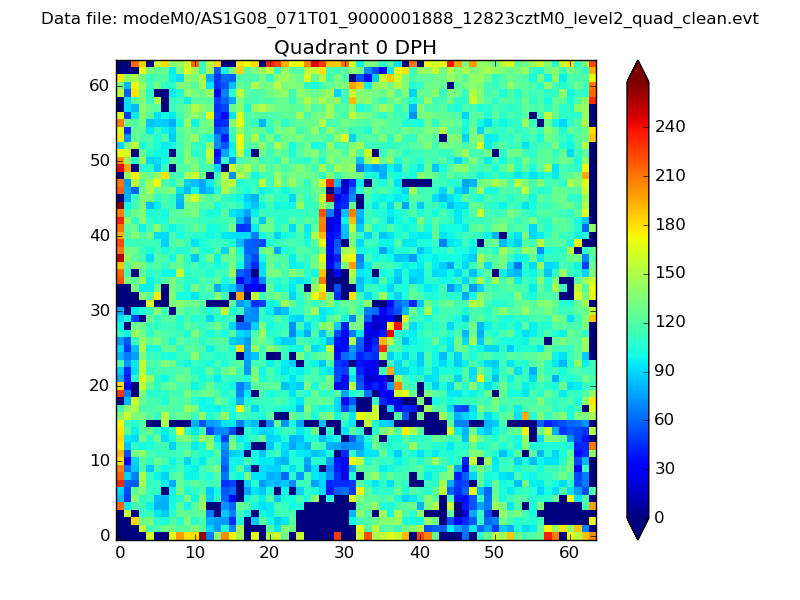 |
 |
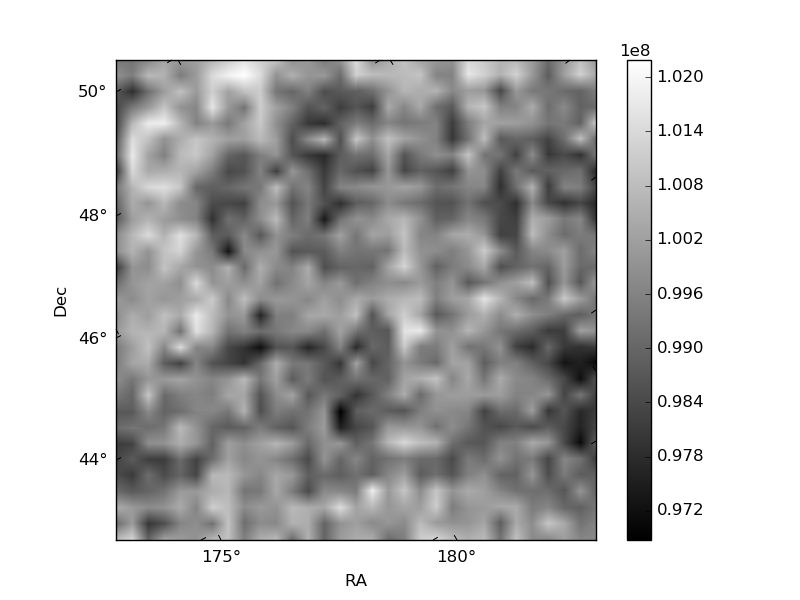
Quadrant B |
|---|---|---|---|
| Quadrant D | 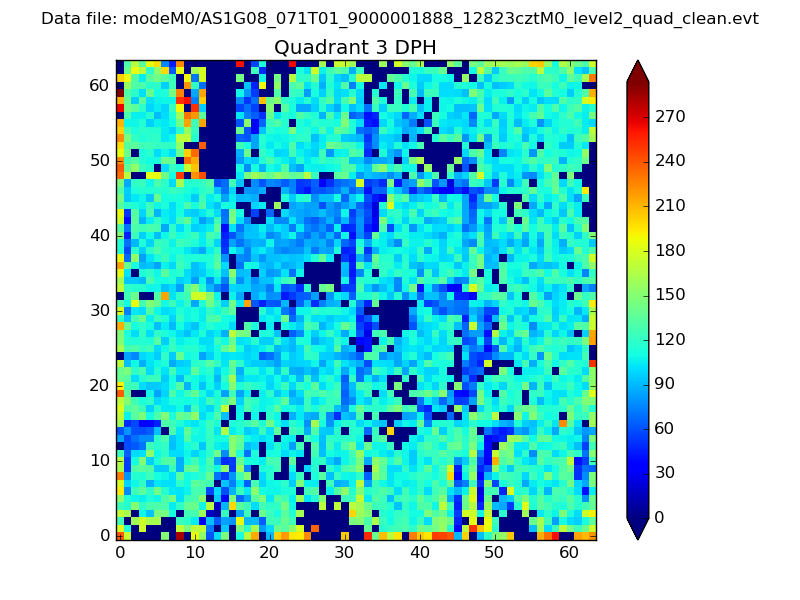 |
 |
Quadrant C |
| Plot type | Count rate plots | Images |
|---|---|---|
| Comparison with Poisson distribution Blue bars denote a histogram of data divided into 1 sec bins. Red curve is a Poisson curve with rate = median count rate of data. |
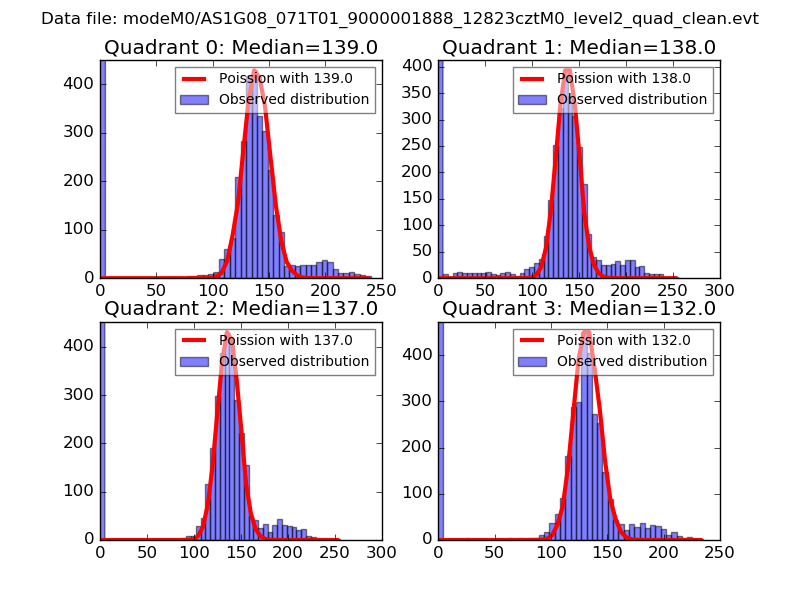 |
 |
| Quadrant-wise count rates Data is divided into 100 sec bins |
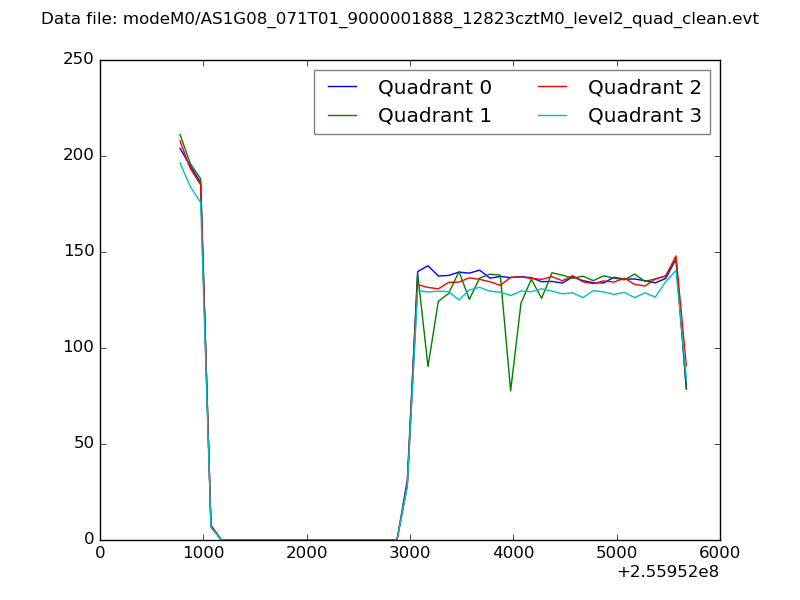 |
|
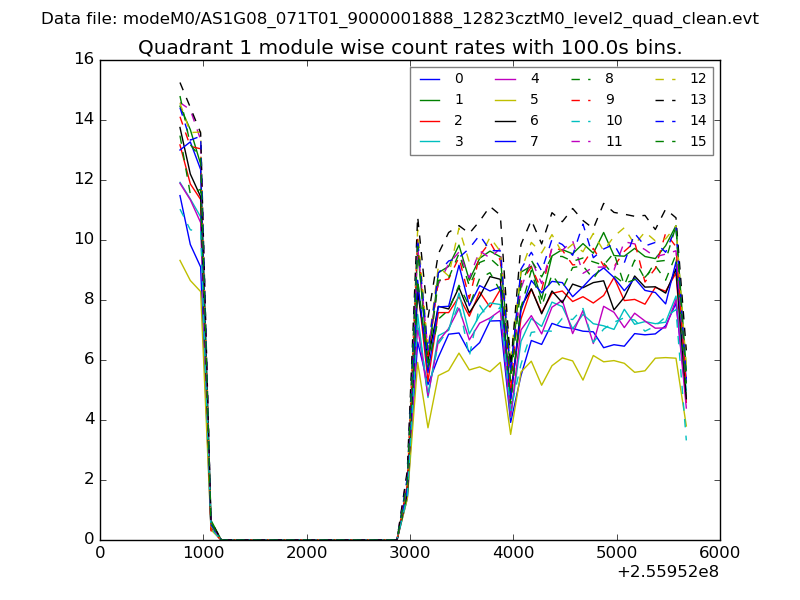
| Module-wise count rates for Quadrant A Data is divided into 100 sec bins |
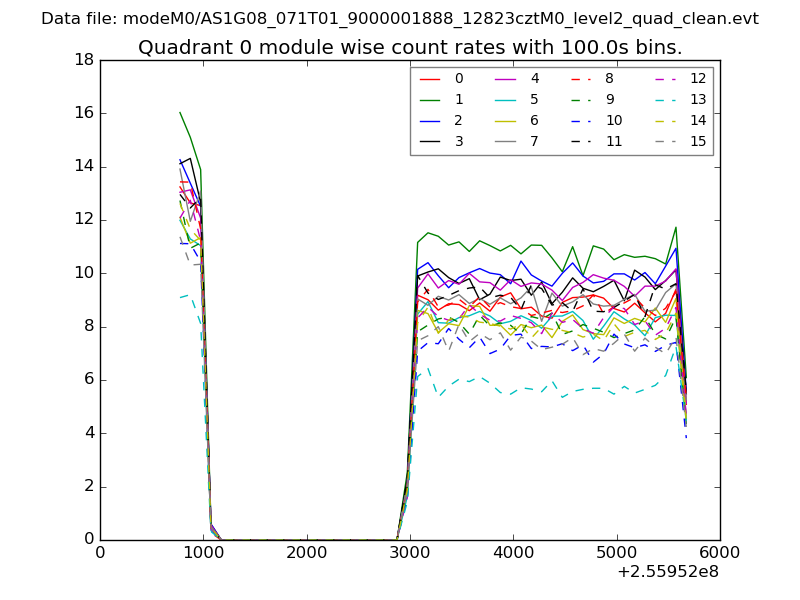 |
 |
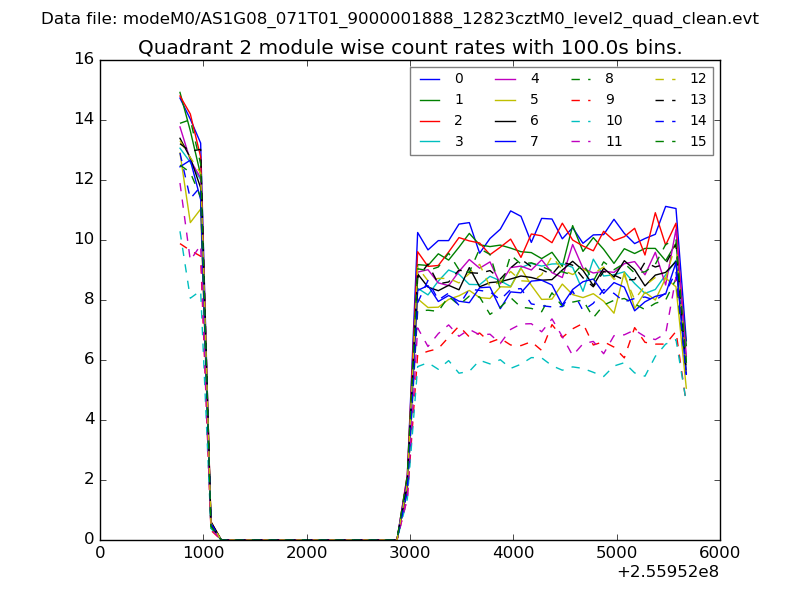
| Module-wise count rates for Quadrant B Data is divided into 100 sec bins |
 |
 |
| Module-wise count rates for Quadrant C Data is divided into 100 sec bins |
 |
 |
| Module-wise count rates for Quadrant D Data is divided into 100 sec bins |
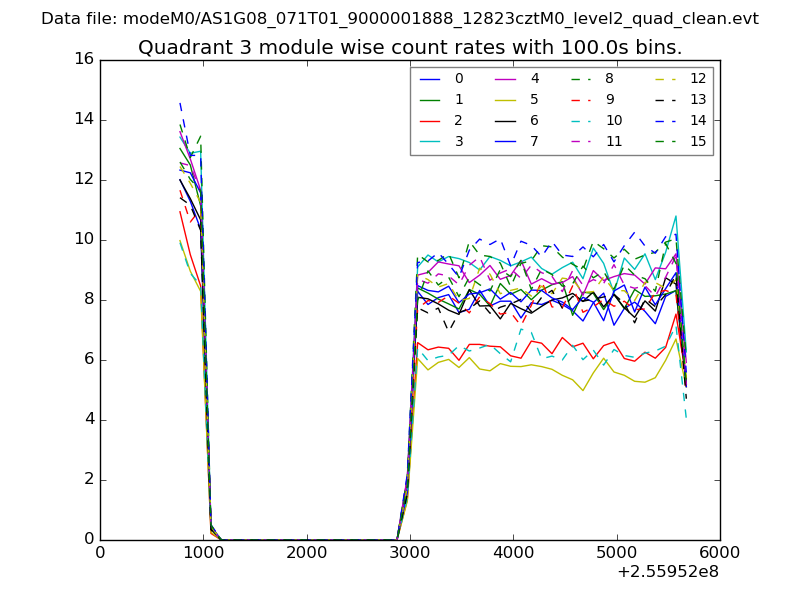 |
 |
| Parameter | Plot |
|---|---|
| CZT HV Monitor | 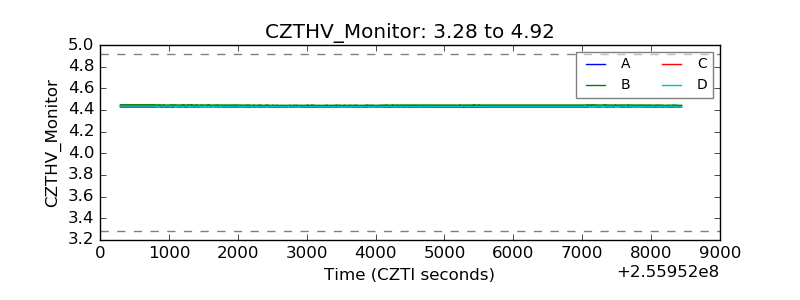 |
| D_VDD | 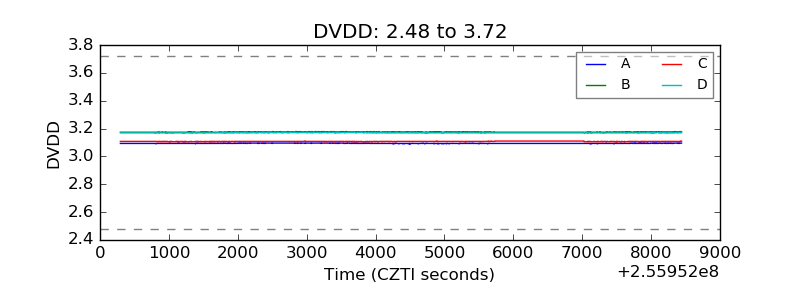 |
| Temperature 1 | 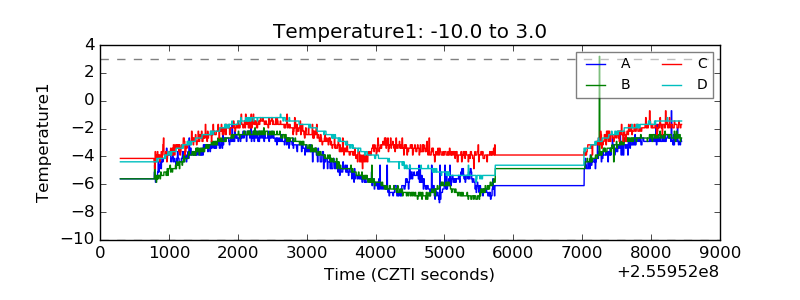 |
| Veto HV Monitor |  |
| Veto LLD | 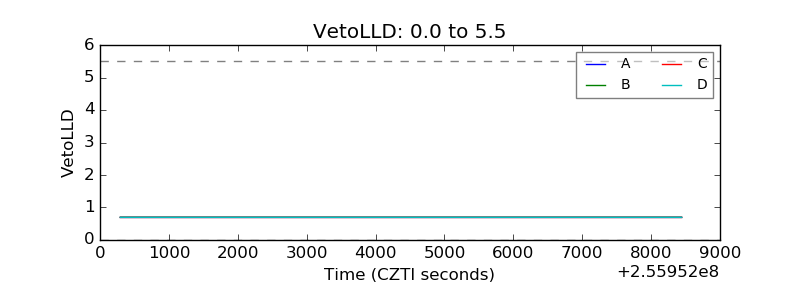 |
| Alpha Counter | 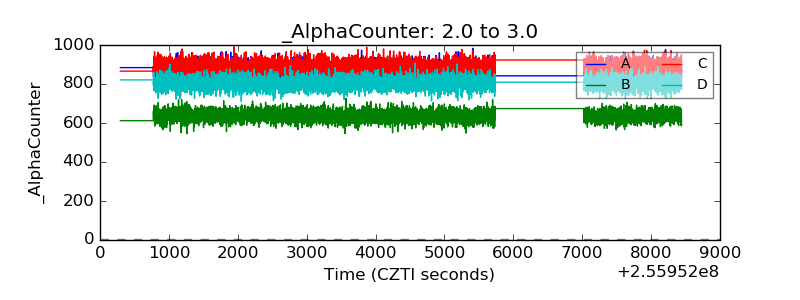 |
| _CPM_Rate | 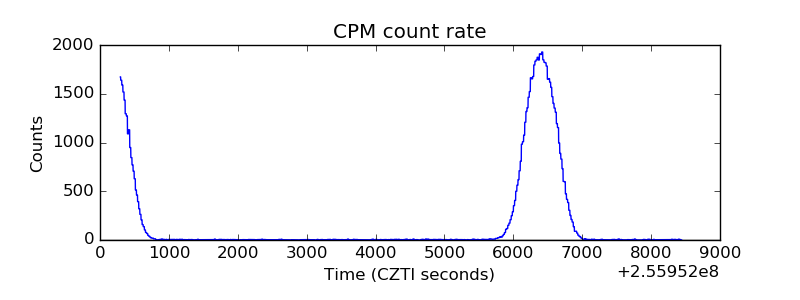 |
| CZT Counter | 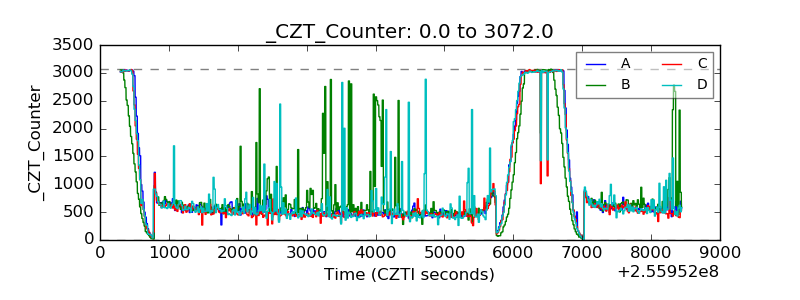 |
| +2.5 Volts monitor |  |
| +5 Volts monitor |  |
| _ROLL_ROT |  |
| _Roll_DEC | 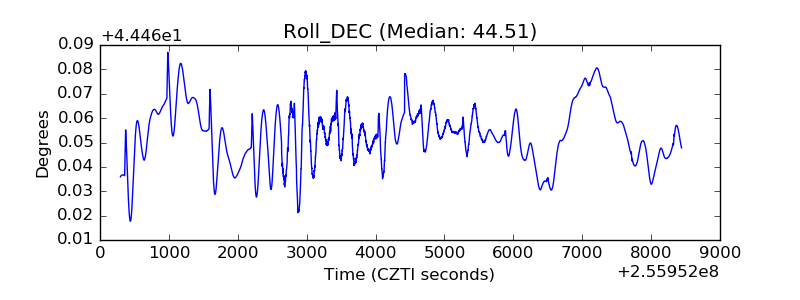 |
| _Roll_RA | 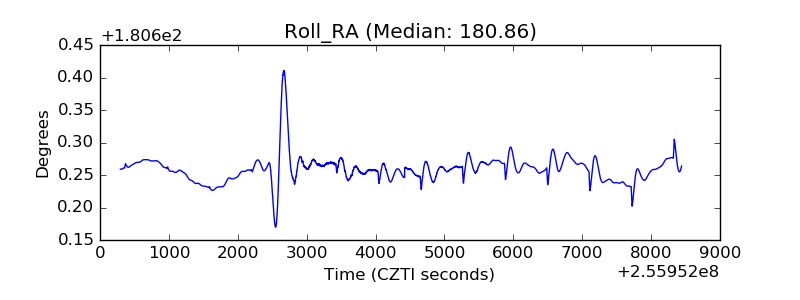 |
| Veto Counter | 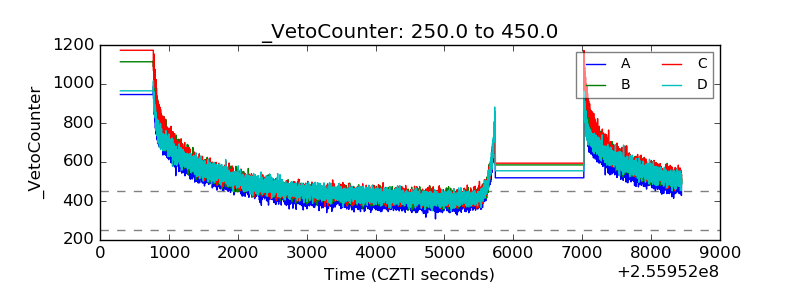 |