| Param | Original file | Final file |
|---|---|---|
| Filename | modeM0/AS1G08_071T01_9000001888_12824cztM0_level2.evt | modeM0/AS1G08_071T01_9000001888_12824cztM0_level2_quad_clean.evt |
| Size (bytes) | 511,217,280 | 69,877,440 |
| Size | 487.5 MB | 66.6 MB |
| Events in quadrant A | 3,502,290 | 428,534 |
| Events in quadrant B | 4,721,168 | 401,731 |
| Events in quadrant C | 3,288,958 | 425,711 |
| Events in quadrant D | 3,535,424 | 412,883 |
| Mode SS | |||
|---|---|---|---|
| Quadrant | BADHDUFLAG | Total packets | Discarded packets |
| A | 0 | 130 | 0 |
| B | 0 | 130 | 0 |
| C | 0 | 130 | 0 |
| D | 0 | 130 | 0 |
| Mode M9 | |||
|---|---|---|---|
| Quadrant | BADHDUFLAG | Total packets | Discarded packets |
| A | 0 | 23 | 0 |
| B | 0 | 23 | 0 |
| C | 0 | 23 | 0 |
| D | 0 | 24 | 0 |
| Mode M0 | |||
|---|---|---|---|
| Quadrant | BADHDUFLAG | Total packets | Discarded packets |
| A | 0 | 14469 | 3 |
| B | 0 | 18515 | 2 |
| C | 0 | 13611 | 2 |
| D | 0 | 14494 | 2 |
| Quadrant | Total seconds | Saturated seconds | Saturation percentage |
|---|---|---|---|
| A | 6403 | 112 | 1.749180% |
| B | 6403 | 501 | 7.824457% |
| C | 6403 | 74 | 1.155708% |
| D | 6403 | 80 | 1.249414% |
Noise dominated data is calculated using 1-second bins in cleaned event files. If a bin has >2000 counts, and if more than 50% of those come from <1% of pixels, then it is considered to be noise-dominated and hence unusable.
| Quadrant | # 1 sec bins | Bins with >0 counts | Bins with >2000 counts | High rate bins dominated by noise | Noise dominated (total time) | Noise dominated (detector-on time) | Marked lightcurve |
|---|---|---|---|---|---|---|---|
| A | 7729 | 6405 | 0 | 0 | 0.00% | 0.00% | 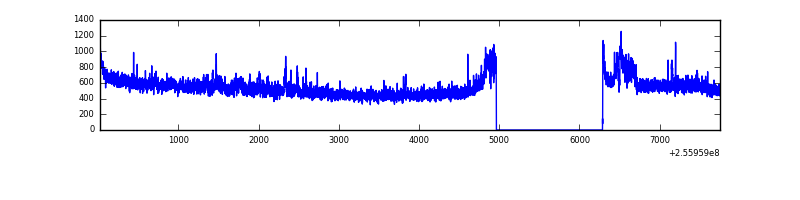 |
| B | 7729 | 6405 | 304 | 304 | 3.93% | 4.75% | 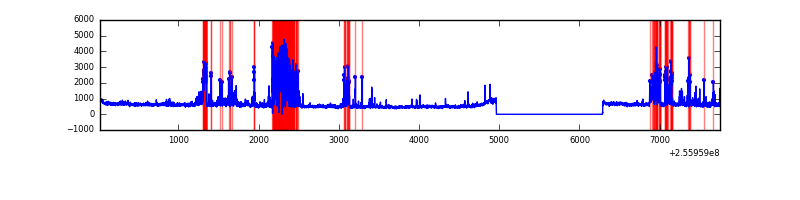 |
| C | 7729 | 6405 | 0 | 0 | 0.00% | 0.00% | 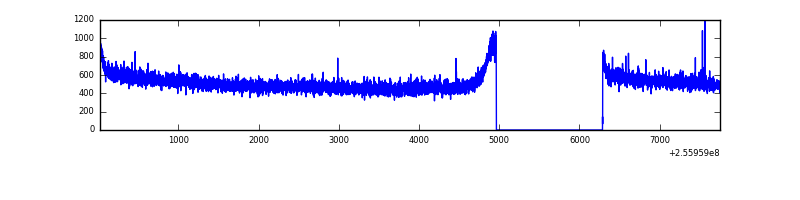 |
| D | 7729 | 6405 | 16 | 16 | 0.21% | 0.25% | 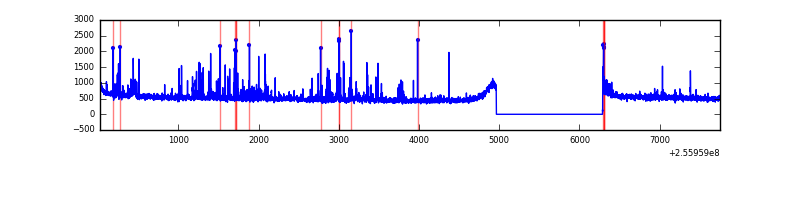 |
Top three noisy pixels from each quadrant. If the there are fewer than three noisy pixels in the level2.evt file, extra rows are filled as -1
| Pixel properties | Quadrant properties | ||||||
|---|---|---|---|---|---|---|---|
| Quadrant | DetID | PixID | Counts | Sigma | Mean | Median | Sigma |
| A | 12 | 189 | 103277 | 591.78 | 868 | 852 | 173.1 |
| A | 15 | 222 | 57976 | 330.05 | 868 | 852 | 173.1 |
| A | 0 | 226 | 7822 | 40.27 | 868 | 852 | 173.1 |
| B | 4 | 239 | 1162567 | 7552.17 | 828 | 810 | 153.8 |
| B | 0 | 219 | 180147 | 1165.8 | 828 | 810 | 153.8 |
| B | 0 | 197 | 74159 | 476.81 | 828 | 810 | 153.8 |
| C | 13 | 61 | 6084 | 27.17 | 842 | 846 | 192.8 |
| C | 14 | 234 | 4849 | 20.76 | 842 | 846 | 192.8 |
| C | 12 | 4 | 2079 | 6.4 | 842 | 846 | 192.8 |
| D | 1 | 52 | 105512 | 484.04 | 834 | 820 | 216.3 |
| D | 8 | 195 | 95471 | 437.62 | 834 | 820 | 216.3 |
| D | 2 | 136 | 80623 | 368.97 | 834 | 820 | 216.3 |
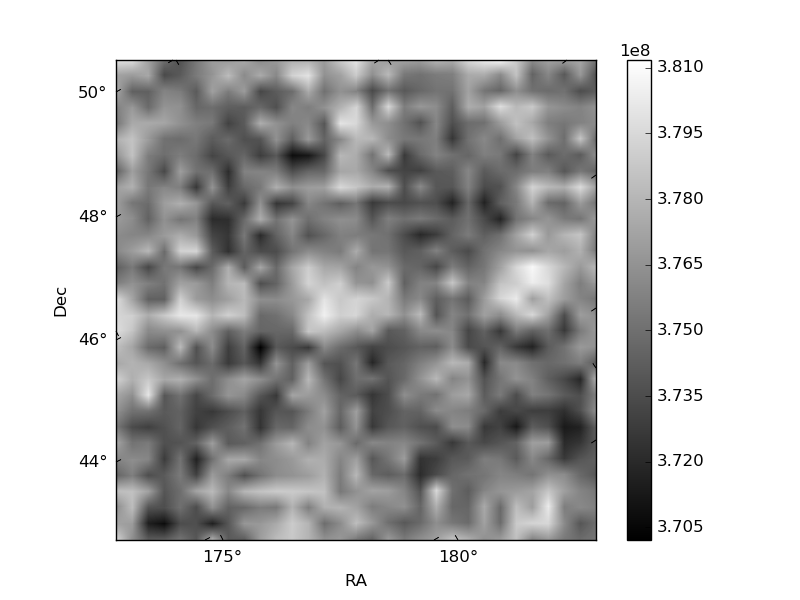
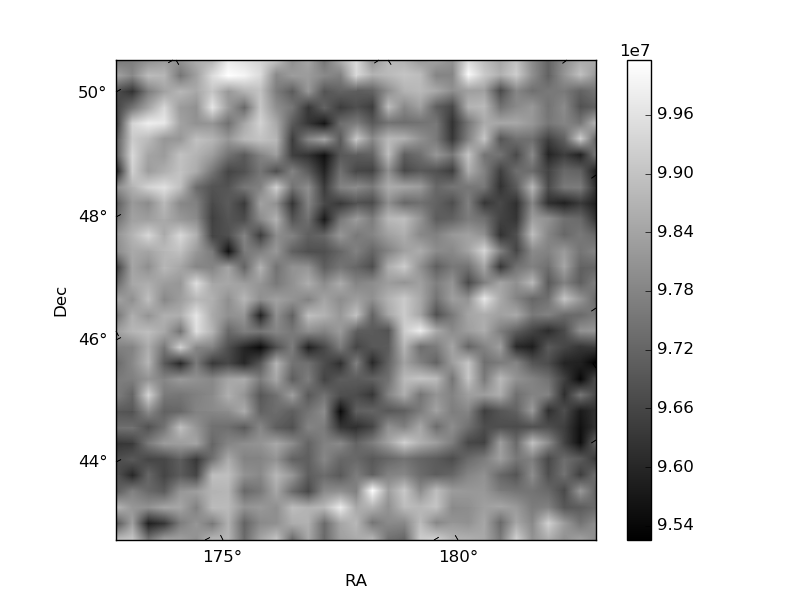
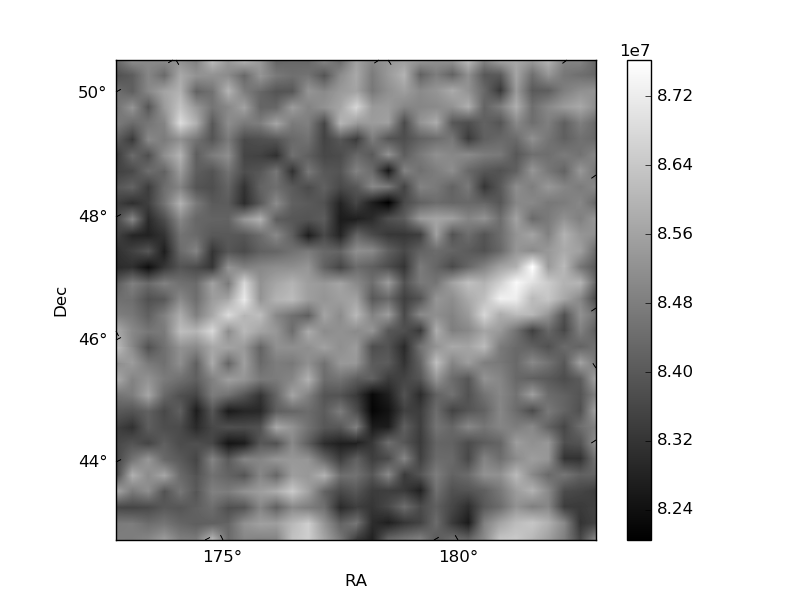
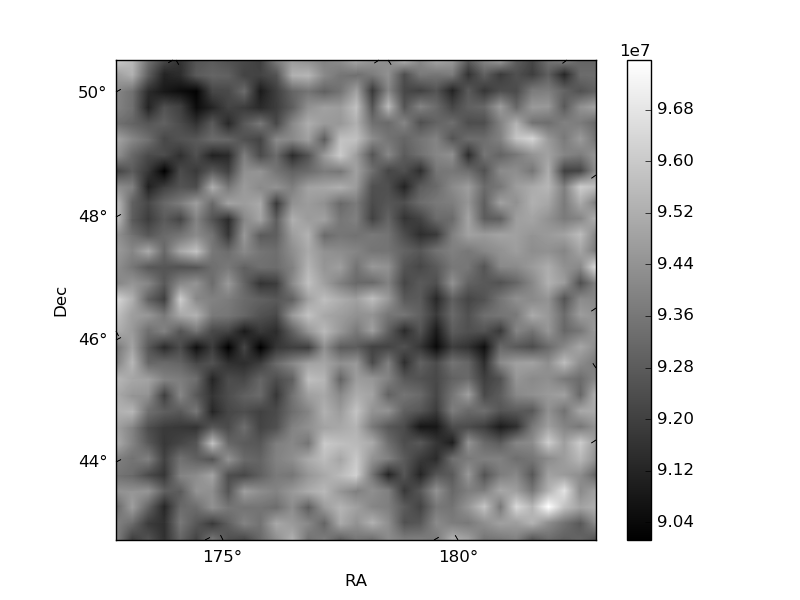
Histogram calculated using DETX and DETY for each event in the final _common_clean file
| Quadrant A | 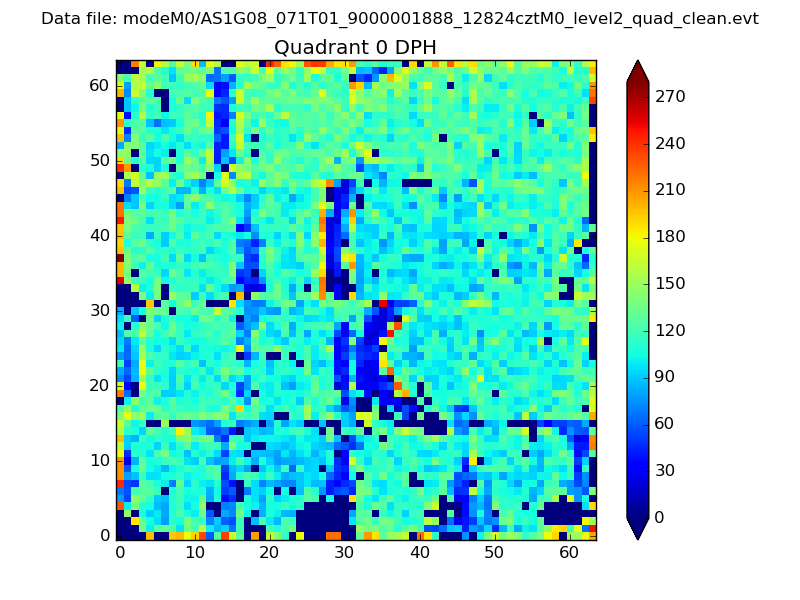 |
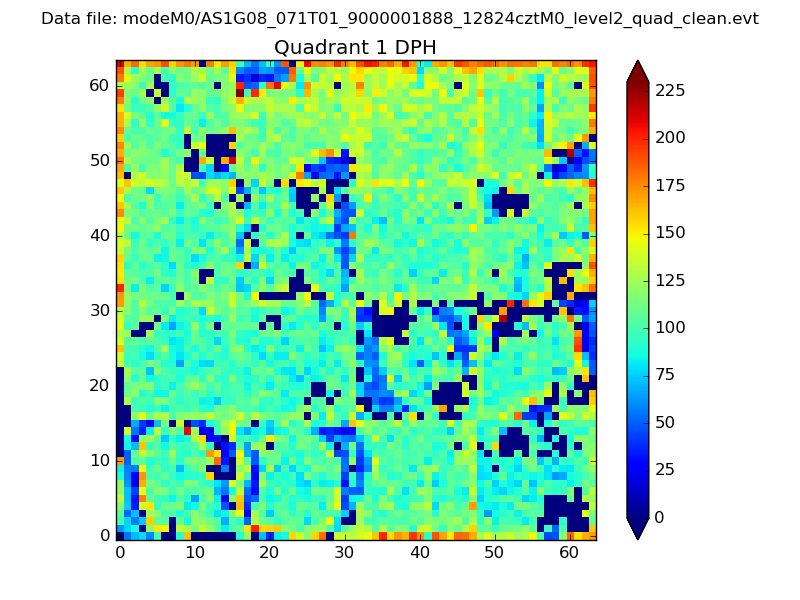 |
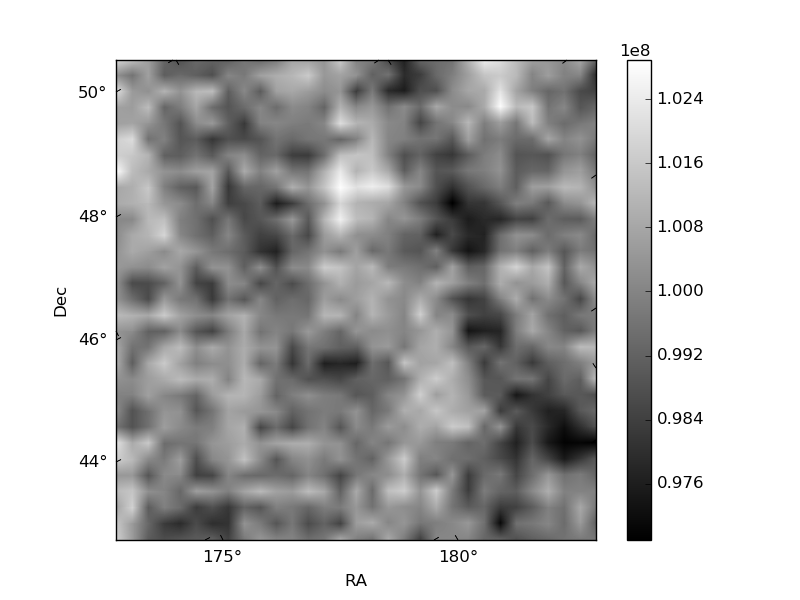
Quadrant B |
|---|---|---|---|
| Quadrant D | 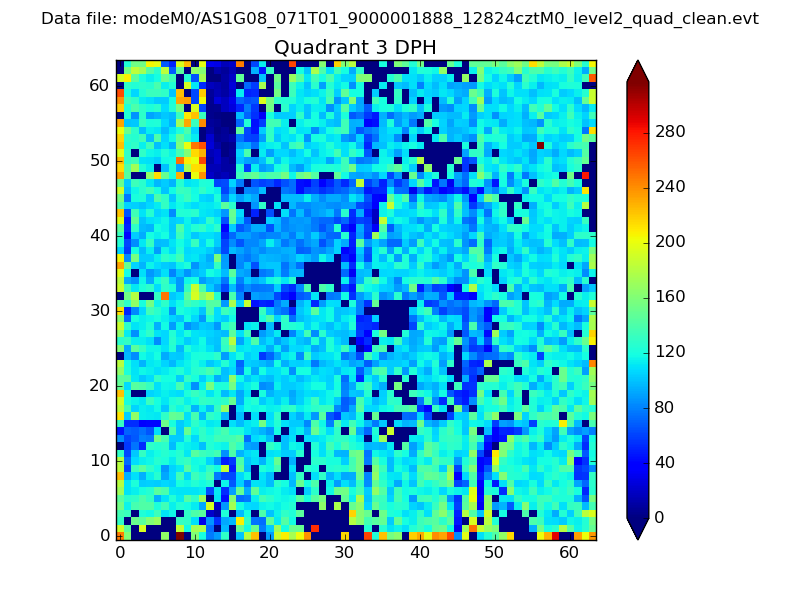 |
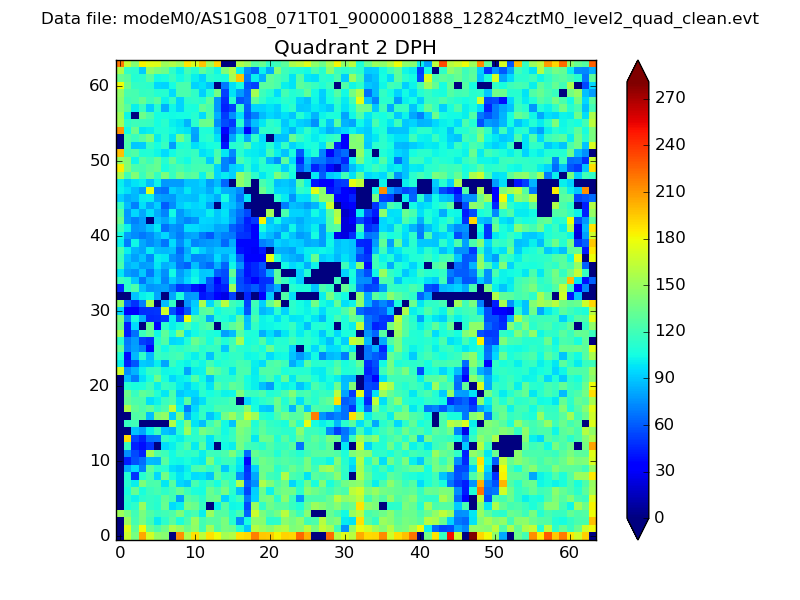 |
Quadrant C |
| Plot type | Count rate plots | Images |
|---|---|---|
| Comparison with Poisson distribution Blue bars denote a histogram of data divided into 1 sec bins. Red curve is a Poisson curve with rate = median count rate of data. |
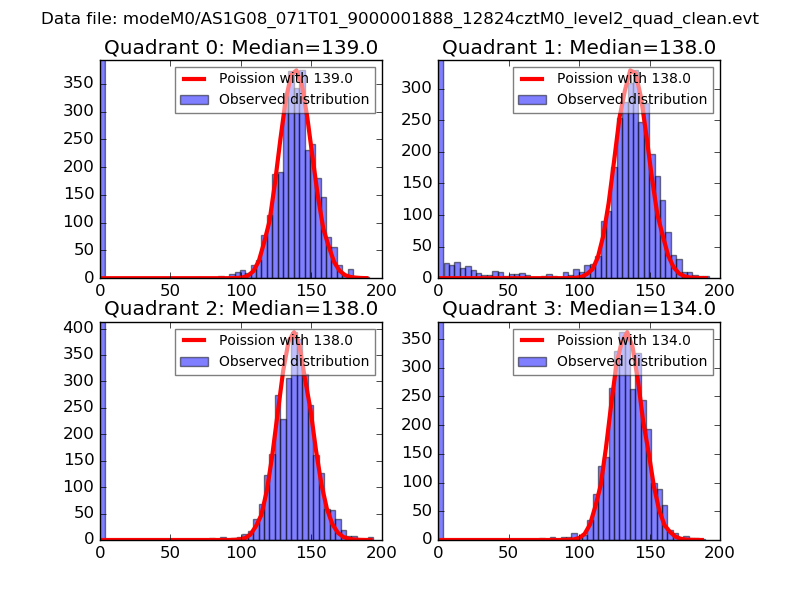 |
 |
| Quadrant-wise count rates Data is divided into 100 sec bins |
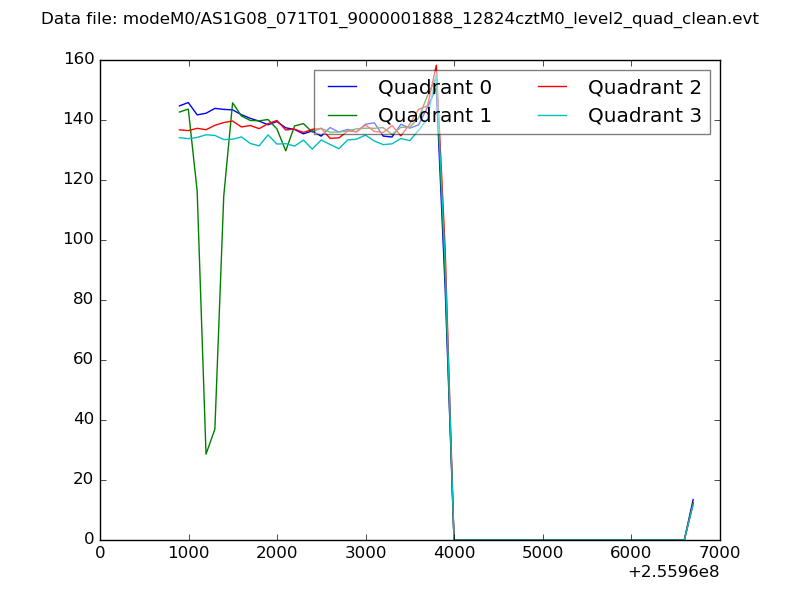 |
|
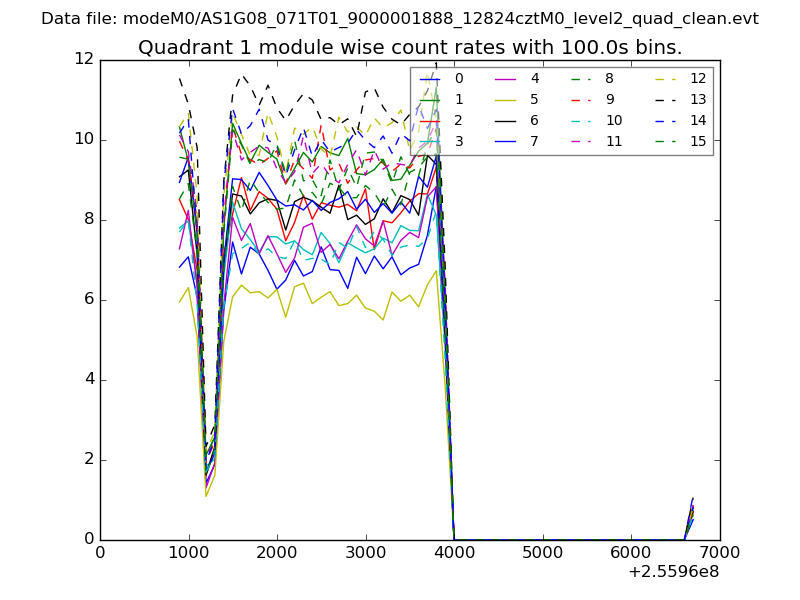
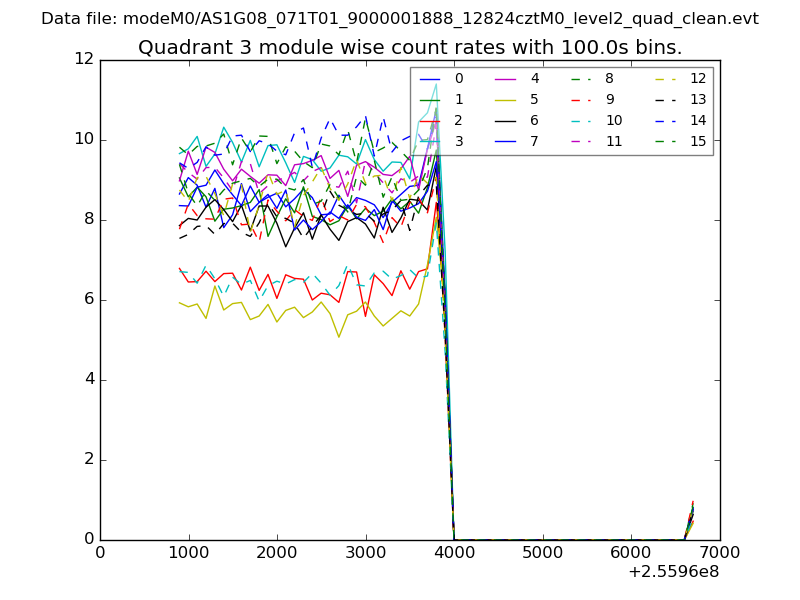
| Module-wise count rates for Quadrant A Data is divided into 100 sec bins |
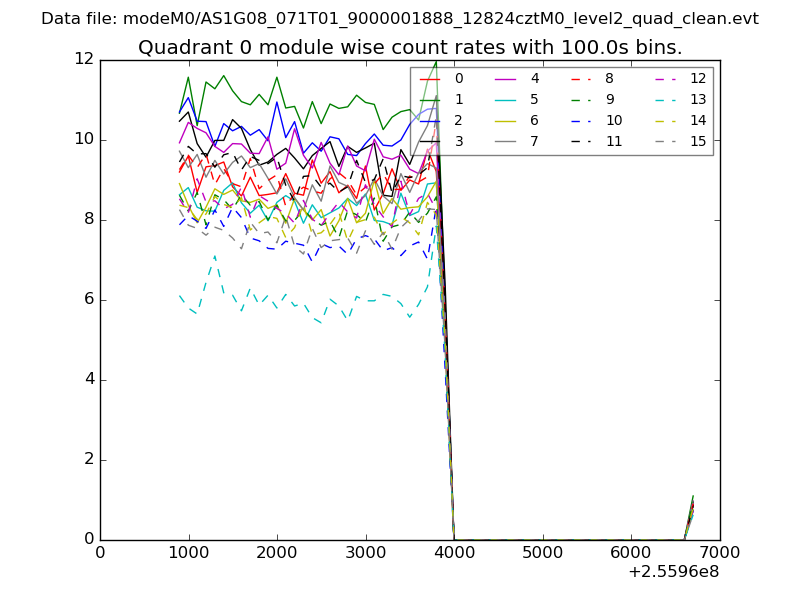 |
 |
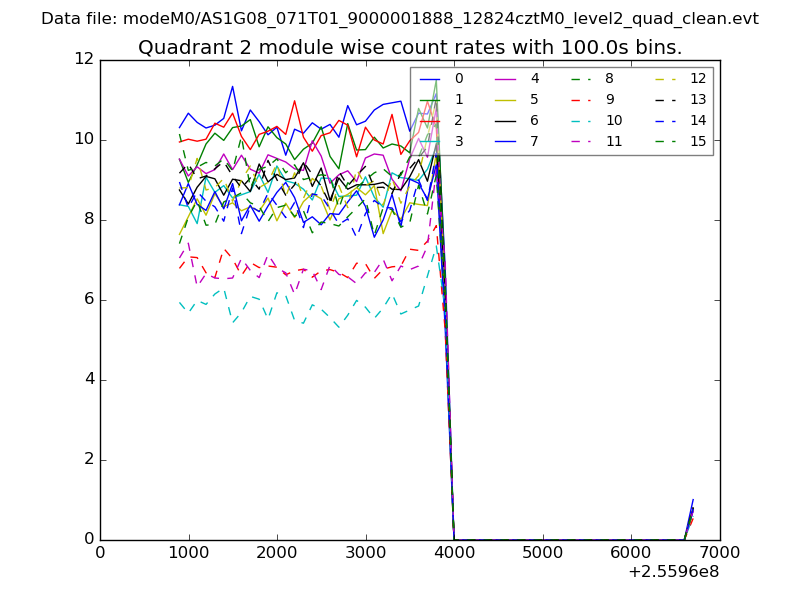
| Module-wise count rates for Quadrant B Data is divided into 100 sec bins |
 |
 |
| Module-wise count rates for Quadrant C Data is divided into 100 sec bins |
 |
 |
| Module-wise count rates for Quadrant D Data is divided into 100 sec bins |
 |
 |
| Parameter | Plot |
|---|---|
| CZT HV Monitor | 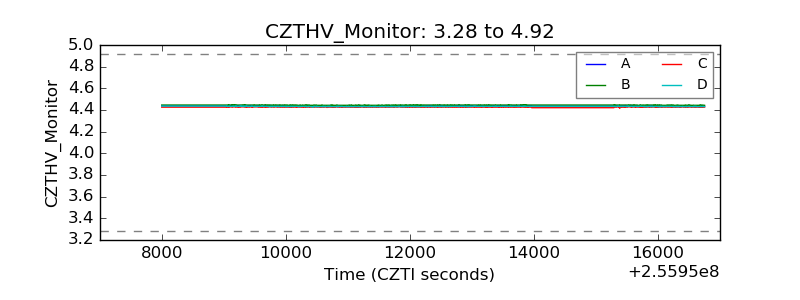 |
| D_VDD | 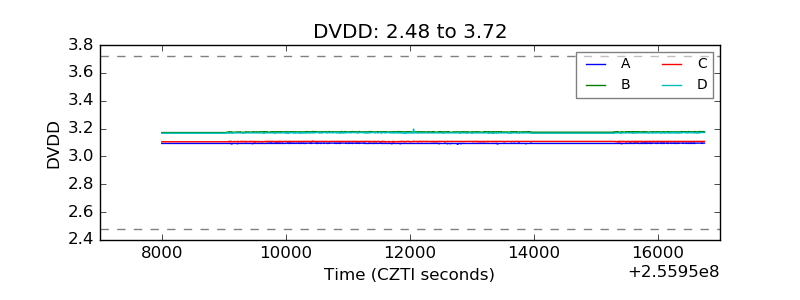 |
| Temperature 1 | 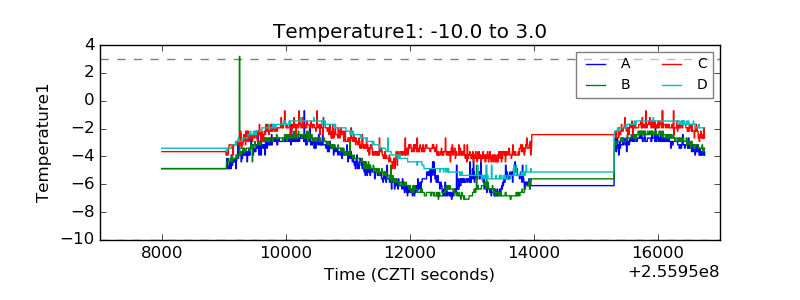 |
| Veto HV Monitor | 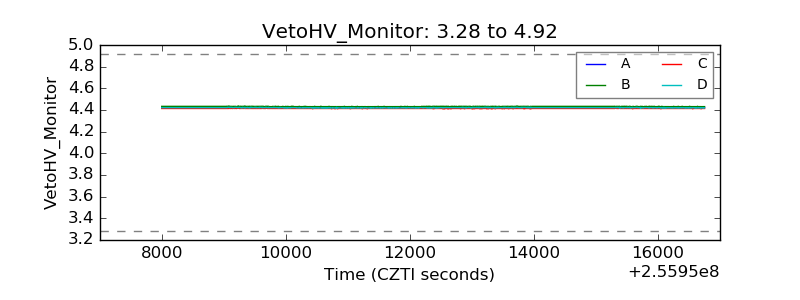 |
| Veto LLD | 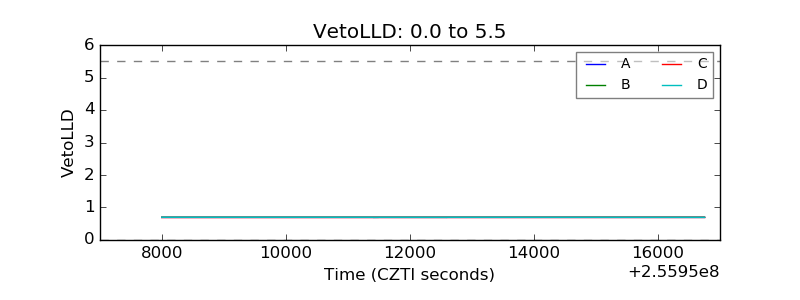 |
| Alpha Counter | 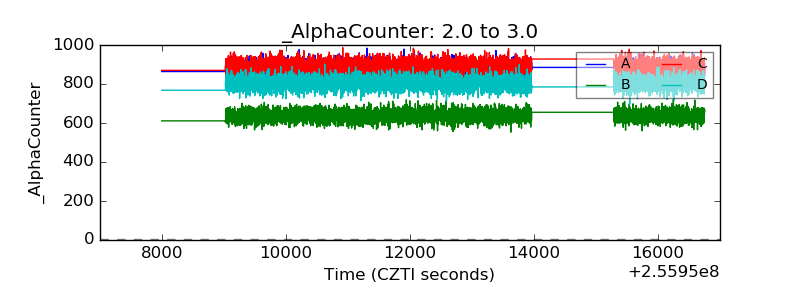 |
| _CPM_Rate | 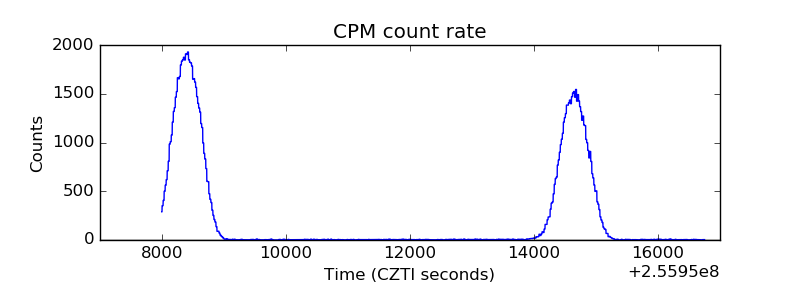 |
| CZT Counter | 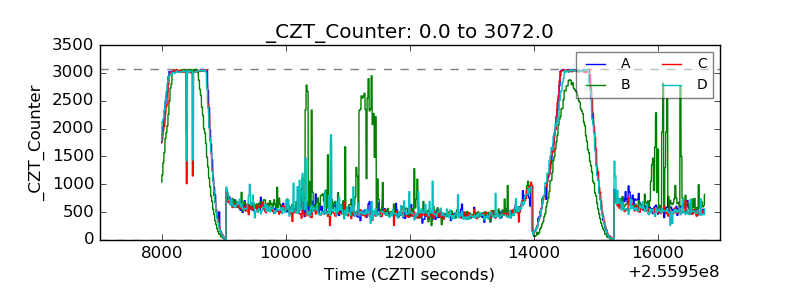 |
| +2.5 Volts monitor |  |
| +5 Volts monitor | 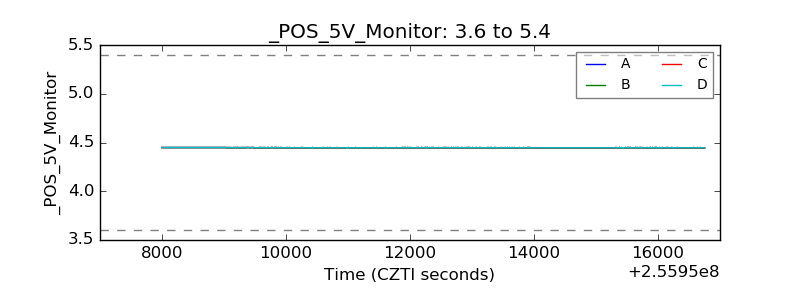 |
| _ROLL_ROT | 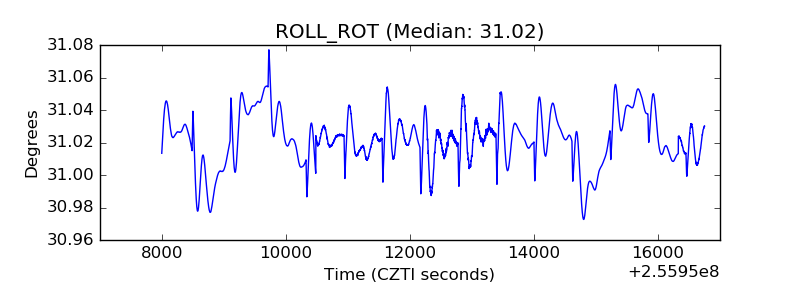 |
| _Roll_DEC | 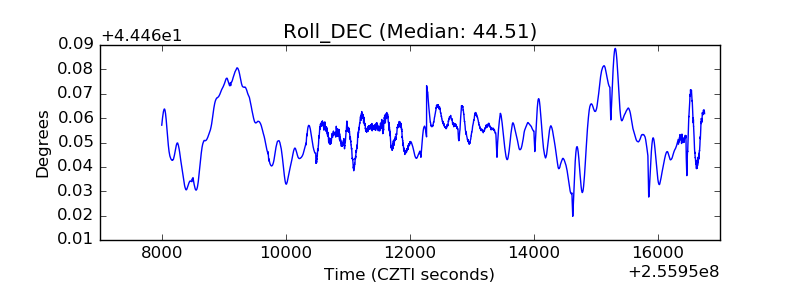 |
| _Roll_RA | 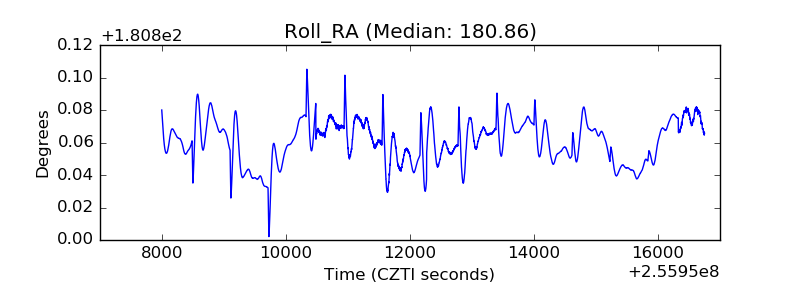 |
| Veto Counter | 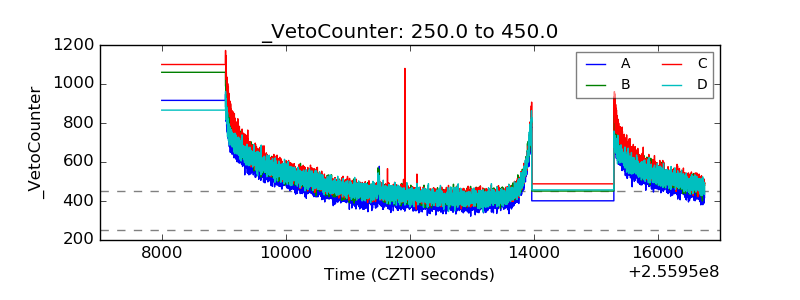 |