| Param | Original file | Final file |
|---|---|---|
| Filename | modeM0/AS1G08_071T01_9000001888_12827cztM0_level2.evt | modeM0/AS1G08_071T01_9000001888_12827cztM0_level2_quad_clean.evt |
| Size (bytes) | 532,846,080 | 96,816,960 |
| Size | 508.2 MB | 92.3 MB |
| Events in quadrant A | 3,930,478 | 625,868 |
| Events in quadrant B | 5,279,346 | 575,750 |
| Events in quadrant C | 3,190,519 | 632,660 |
| Events in quadrant D | 3,261,493 | 609,543 |
| Mode SS | |||
|---|---|---|---|
| Quadrant | BADHDUFLAG | Total packets | Discarded packets |
| A | 0 | 142 | 0 |
| B | 0 | 142 | 0 |
| C | 0 | 142 | 0 |
| D | 0 | 142 | 0 |
| Mode M9 | |||
|---|---|---|---|
| Quadrant | BADHDUFLAG | Total packets | Discarded packets |
| A | 0 | 6 | 0 |
| B | 0 | 6 | 0 |
| C | 0 | 6 | 0 |
| D | 0 | 6 | 0 |
| Mode M0 | |||
|---|---|---|---|
| Quadrant | BADHDUFLAG | Total packets | Discarded packets |
| A | 0 | 16084 | 2 |
| B | 0 | 20382 | 1 |
| C | 0 | 14255 | 1 |
| D | 0 | 14610 | 1 |
| Quadrant | Total seconds | Saturated seconds | Saturation percentage |
|---|---|---|---|
| A | 7005 | 41 | 0.585296% |
| B | 7005 | 795 | 11.349036% |
| C | 7005 | 42 | 0.599572% |
| D | 7005 | 36 | 0.513919% |
Noise dominated data is calculated using 1-second bins in cleaned event files. If a bin has >2000 counts, and if more than 50% of those come from <1% of pixels, then it is considered to be noise-dominated and hence unusable.
| Quadrant | # 1 sec bins | Bins with >0 counts | Bins with >2000 counts | High rate bins dominated by noise | Noise dominated (total time) | Noise dominated (detector-on time) | Marked lightcurve |
|---|---|---|---|---|---|---|---|
| A | 7606 | 7007 | 0 | 0 | 0.00% | 0.00% | 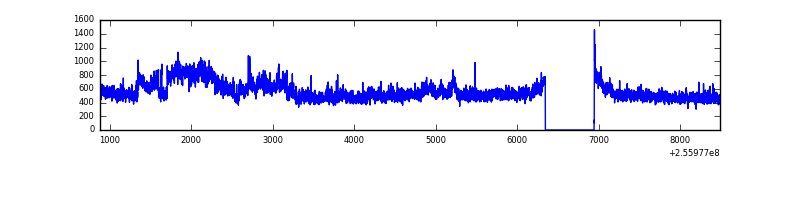 |
| B | 7606 | 7007 | 525 | 525 | 6.90% | 7.49% | 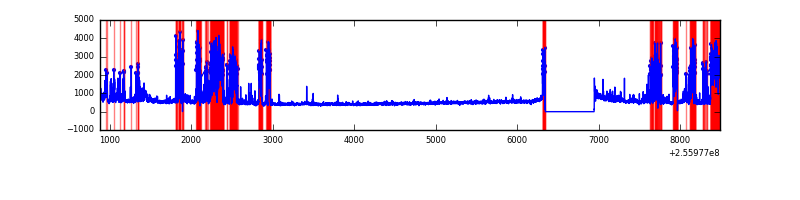 |
| C | 7606 | 7007 | 0 | 0 | 0.00% | 0.00% |  |
| D | 7606 | 7007 | 8 | 8 | 0.11% | 0.11% | 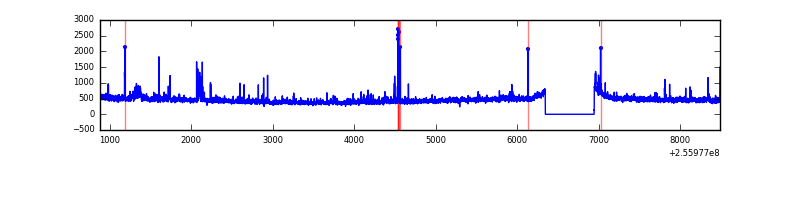 |
Top three noisy pixels from each quadrant. If the there are fewer than three noisy pixels in the level2.evt file, extra rows are filled as -1
| Pixel properties | Quadrant properties | ||||||
|---|---|---|---|---|---|---|---|
| Quadrant | DetID | PixID | Counts | Sigma | Mean | Median | Sigma |
| A | 15 | 222 | 656613 | 3874.82 | 836 | 815 | 169.2 |
| A | 12 | 189 | 62596 | 365.04 | 836 | 815 | 169.2 |
| A | 0 | 226 | 7305 | 38.35 | 836 | 815 | 169.2 |
| B | 4 | 239 | 1998218 | 13406.79 | 785 | 766 | 149.0 |
| B | 0 | 219 | 130722 | 872.26 | 785 | 766 | 149.0 |
| B | 0 | 214 | 21730 | 140.71 | 785 | 766 | 149.0 |
| C | 13 | 61 | 6109 | 28.0 | 818 | 821 | 188.9 |
| C | 3 | 202 | 2052 | 6.52 | 818 | 821 | 188.9 |
| C | 8 | 222 | 1795 | 5.16 | 818 | 821 | 188.9 |
| D | 1 | 52 | 97808 | 459.78 | 808 | 789 | 211.0 |
| D | 13 | 104 | 50822 | 237.11 | 808 | 789 | 211.0 |
| D | 2 | 234 | 25369 | 116.49 | 808 | 789 | 211.0 |
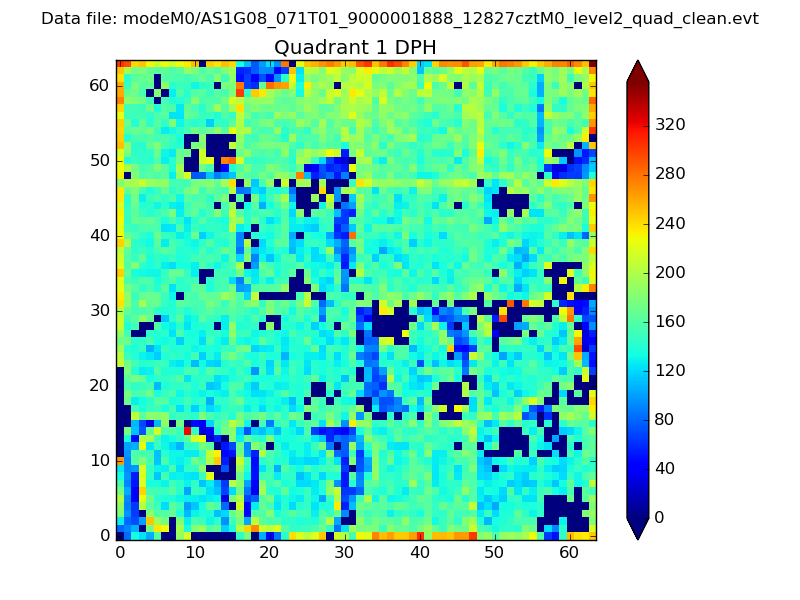
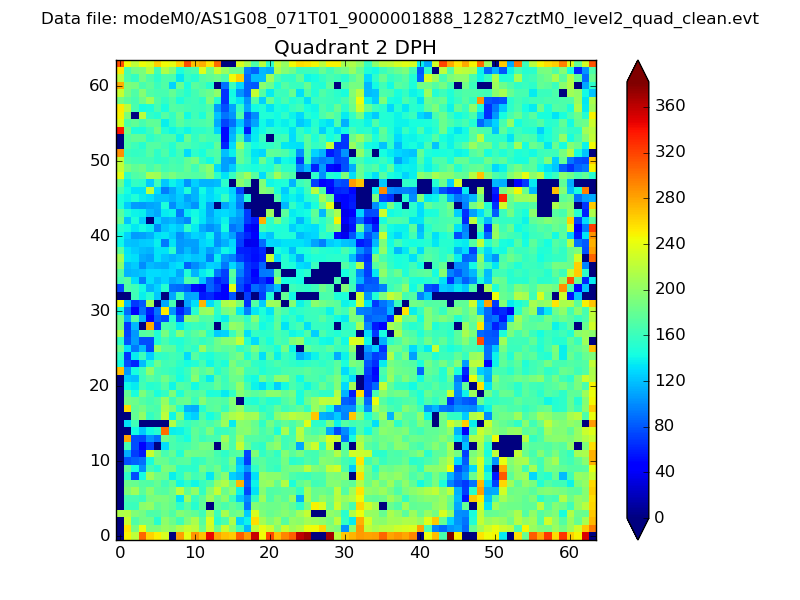
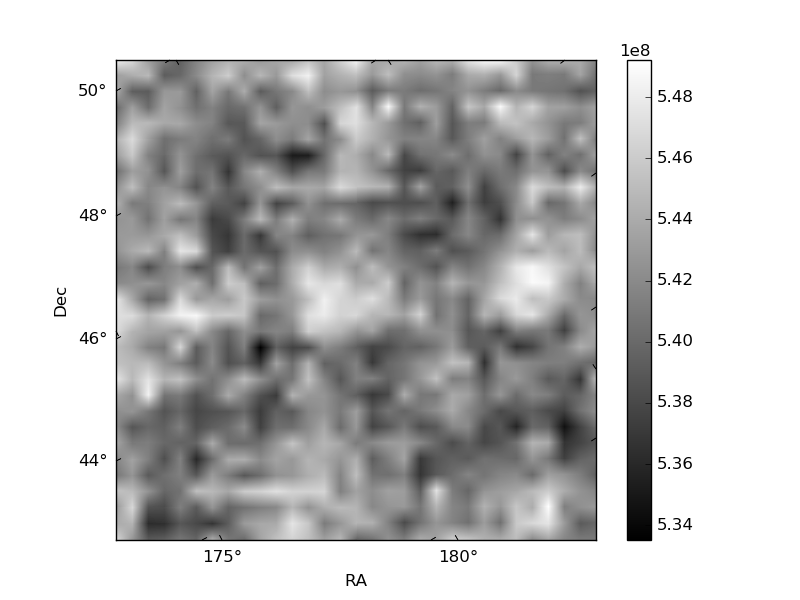
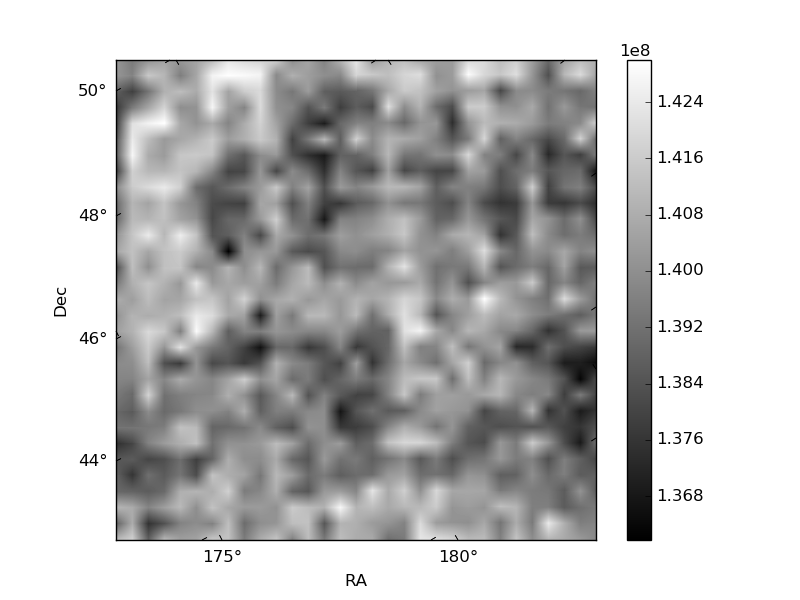
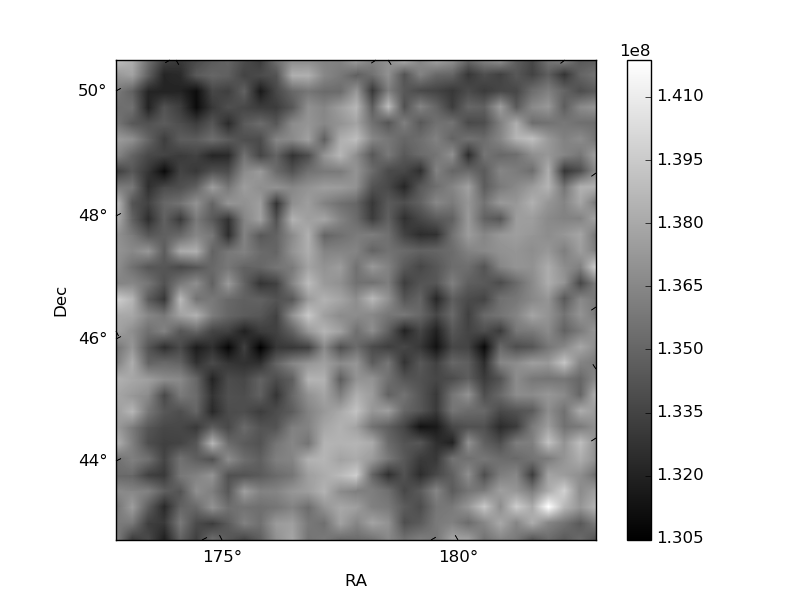
Histogram calculated using DETX and DETY for each event in the final _common_clean file
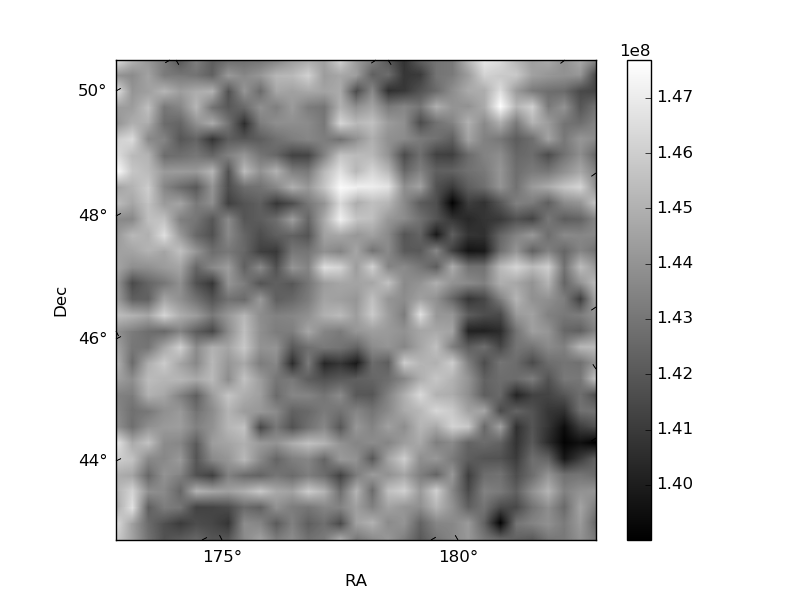
| Quadrant A | 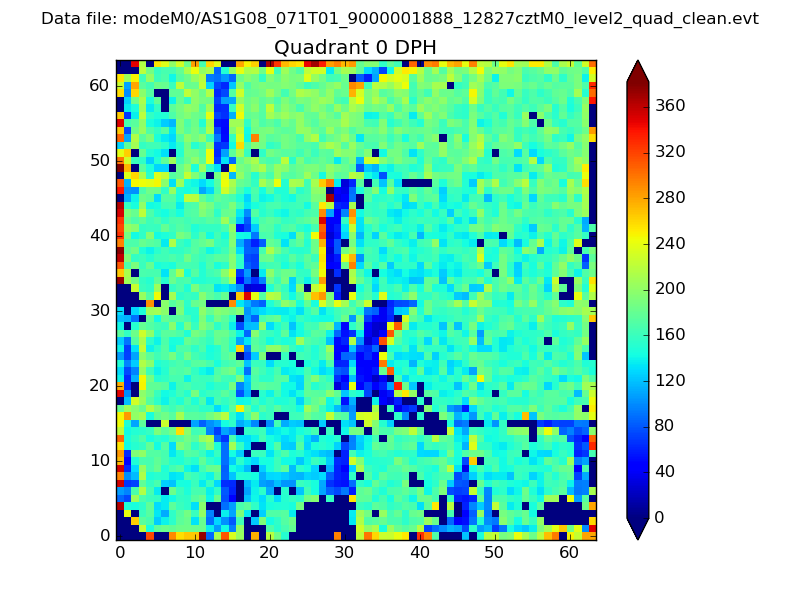 |
 |
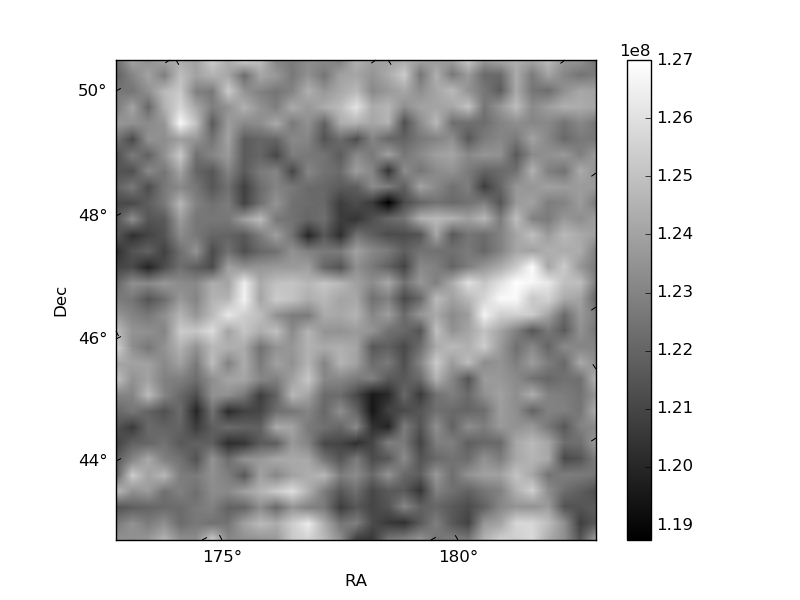
Quadrant B |
|---|---|---|---|
| Quadrant D | 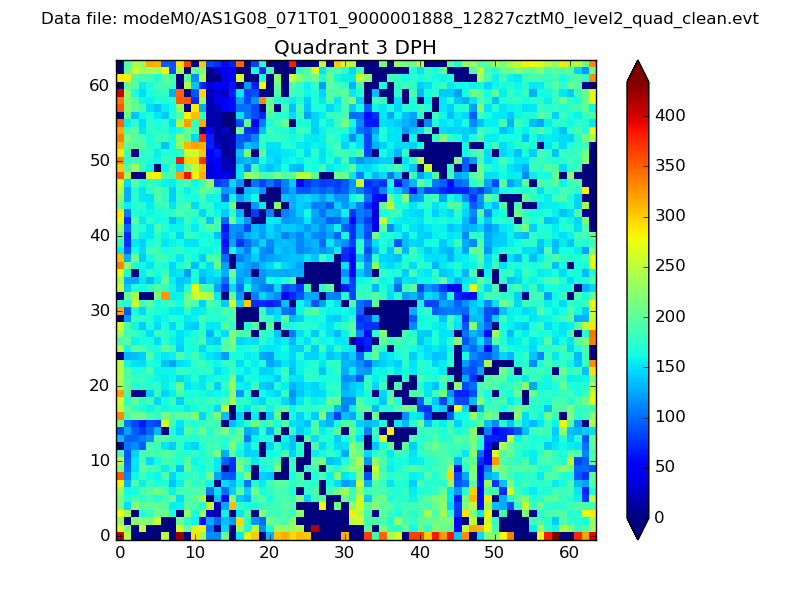 |
 |
Quadrant C |
| Plot type | Count rate plots | Images |
|---|---|---|
| Comparison with Poisson distribution Blue bars denote a histogram of data divided into 1 sec bins. Red curve is a Poisson curve with rate = median count rate of data. |
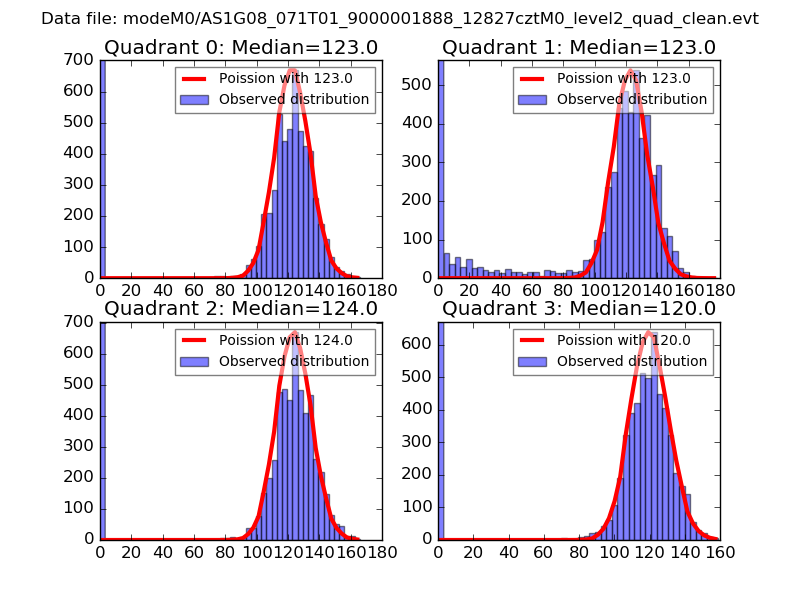 |
 |
| Quadrant-wise count rates Data is divided into 100 sec bins |
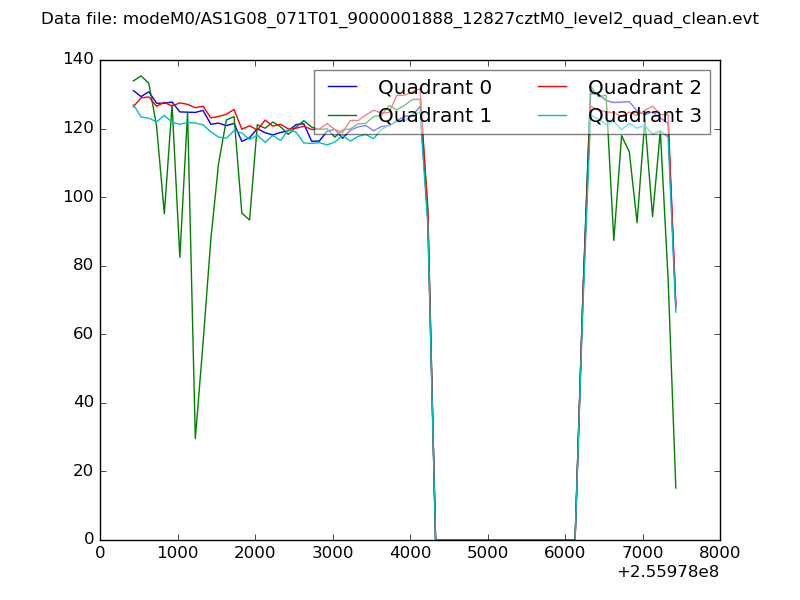 |
|
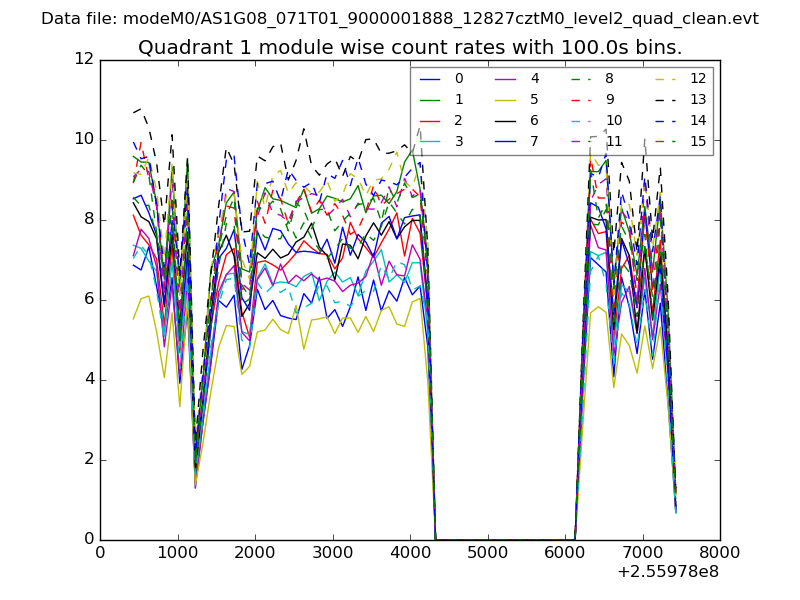
| Module-wise count rates for Quadrant A Data is divided into 100 sec bins |
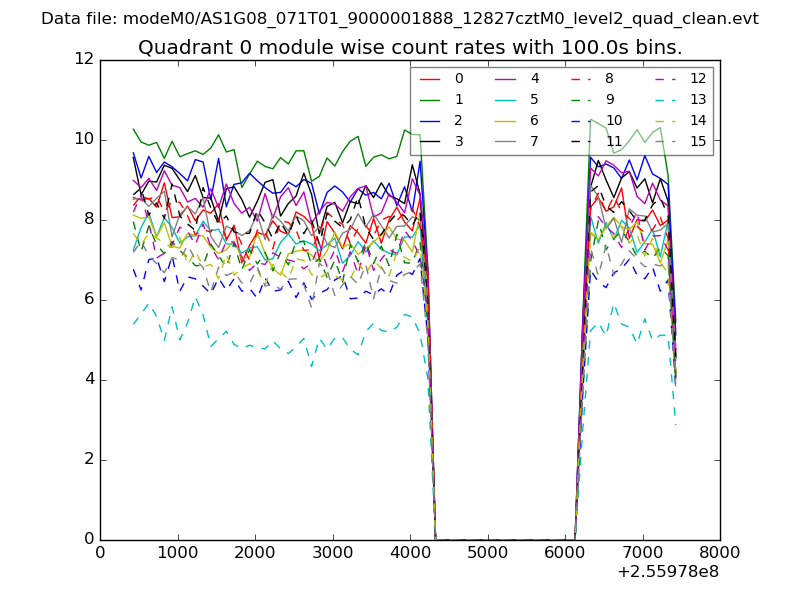 |
 |
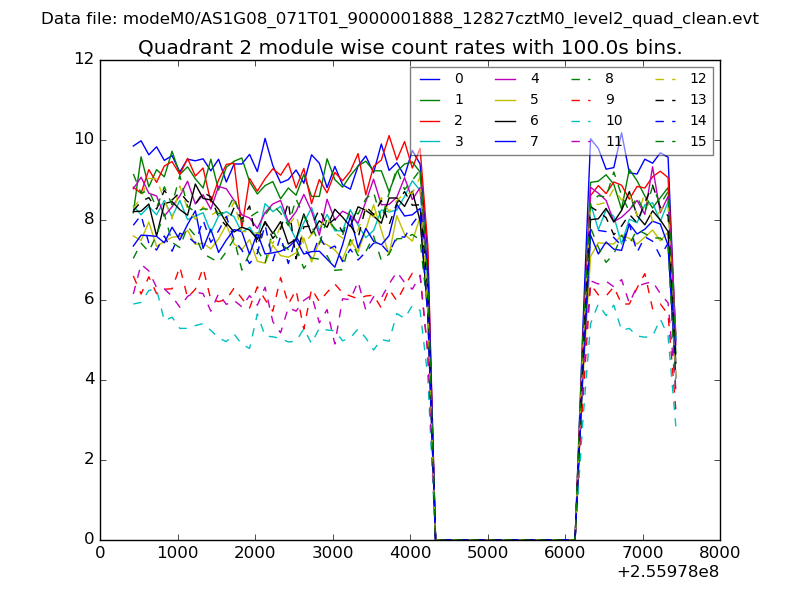
| Module-wise count rates for Quadrant B Data is divided into 100 sec bins |
 |
 |
| Module-wise count rates for Quadrant C Data is divided into 100 sec bins |
 |
 |
| Module-wise count rates for Quadrant D Data is divided into 100 sec bins |
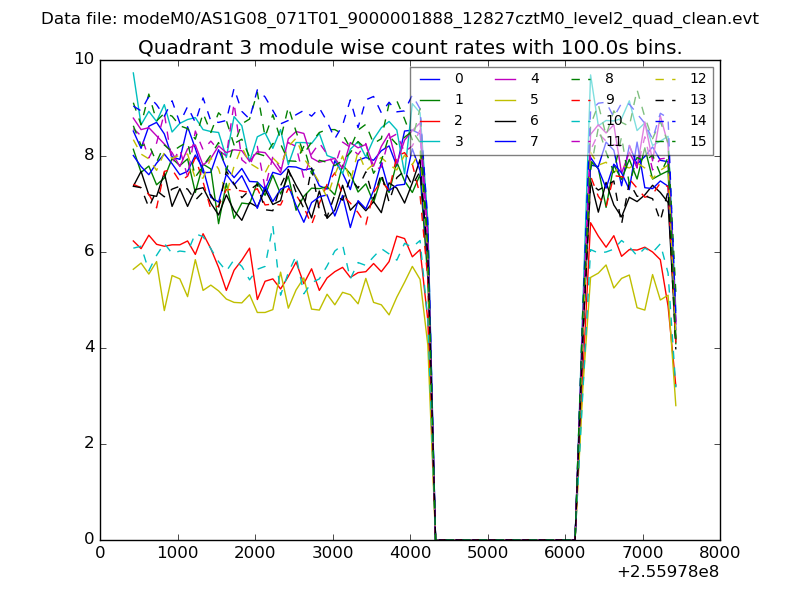 |
 |
| Parameter | Plot |
|---|---|
| CZT HV Monitor | 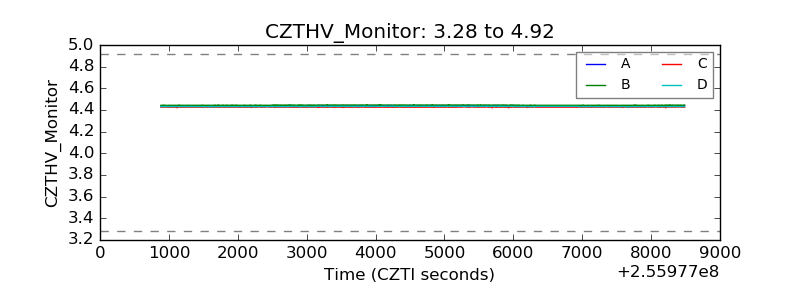 |
| D_VDD | 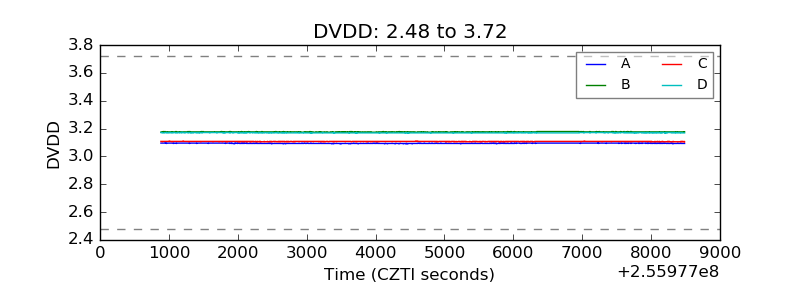 |
| Temperature 1 | 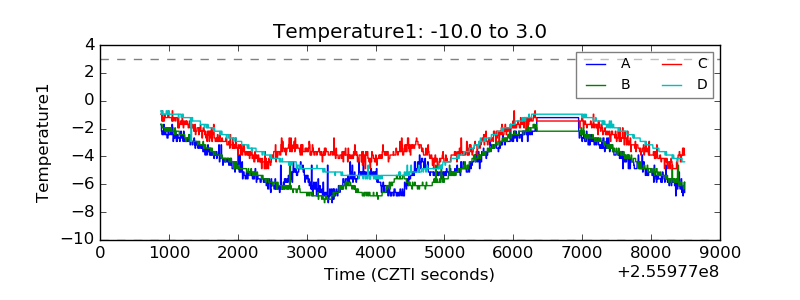 |
| Veto HV Monitor | 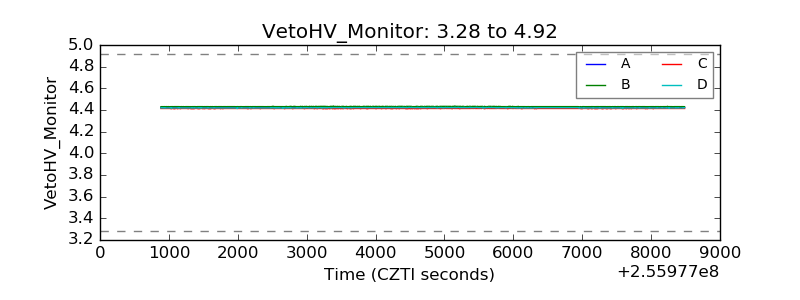 |
| Veto LLD | 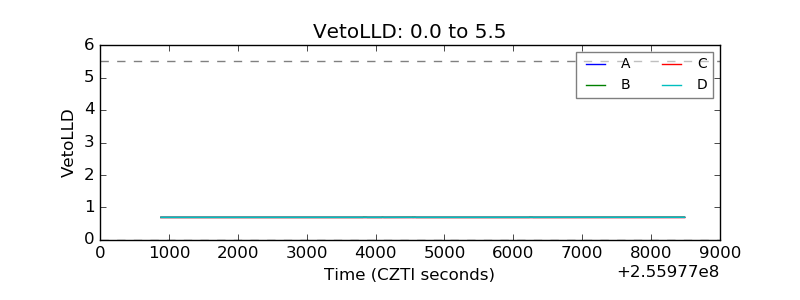 |
| Alpha Counter | 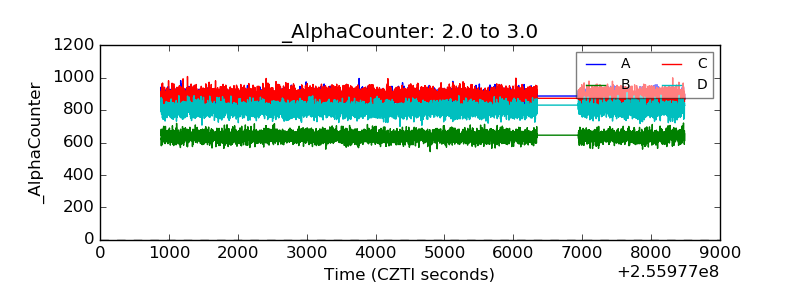 |
| _CPM_Rate | 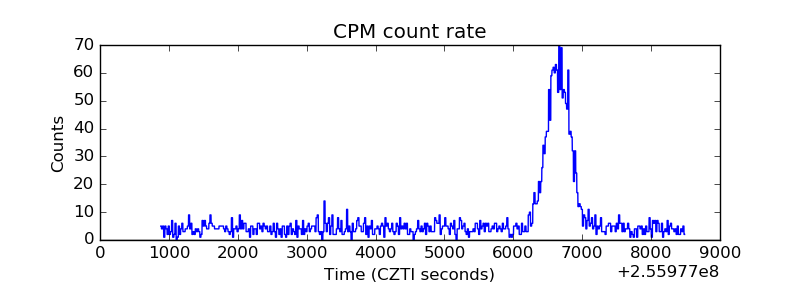 |
| CZT Counter | 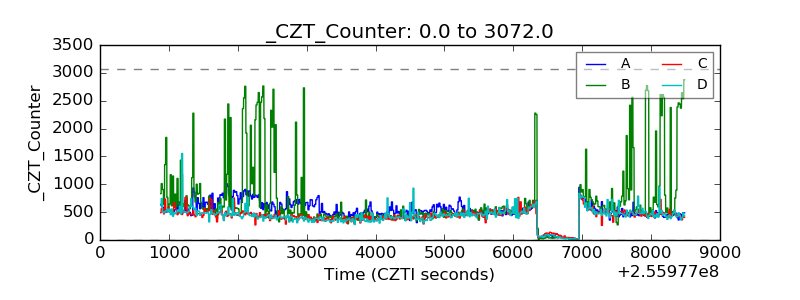 |
| +2.5 Volts monitor |  |
| +5 Volts monitor |  |
| _ROLL_ROT | 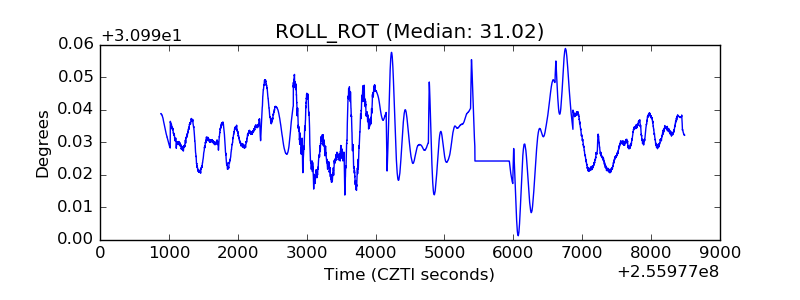 |
| _Roll_DEC | 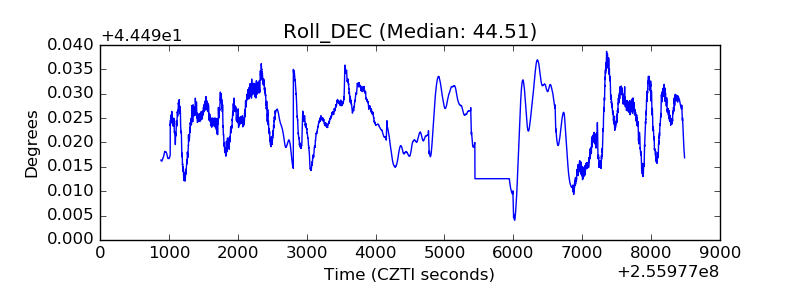 |
| _Roll_RA | 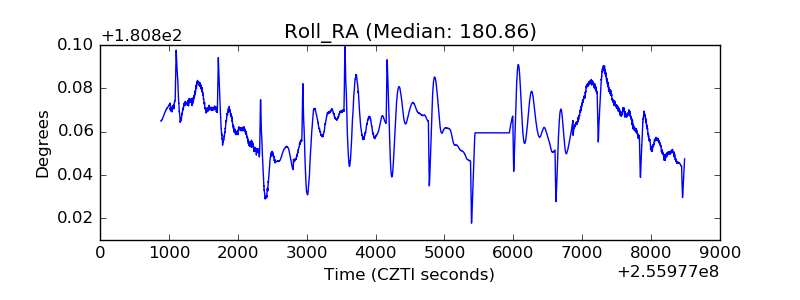 |
| Veto Counter | 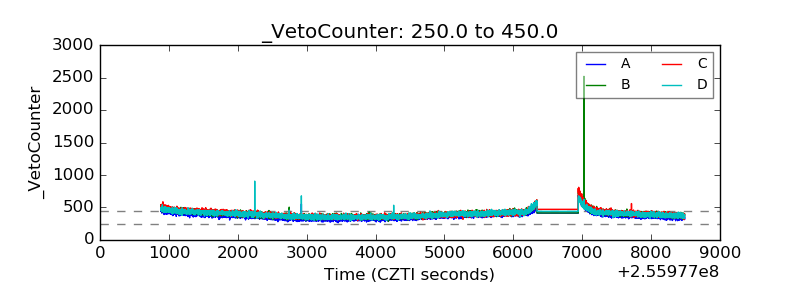 |