| Param | Original file | Final file |
|---|---|---|
| Filename | modeM0/AS1G08_071T01_9000001888_12828cztM0_level2.evt | modeM0/AS1G08_071T01_9000001888_12828cztM0_level2_quad_clean.evt |
| Size (bytes) | 612,832,320 | 102,159,360 |
| Size | 584.4 MB | 97.4 MB |
| Events in quadrant A | 3,765,325 | 657,552 |
| Events in quadrant B | 6,582,893 | 582,962 |
| Events in quadrant C | 3,667,641 | 662,112 |
| Events in quadrant D | 4,006,566 | 640,362 |
| Mode SS | |||
|---|---|---|---|
| Quadrant | BADHDUFLAG | Total packets | Discarded packets |
| A | 0 | 162 | 0 |
| B | 0 | 162 | 0 |
| C | 0 | 162 | 0 |
| D | 0 | 162 | 0 |
| Mode M9 | |||
|---|---|---|---|
| Quadrant | BADHDUFLAG | Total packets | Discarded packets |
| A | 0 | 9 | 0 |
| B | 0 | 9 | 0 |
| C | 0 | 9 | 0 |
| D | 0 | 9 | 0 |
| Mode M0 | |||
|---|---|---|---|
| Quadrant | BADHDUFLAG | Total packets | Discarded packets |
| A | 0 | 16528 | 3 |
| B | 0 | 24957 | 2 |
| C | 0 | 16406 | 2 |
| D | 0 | 17567 | 2 |
| Quadrant | Total seconds | Saturated seconds | Saturation percentage |
|---|---|---|---|
| A | 7919 | 80 | 1.010229% |
| B | 7919 | 1303 | 16.454098% |
| C | 7919 | 68 | 0.858694% |
| D | 7919 | 93 | 1.174391% |
Noise dominated data is calculated using 1-second bins in cleaned event files. If a bin has >2000 counts, and if more than 50% of those come from <1% of pixels, then it is considered to be noise-dominated and hence unusable.
| Quadrant | # 1 sec bins | Bins with >0 counts | Bins with >2000 counts | High rate bins dominated by noise | Noise dominated (total time) | Noise dominated (detector-on time) | Marked lightcurve |
|---|---|---|---|---|---|---|---|
| A | 8810 | 7923 | 0 | 0 | 0.00% | 0.00% | 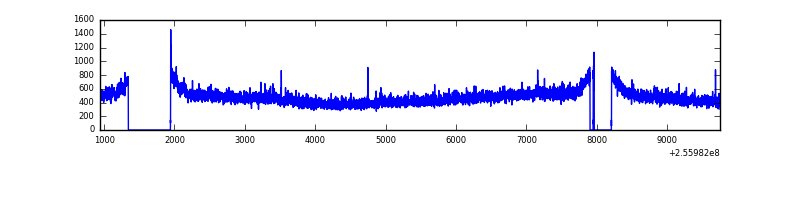 |
| B | 8810 | 7923 | 860 | 860 | 9.76% | 10.85% | 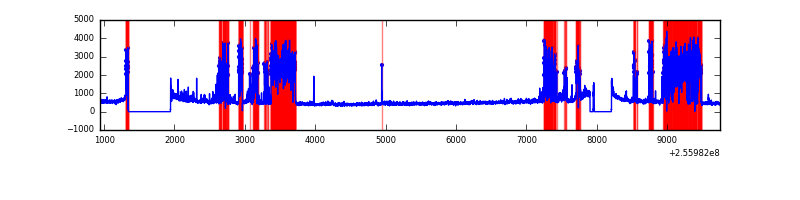 |
| C | 8810 | 7923 | 0 | 0 | 0.00% | 0.00% | 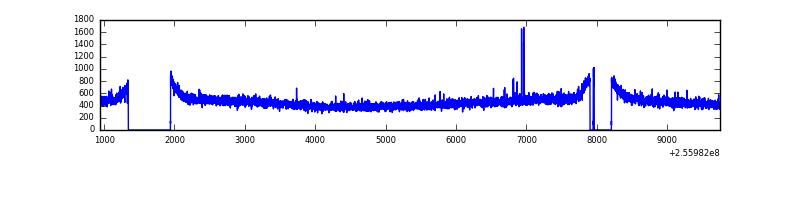 |
| D | 8810 | 7923 | 22 | 22 | 0.25% | 0.28% | 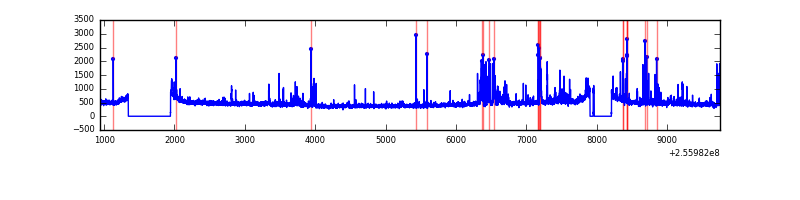 |
Top three noisy pixels from each quadrant. If the there are fewer than three noisy pixels in the level2.evt file, extra rows are filled as -1
| Pixel properties | Quadrant properties | ||||||
|---|---|---|---|---|---|---|---|
| Quadrant | DetID | PixID | Counts | Sigma | Mean | Median | Sigma |
| A | 12 | 189 | 66827 | 335.65 | 959 | 936 | 196.3 |
| A | 15 | 222 | 12255 | 57.66 | 959 | 936 | 196.3 |
| A | 0 | 226 | 8524 | 38.65 | 959 | 936 | 196.3 |
| B | 4 | 239 | 2818717 | 16896.16 | 875 | 854 | 166.8 |
| B | 0 | 219 | 170454 | 1016.94 | 875 | 854 | 166.8 |
| B | 3 | 209 | 67547 | 399.9 | 875 | 854 | 166.8 |
| C | 14 | 234 | 9807 | 40.83 | 937 | 943 | 217.1 |
| C | 13 | 61 | 6815 | 27.05 | 937 | 943 | 217.1 |
| C | 3 | 233 | 3323 | 10.96 | 937 | 943 | 217.1 |
| D | 1 | 52 | 241971 | 997.84 | 925 | 901 | 241.6 |
| D | 2 | 136 | 97603 | 400.27 | 925 | 901 | 241.6 |
| D | 13 | 172 | 91411 | 374.64 | 925 | 901 | 241.6 |
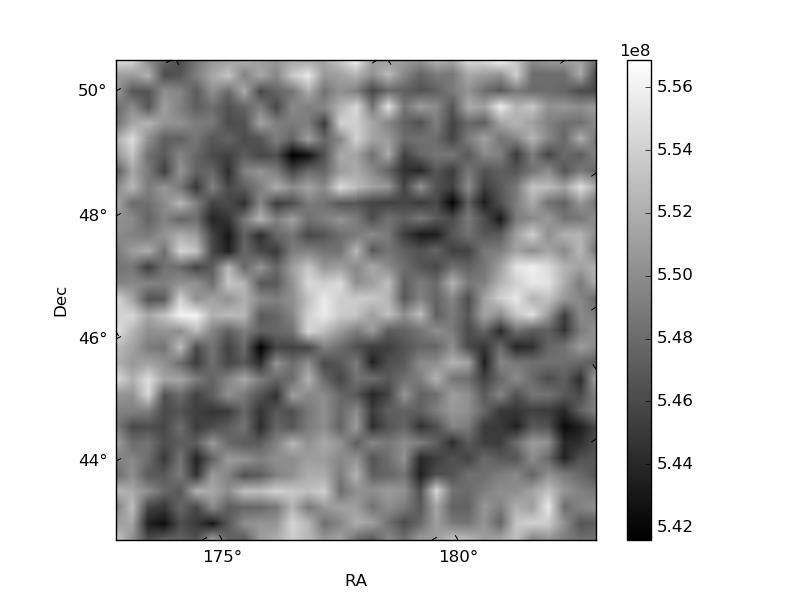
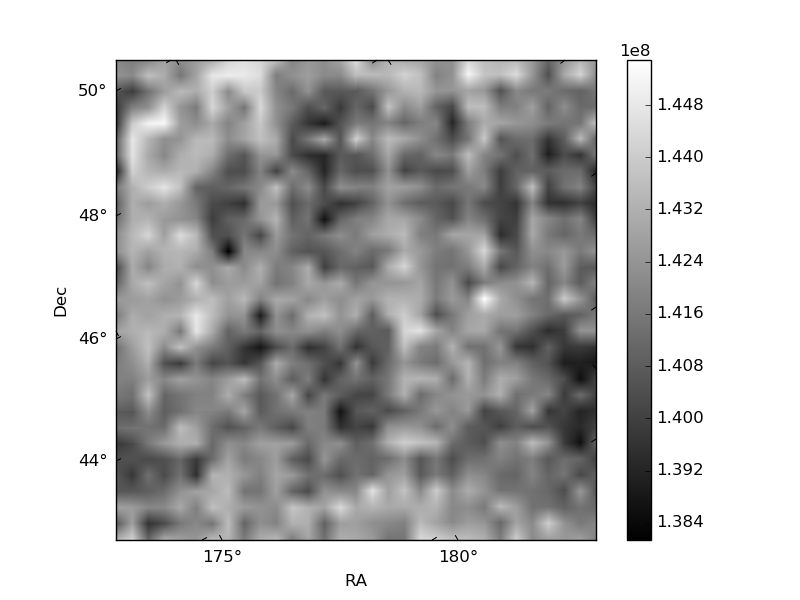
Histogram calculated using DETX and DETY for each event in the final _common_clean file
| Quadrant A | 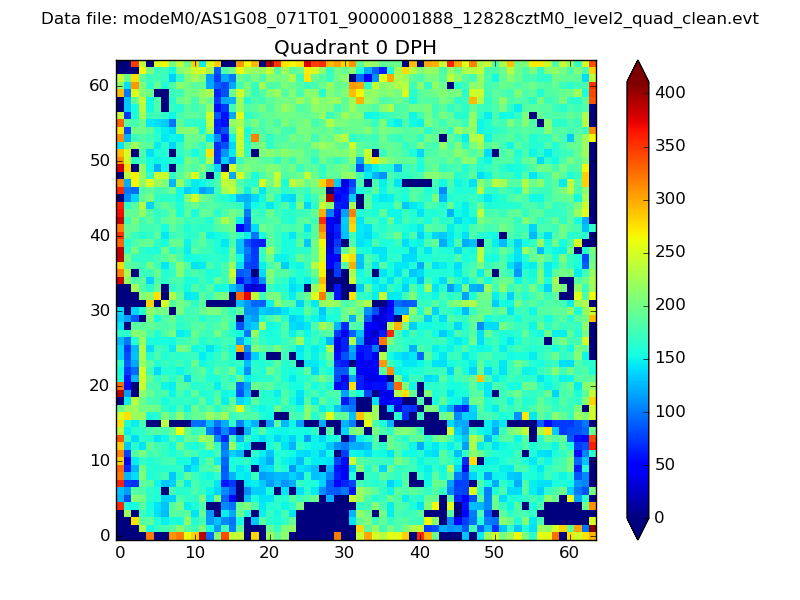 |
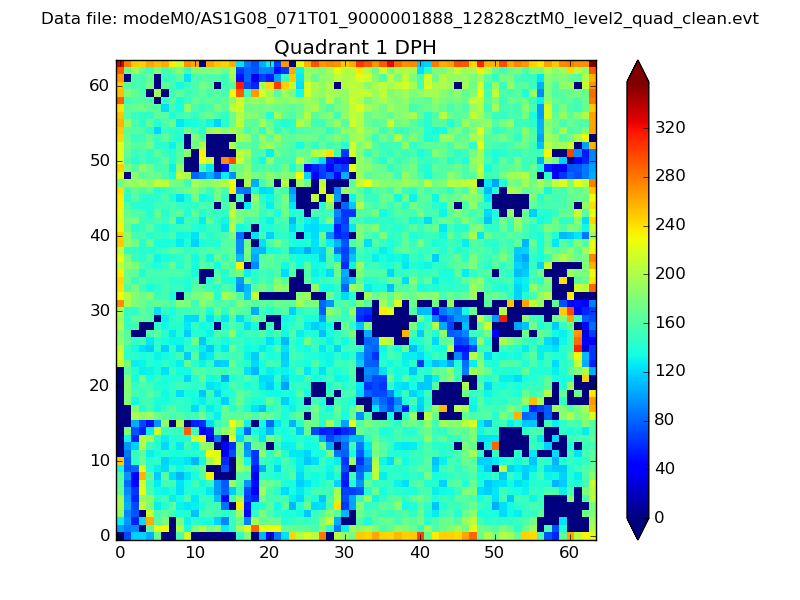 |
Quadrant B |
|---|---|---|---|
| Quadrant D | 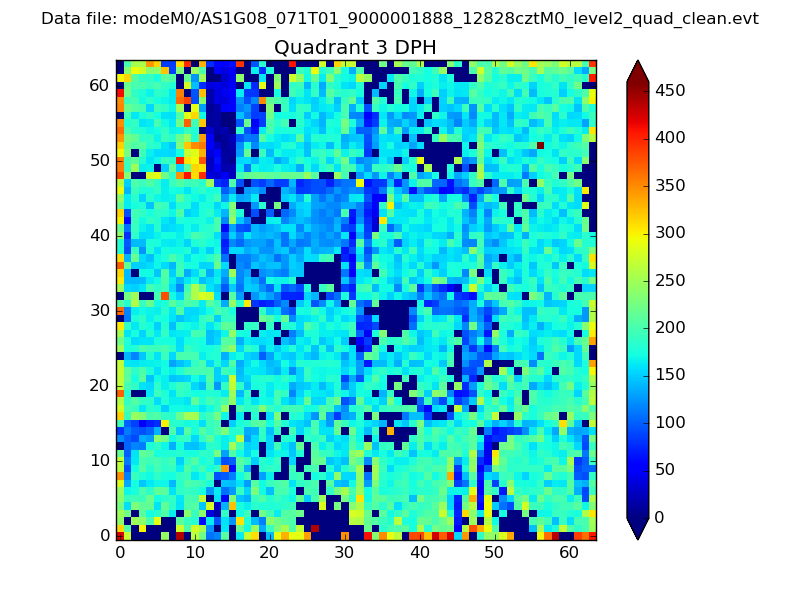 |
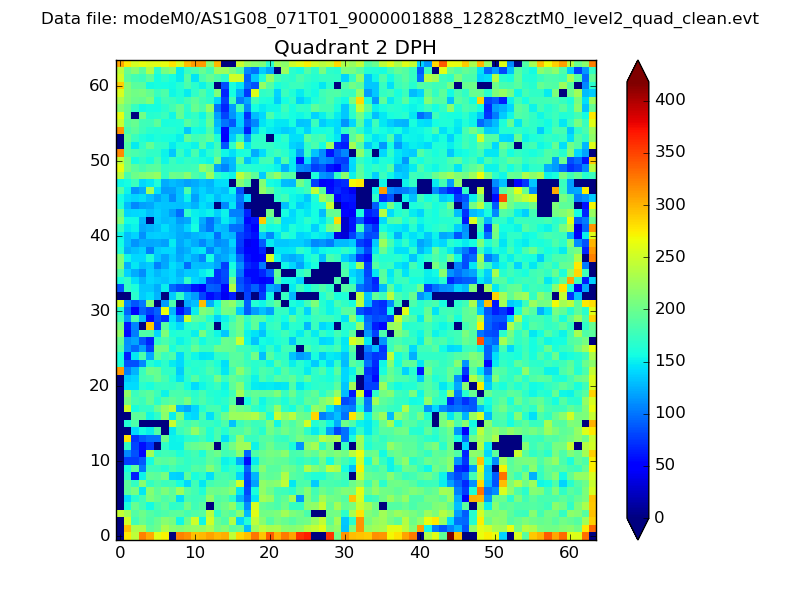 |
Quadrant C |
| Plot type | Count rate plots | Images |
|---|---|---|
| Comparison with Poisson distribution Blue bars denote a histogram of data divided into 1 sec bins. Red curve is a Poisson curve with rate = median count rate of data. |
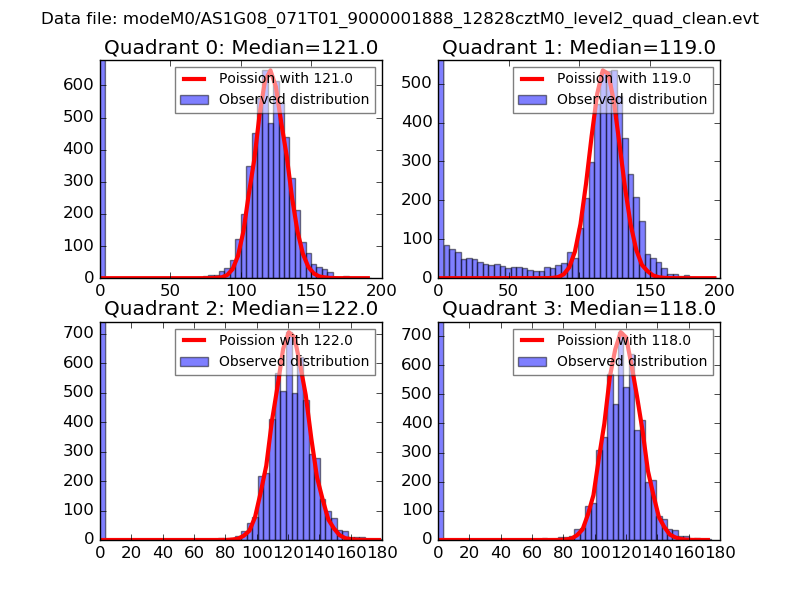 |
 |
| Quadrant-wise count rates Data is divided into 100 sec bins |
 |
|
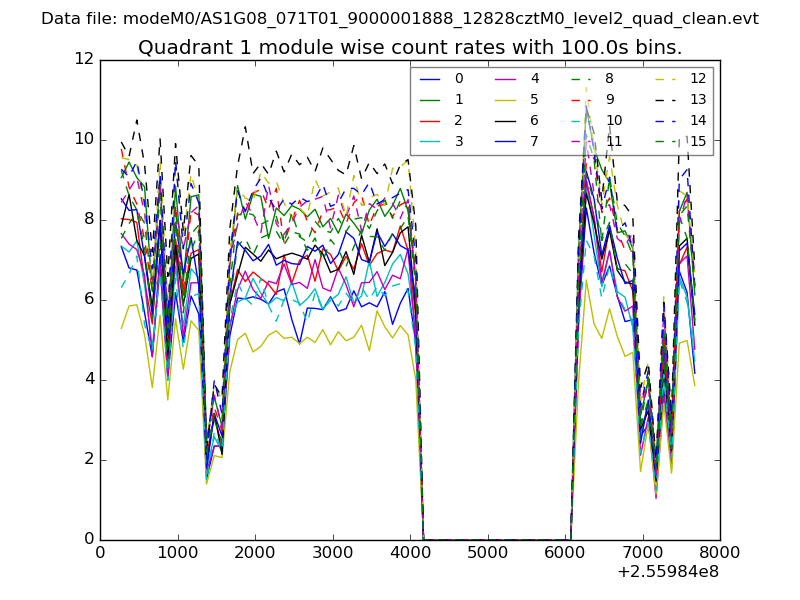
| Module-wise count rates for Quadrant A Data is divided into 100 sec bins |
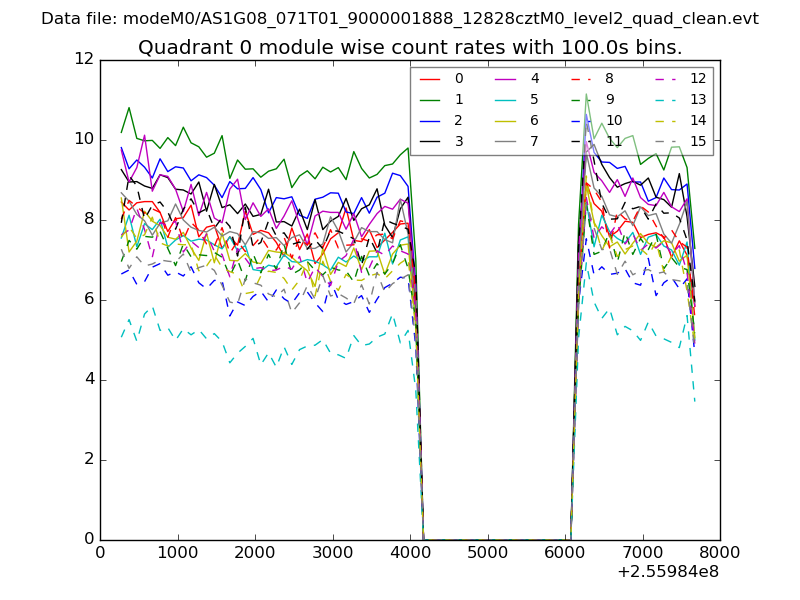 |
 |
| Module-wise count rates for Quadrant B Data is divided into 100 sec bins |
 |
 |
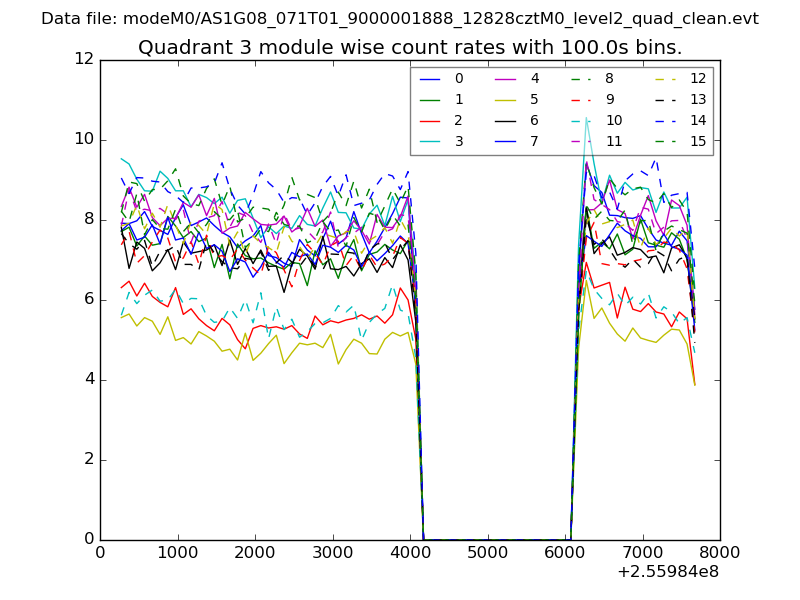
| Module-wise count rates for Quadrant C Data is divided into 100 sec bins |
 |
 |
| Module-wise count rates for Quadrant D Data is divided into 100 sec bins |
 |
 |
| Parameter | Plot |
|---|---|
| CZT HV Monitor | 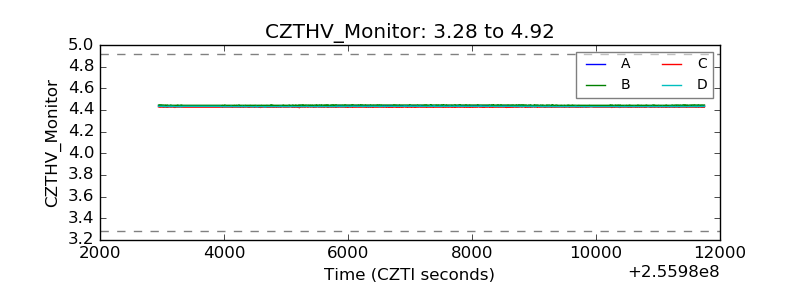 |
| D_VDD | 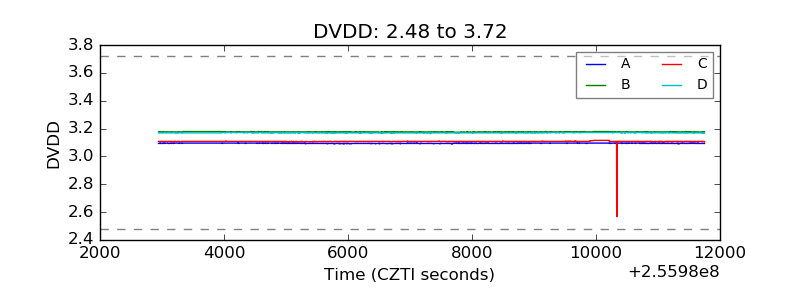 |
| Temperature 1 | 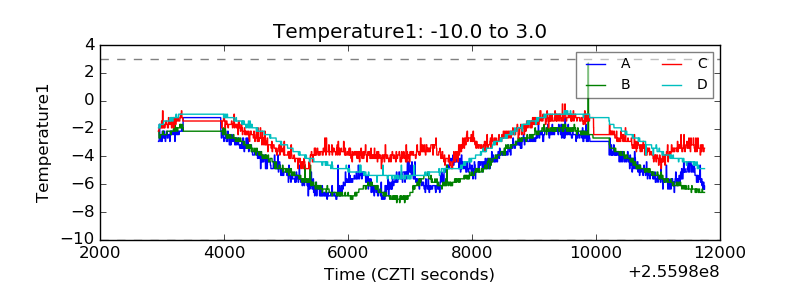 |
| Veto HV Monitor | 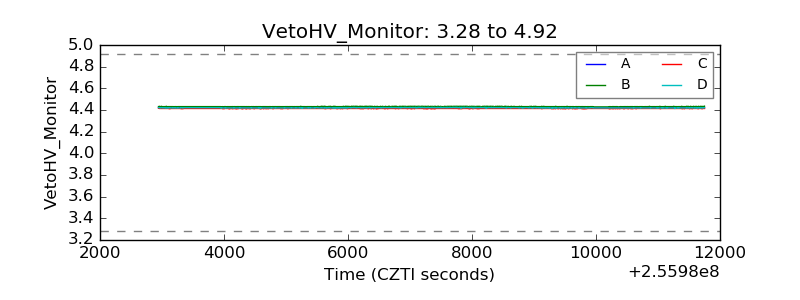 |
| Veto LLD | 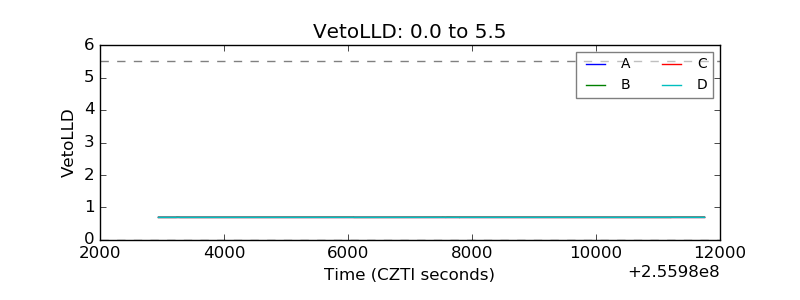 |
| Alpha Counter | 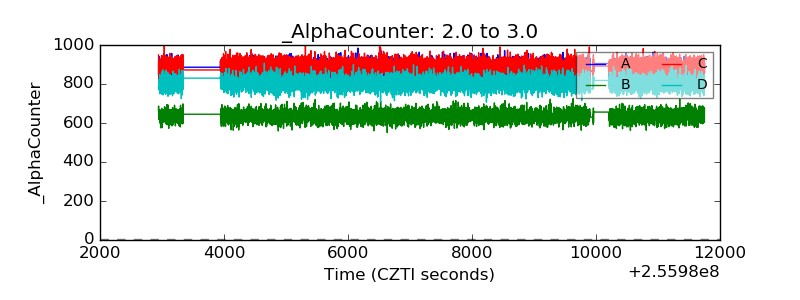 |
| _CPM_Rate | 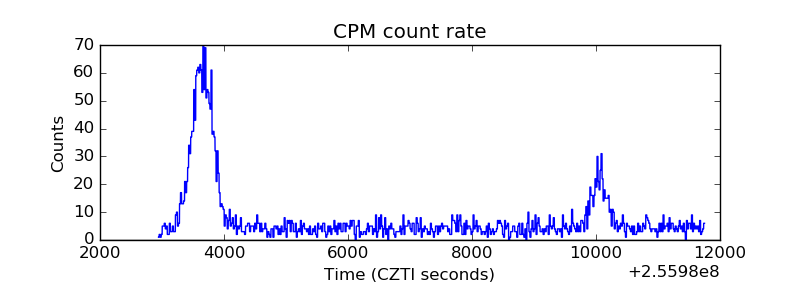 |
| CZT Counter | 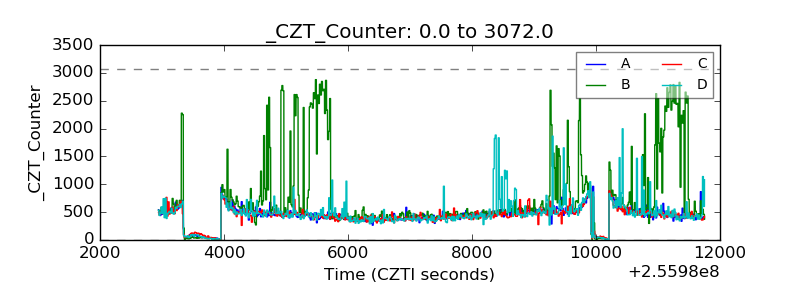 |
| +2.5 Volts monitor |  |
| +5 Volts monitor |  |
| _ROLL_ROT | 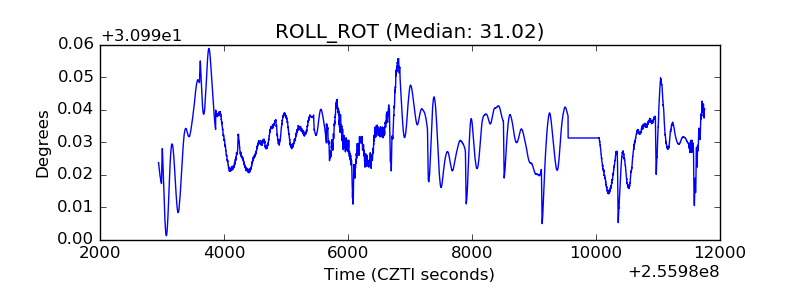 |
| _Roll_DEC | 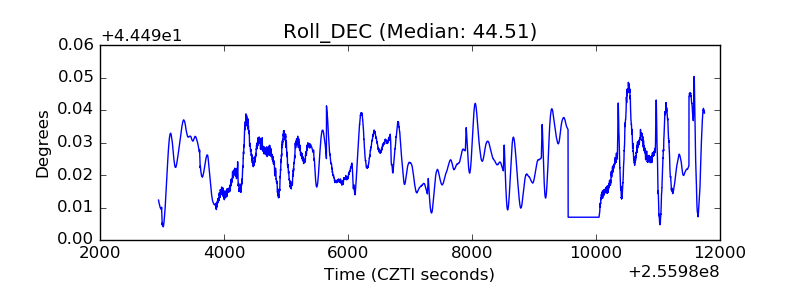 |
| _Roll_RA | 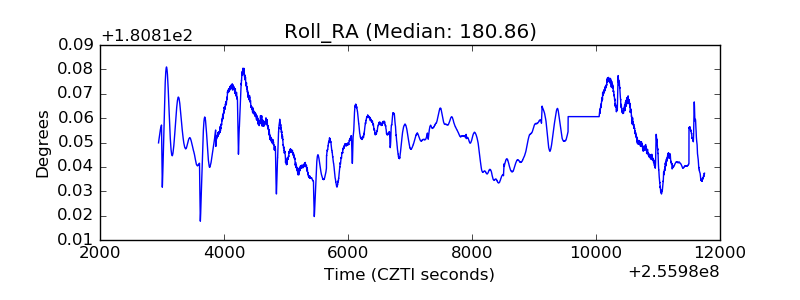 |
| Veto Counter | 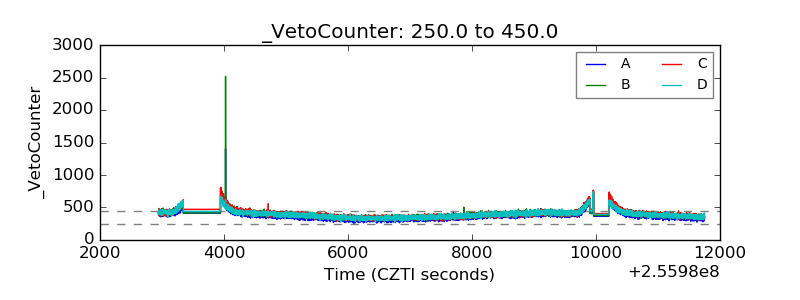 |