| Param | Original file | Final file |
|---|---|---|
| Filename | modeM0/AS1G08_071T01_9000001888_12829cztM0_level2.evt | modeM0/AS1G08_071T01_9000001888_12829cztM0_level2_quad_clean.evt |
| Size (bytes) | 556,580,160 | 101,355,840 |
| Size | 530.8 MB | 96.7 MB |
| Events in quadrant A | 3,450,095 | 659,343 |
| Events in quadrant B | 5,693,399 | 589,459 |
| Events in quadrant C | 3,365,524 | 665,703 |
| Events in quadrant D | 3,842,417 | 637,415 |
| Mode SS | |||
|---|---|---|---|
| Quadrant | BADHDUFLAG | Total packets | Discarded packets |
| A | 0 | 150 | 0 |
| B | 0 | 150 | 0 |
| C | 0 | 150 | 0 |
| D | 0 | 150 | 0 |
| Mode M9 | |||
|---|---|---|---|
| Quadrant | BADHDUFLAG | Total packets | Discarded packets |
| A | 0 | 4 | 0 |
| B | 0 | 4 | 0 |
| C | 0 | 4 | 0 |
| D | 0 | 5 | 0 |
| Mode M0 | |||
|---|---|---|---|
| Quadrant | BADHDUFLAG | Total packets | Discarded packets |
| A | 0 | 15397 | 3 |
| B | 0 | 22065 | 2 |
| C | 0 | 15308 | 2 |
| D | 0 | 16734 | 2 |
| Quadrant | Total seconds | Saturated seconds | Saturation percentage |
|---|---|---|---|
| A | 7435 | 37 | 0.497646% |
| B | 7435 | 1012 | 13.611298% |
| C | 7435 | 19 | 0.255548% |
| D | 7435 | 74 | 0.995293% |
Noise dominated data is calculated using 1-second bins in cleaned event files. If a bin has >2000 counts, and if more than 50% of those come from <1% of pixels, then it is considered to be noise-dominated and hence unusable.
| Quadrant | # 1 sec bins | Bins with >0 counts | Bins with >2000 counts | High rate bins dominated by noise | Noise dominated (total time) | Noise dominated (detector-on time) | Marked lightcurve |
|---|---|---|---|---|---|---|---|
| A | 7731 | 7437 | 0 | 0 | 0.00% | 0.00% | 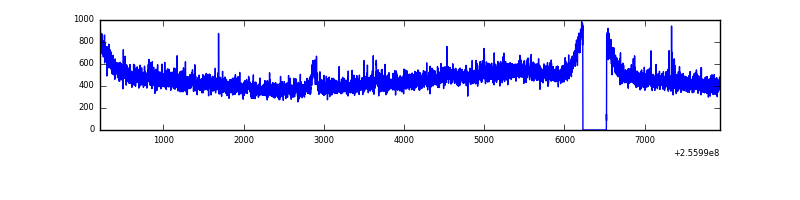 |
| B | 7731 | 7437 | 663 | 663 | 8.58% | 8.91% | 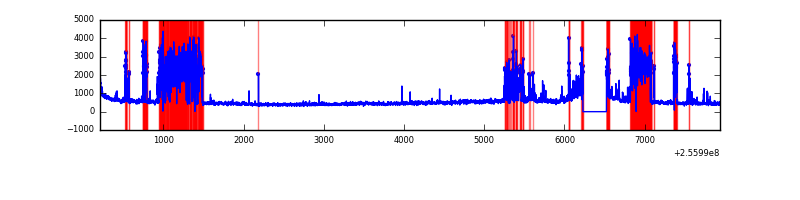 |
| C | 7731 | 7437 | 0 | 0 | 0.00% | 0.00% |  |
| D | 7731 | 7437 | 46 | 46 | 0.60% | 0.62% | 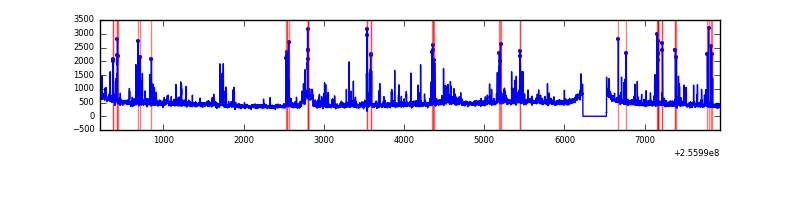 |
Top three noisy pixels from each quadrant. If the there are fewer than three noisy pixels in the level2.evt file, extra rows are filled as -1
| Pixel properties | Quadrant properties | ||||||
|---|---|---|---|---|---|---|---|
| Quadrant | DetID | PixID | Counts | Sigma | Mean | Median | Sigma |
| A | 12 | 189 | 57743 | 316.66 | 880 | 859 | 179.6 |
| A | 15 | 222 | 10595 | 54.2 | 880 | 859 | 179.6 |
| A | 0 | 226 | 7631 | 37.7 | 880 | 859 | 179.6 |
| B | 4 | 239 | 2231144 | 14460.32 | 806 | 786 | 154.2 |
| B | 0 | 219 | 172688 | 1114.51 | 806 | 786 | 154.2 |
| B | 0 | 85 | 44457 | 283.14 | 806 | 786 | 154.2 |
| C | 13 | 61 | 6285 | 27.04 | 862 | 865 | 200.4 |
| C | 3 | 233 | 3918 | 15.23 | 862 | 865 | 200.4 |
| C | 8 | 222 | 3155 | 11.43 | 862 | 865 | 200.4 |
| D | 1 | 52 | 359442 | 1587.61 | 844 | 828 | 225.9 |
| D | 13 | 172 | 111931 | 491.86 | 844 | 828 | 225.9 |
| D | 2 | 136 | 87682 | 384.51 | 844 | 828 | 225.9 |
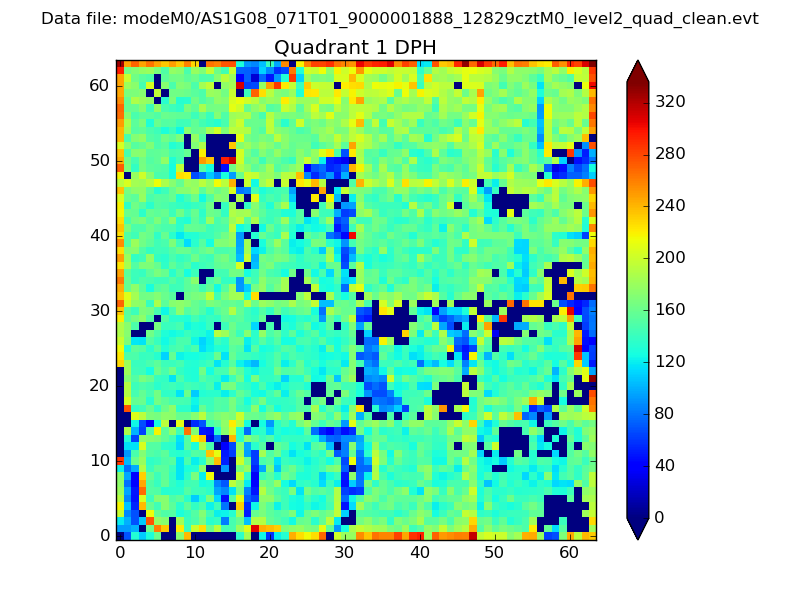
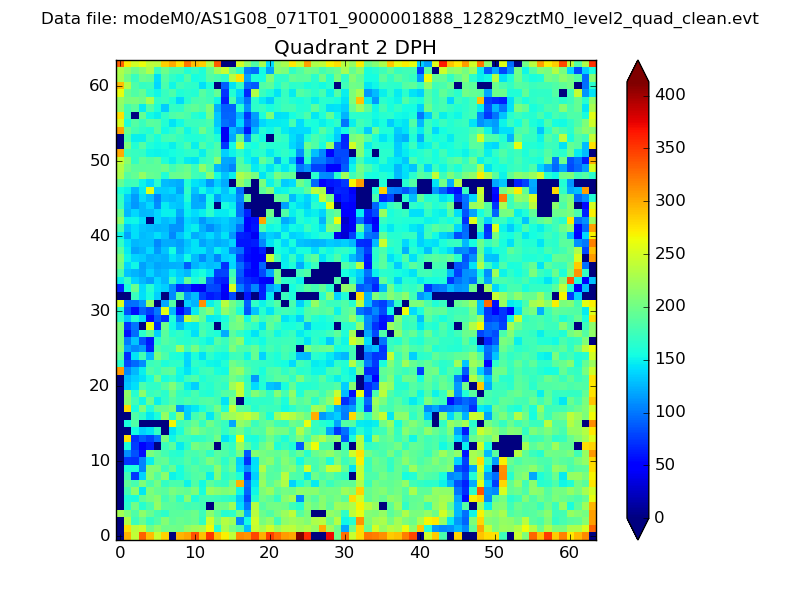
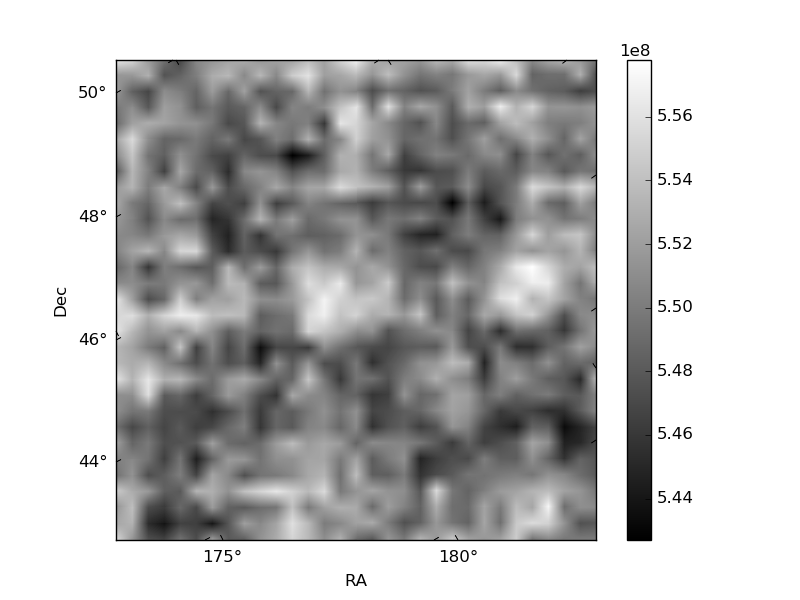
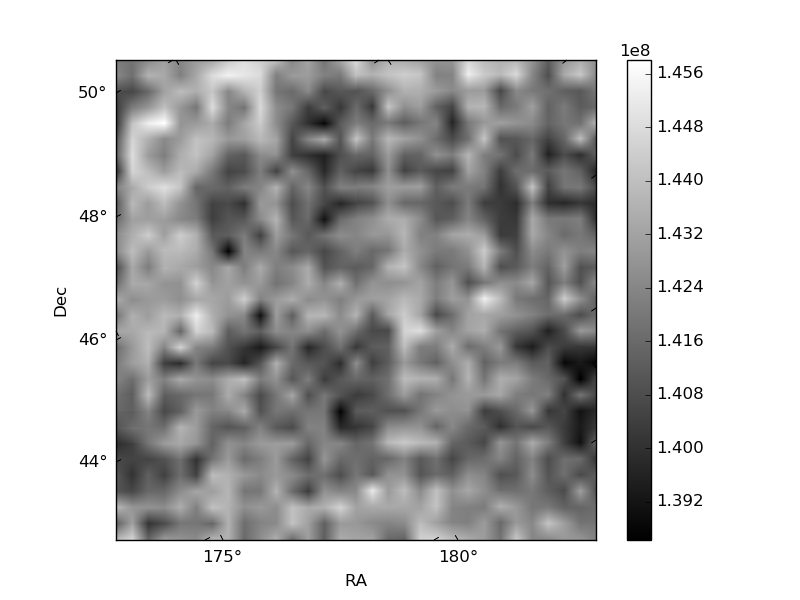
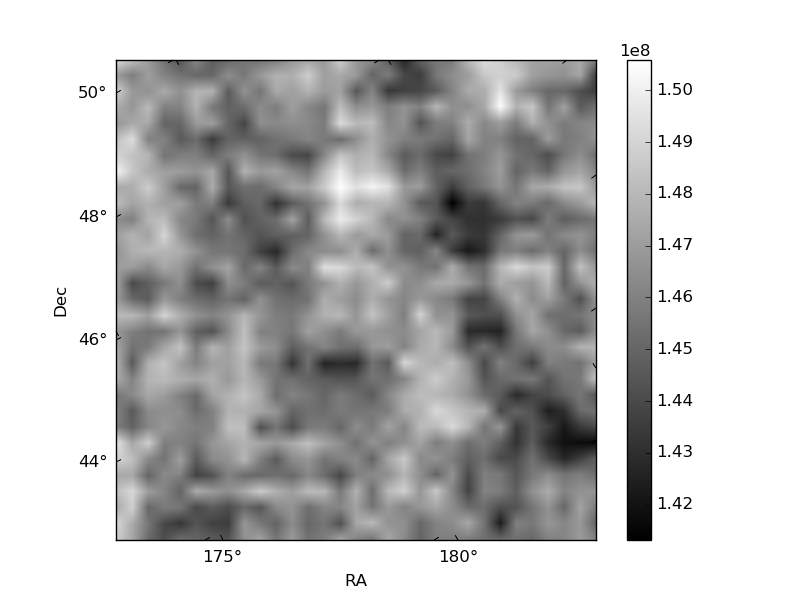
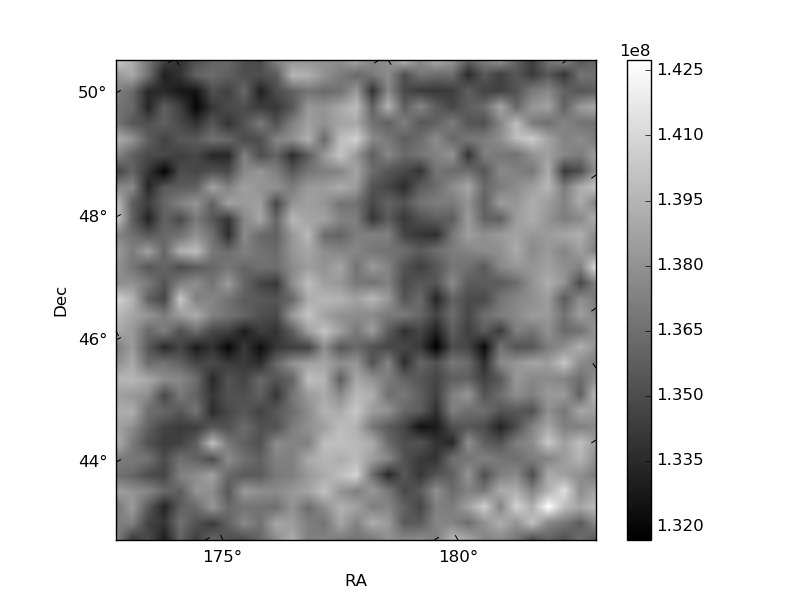
Histogram calculated using DETX and DETY for each event in the final _common_clean file
| Quadrant A | 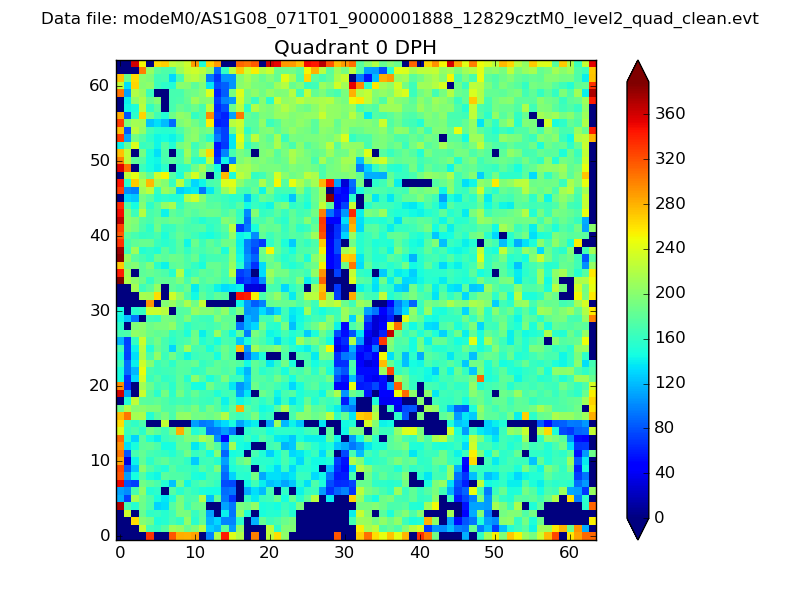 |
 |
Quadrant B |
|---|---|---|---|
| Quadrant D | 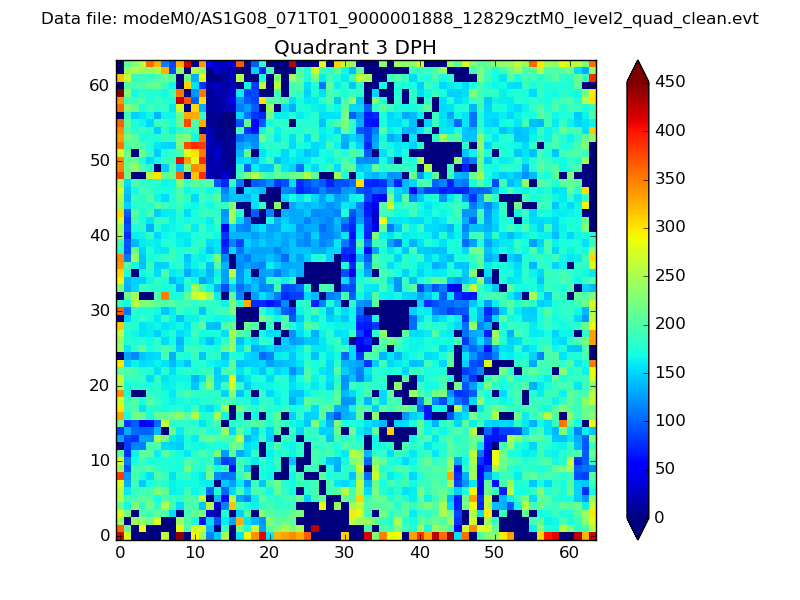 |
 |
Quadrant C |
| Plot type | Count rate plots | Images |
|---|---|---|
| Comparison with Poisson distribution Blue bars denote a histogram of data divided into 1 sec bins. Red curve is a Poisson curve with rate = median count rate of data. |
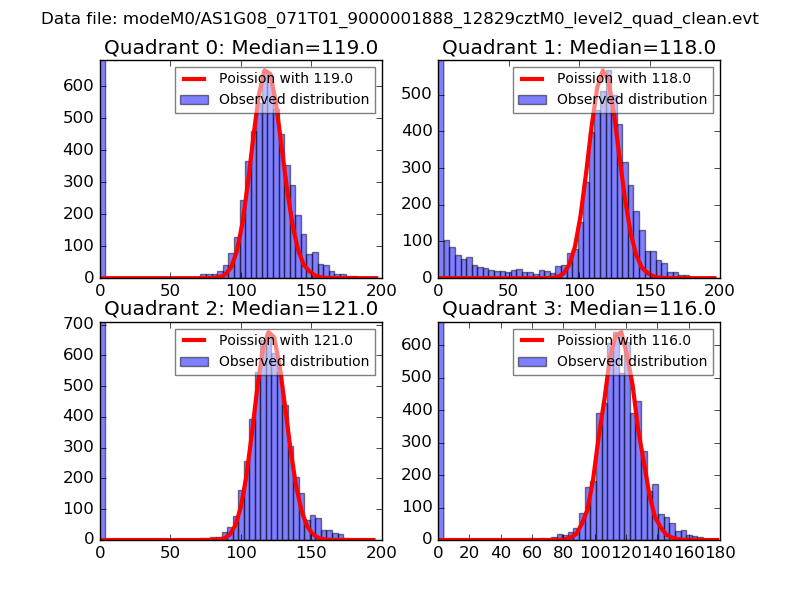 |
 |
| Quadrant-wise count rates Data is divided into 100 sec bins |
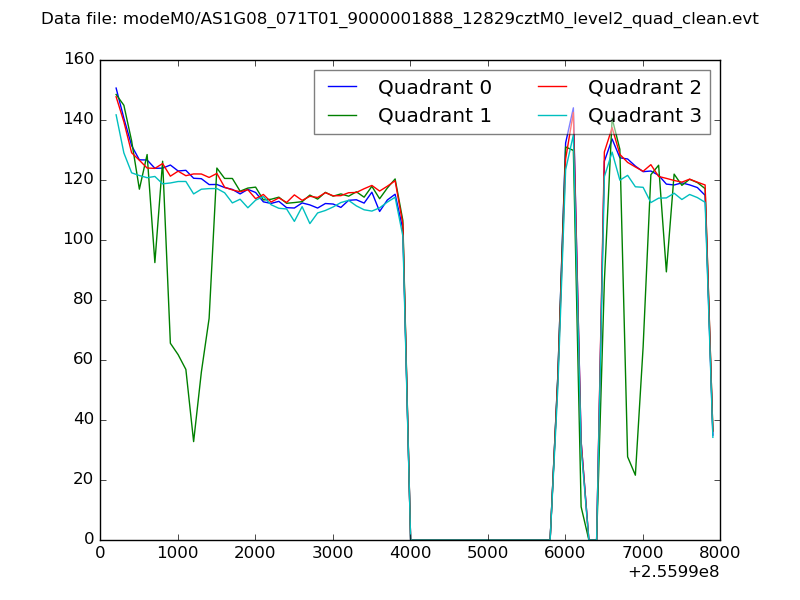 |
|
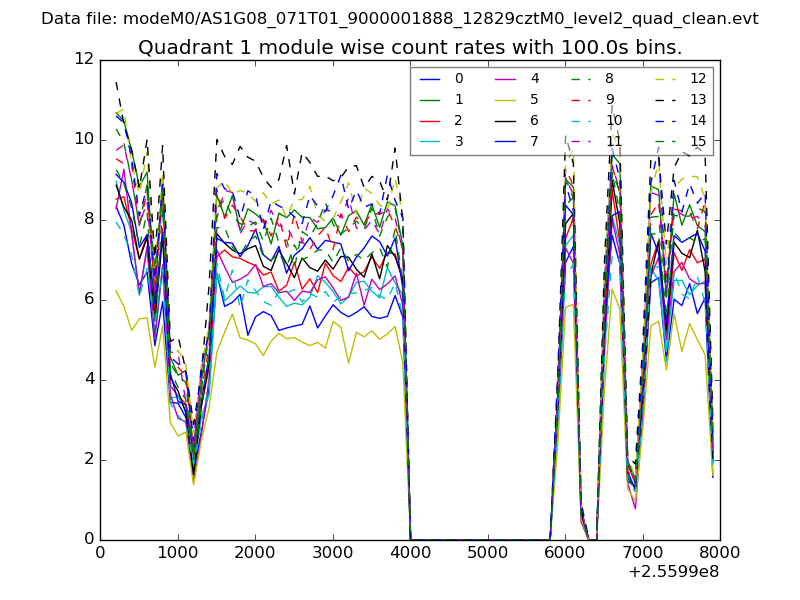
| Module-wise count rates for Quadrant A Data is divided into 100 sec bins |
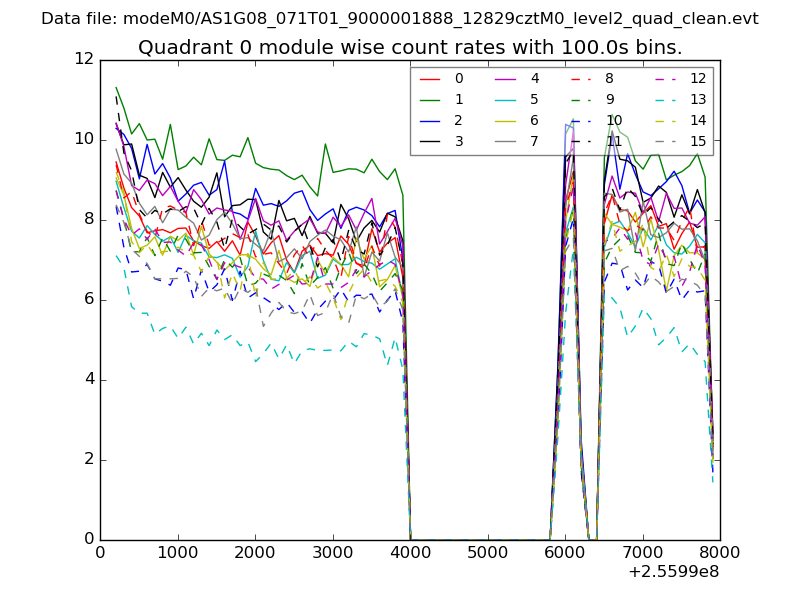 |
 |
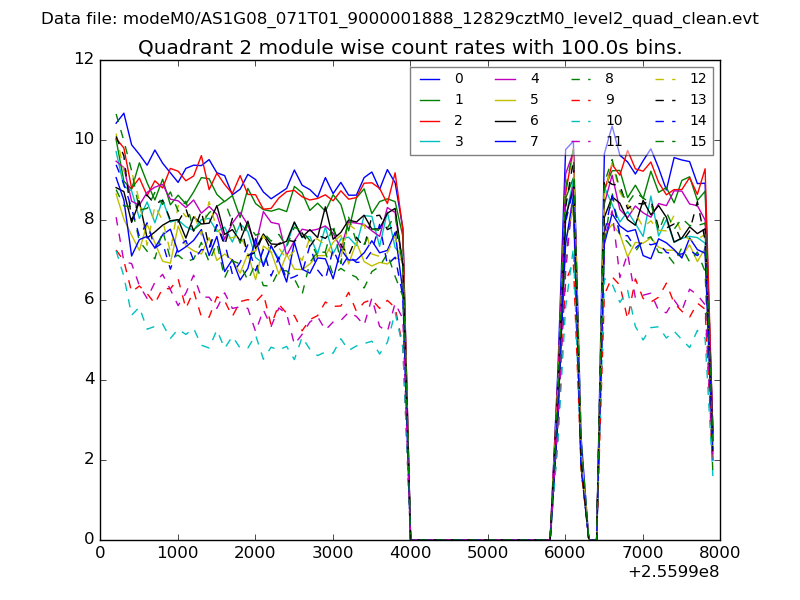
| Module-wise count rates for Quadrant B Data is divided into 100 sec bins |
 |
 |
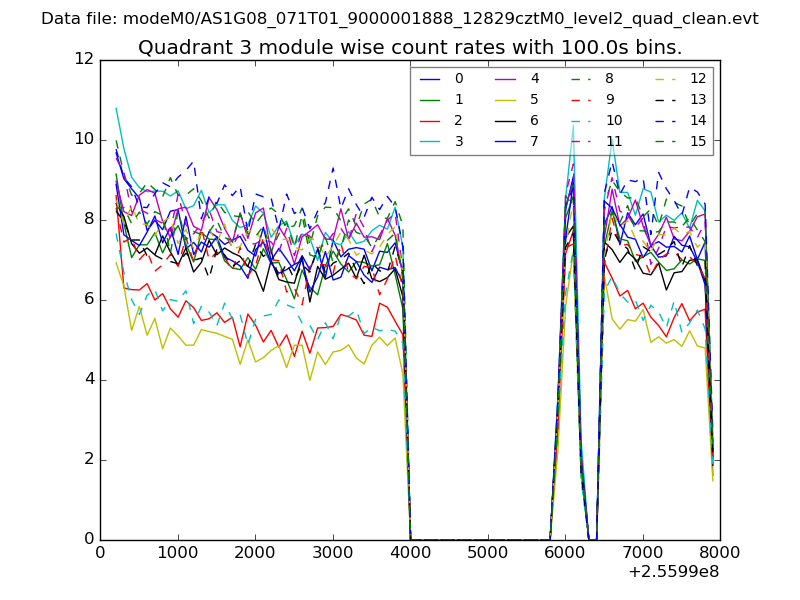
| Module-wise count rates for Quadrant C Data is divided into 100 sec bins |
 |
 |
| Module-wise count rates for Quadrant D Data is divided into 100 sec bins |
 |
 |
| Parameter | Plot |
|---|---|
| CZT HV Monitor | 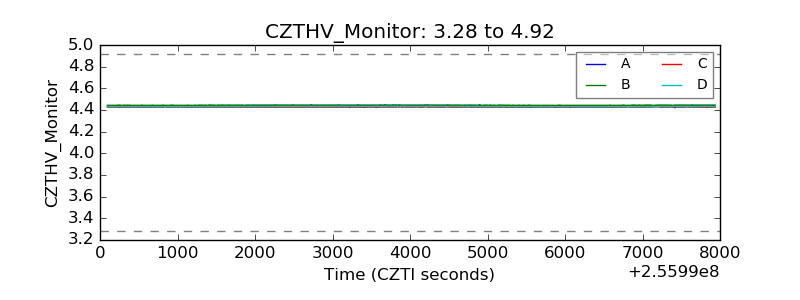 |
| D_VDD | 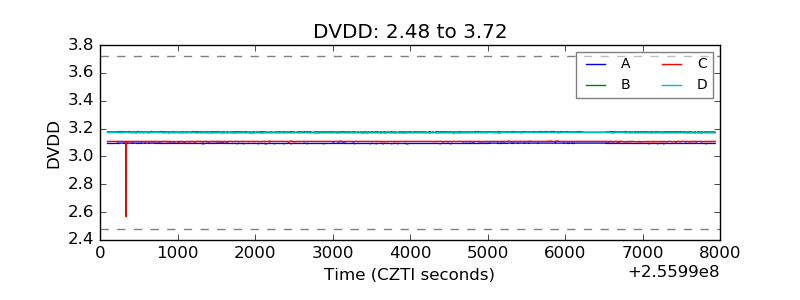 |
| Temperature 1 | 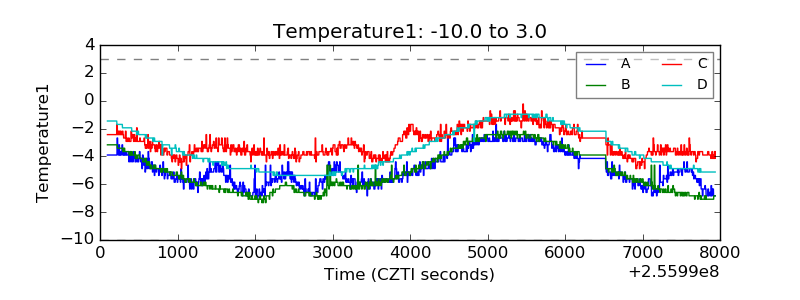 |
| Veto HV Monitor | 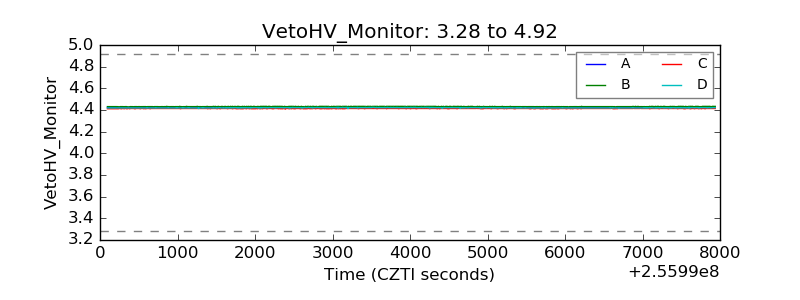 |
| Veto LLD |  |
| Alpha Counter | 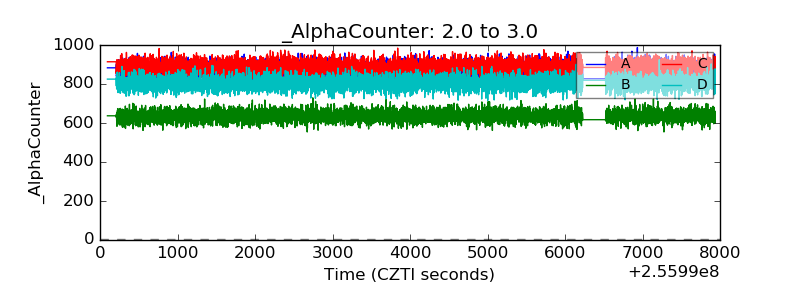 |
| _CPM_Rate | 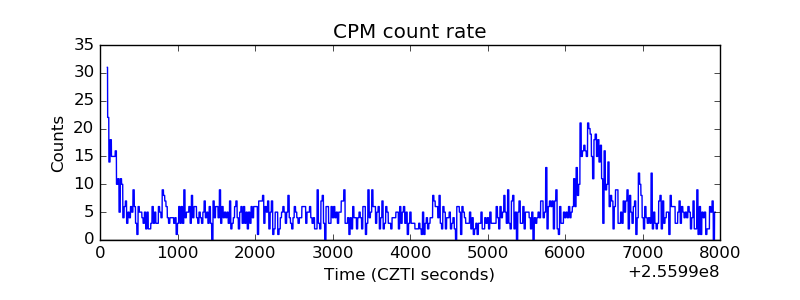 |
| CZT Counter | 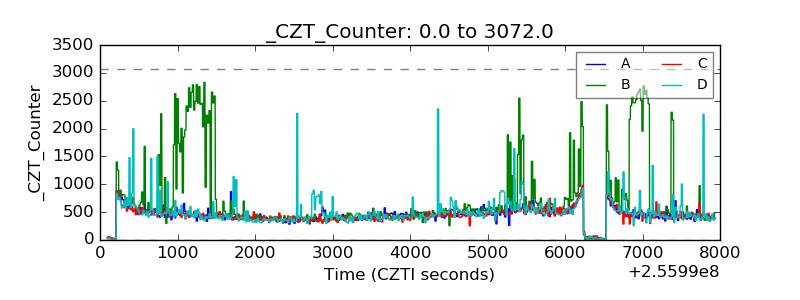 |
| +2.5 Volts monitor |  |
| +5 Volts monitor |  |
| _ROLL_ROT | 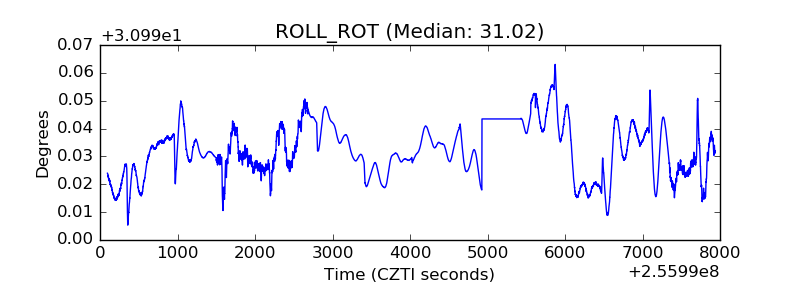 |
| _Roll_DEC | 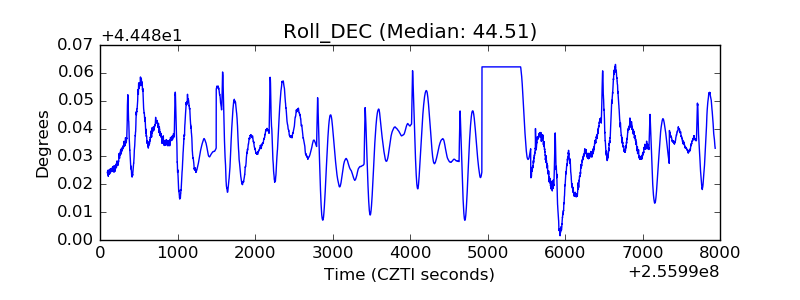 |
| _Roll_RA | 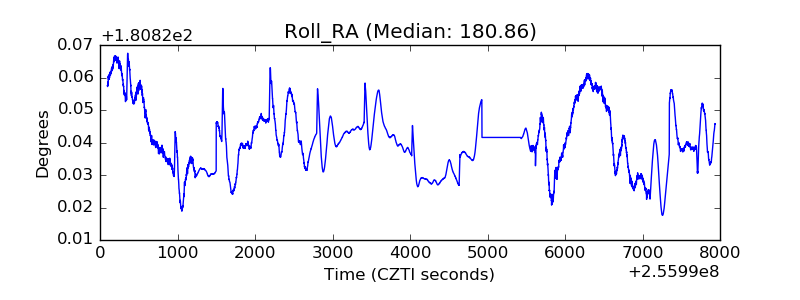 |
| Veto Counter | 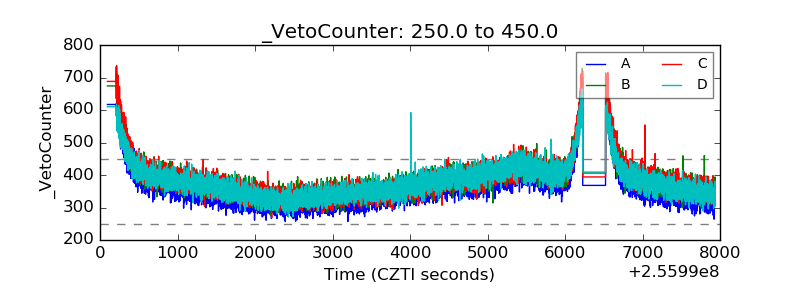 |