| Param | Original file | Final file |
|---|---|---|
| Filename | modeM0/AS1G08_071T01_9000001888_12832cztM0_level2.evt | modeM0/AS1G08_071T01_9000001888_12832cztM0_level2_quad_clean.evt |
| Size (bytes) | 952,470,720 | 173,249,280 |
| Size | 908.3 MB | 165.2 MB |
| Events in quadrant A | 6,183,347 | 1,108,768 |
| Events in quadrant B | 9,124,961 | 1,031,647 |
| Events in quadrant C | 5,821,700 | 1,122,545 |
| Events in quadrant D | 6,823,898 | 1,073,712 |
| Mode SS | |||
|---|---|---|---|
| Quadrant | BADHDUFLAG | Total packets | Discarded packets |
| A | 0 | 272 | 0 |
| B | 0 | 272 | 0 |
| C | 0 | 272 | 0 |
| D | 0 | 272 | 0 |
| Mode M9 | |||
|---|---|---|---|
| Quadrant | BADHDUFLAG | Total packets | Discarded packets |
| A | 0 | 17 | 0 |
| B | 0 | 17 | 0 |
| C | 0 | 17 | 0 |
| D | 0 | 17 | 0 |
| Mode M0 | |||
|---|---|---|---|
| Quadrant | BADHDUFLAG | Total packets | Discarded packets |
| A | 0 | 27333 | 4 |
| B | 0 | 36110 | 3 |
| C | 0 | 26815 | 3 |
| D | 0 | 29559 | 3 |
| Quadrant | Total seconds | Saturated seconds | Saturation percentage |
|---|---|---|---|
| A | 13165 | 76 | 0.577288% |
| B | 13165 | 1366 | 10.375997% |
| C | 13165 | 38 | 0.288644% |
| D | 13165 | 123 | 0.934295% |
Noise dominated data is calculated using 1-second bins in cleaned event files. If a bin has >2000 counts, and if more than 50% of those come from <1% of pixels, then it is considered to be noise-dominated and hence unusable.
| Quadrant | # 1 sec bins | Bins with >0 counts | Bins with >2000 counts | High rate bins dominated by noise | Noise dominated (total time) | Noise dominated (detector-on time) | Marked lightcurve |
|---|---|---|---|---|---|---|---|
| A | 15000 | 13167 | 1 | 1 | 0.01% | 0.01% | 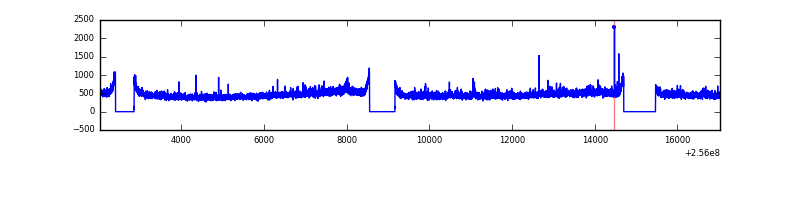 |
| B | 15000 | 13167 | 860 | 860 | 5.73% | 6.53% | 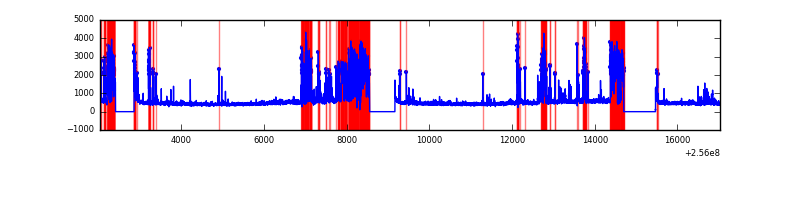 |
| C | 15000 | 13167 | 0 | 0 | 0.00% | 0.00% | 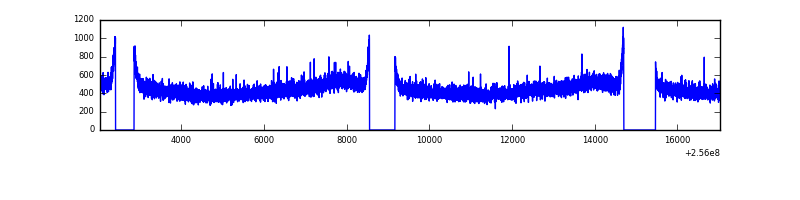 |
| D | 15000 | 13167 | 63 | 63 | 0.42% | 0.48% | 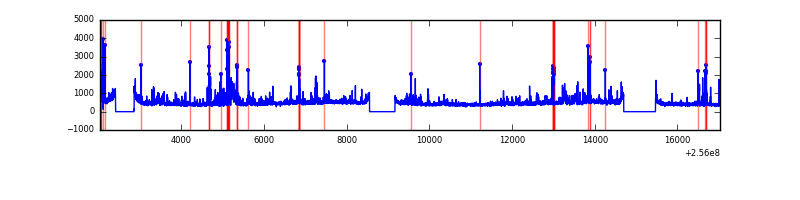 |
Top three noisy pixels from each quadrant. If the there are fewer than three noisy pixels in the level2.evt file, extra rows are filled as -1
| Pixel properties | Quadrant properties | ||||||
|---|---|---|---|---|---|---|---|
| Quadrant | DetID | PixID | Counts | Sigma | Mean | Median | Sigma |
| A | 12 | 189 | 186508 | 598.02 | 1528 | 1494 | 309.4 |
| A | 15 | 222 | 114125 | 364.05 | 1528 | 1494 | 309.4 |
| A | 0 | 226 | 13442 | 38.62 | 1528 | 1494 | 309.4 |
| B | 4 | 239 | 2856912 | 10610.39 | 1424 | 1388 | 269.1 |
| B | 0 | 85 | 344700 | 1275.66 | 1424 | 1388 | 269.1 |
| B | 0 | 219 | 140274 | 516.06 | 1424 | 1388 | 269.1 |
| C | 13 | 61 | 10947 | 27.34 | 1492 | 1500 | 345.5 |
| C | 12 | 237 | 5285 | 10.95 | 1492 | 1500 | 345.5 |
| C | 8 | 222 | 4431 | 8.48 | 1492 | 1500 | 345.5 |
| D | 1 | 52 | 792448 | 2122.01 | 1466 | 1430 | 372.8 |
| D | 13 | 104 | 109247 | 289.23 | 1466 | 1430 | 372.8 |
| D | 13 | 172 | 105060 | 278.0 | 1466 | 1430 | 372.8 |
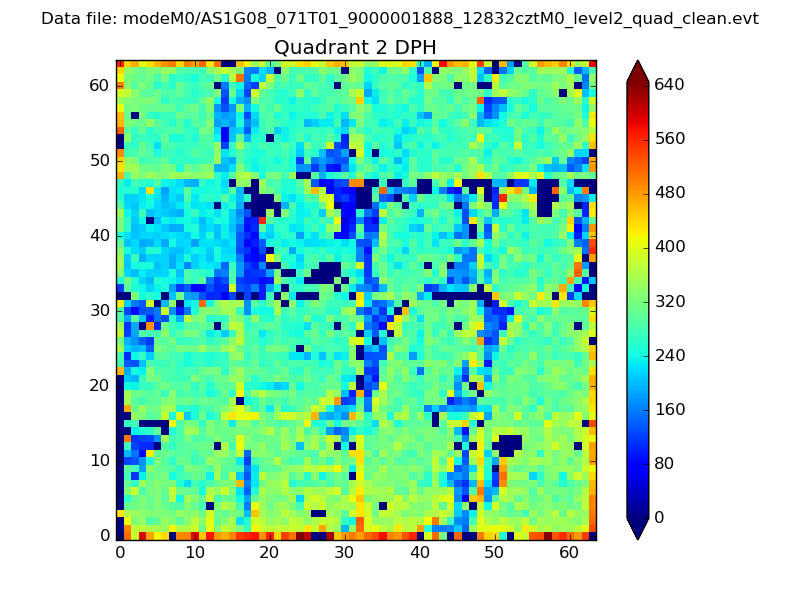
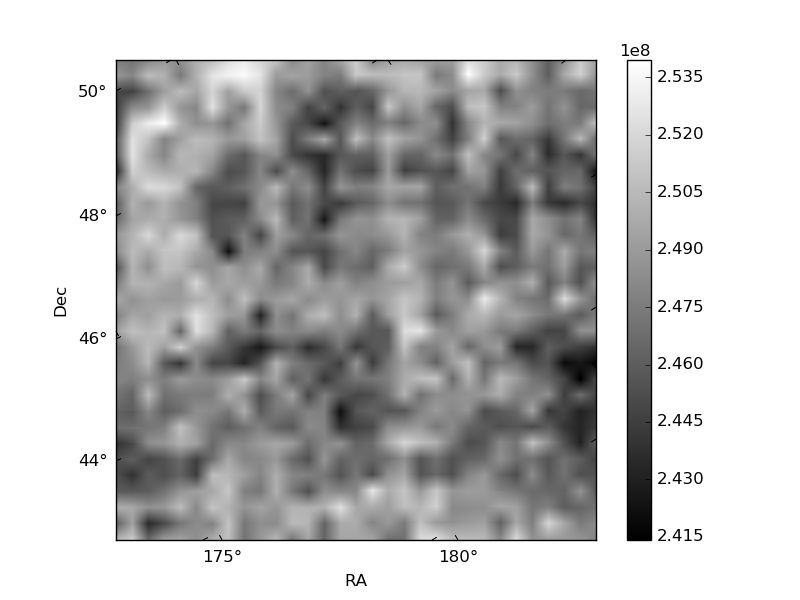
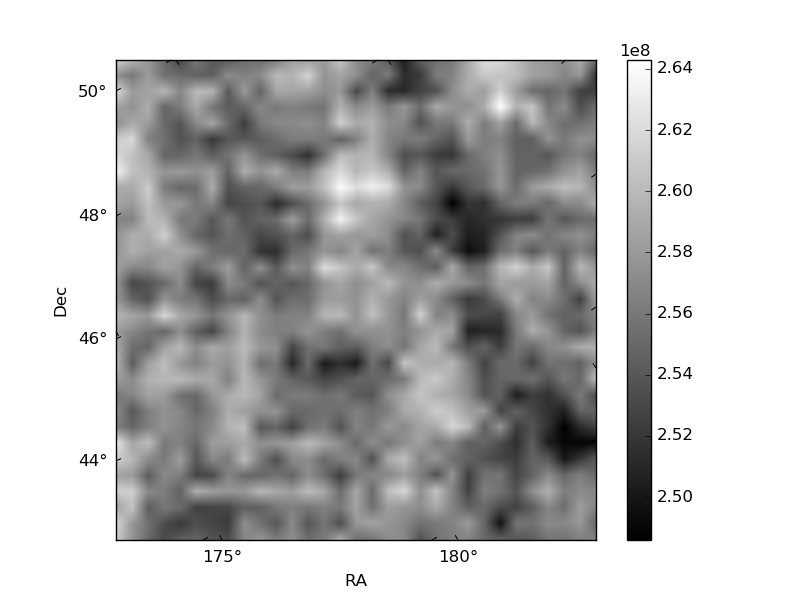
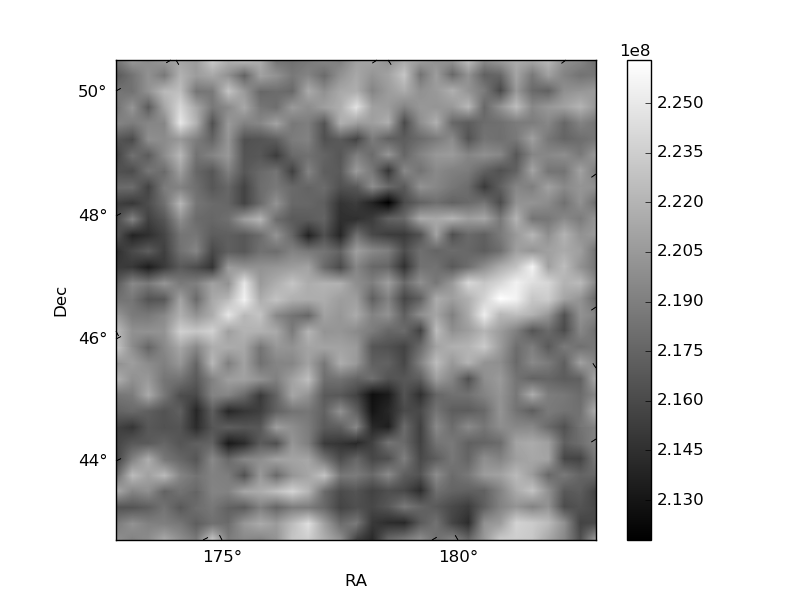
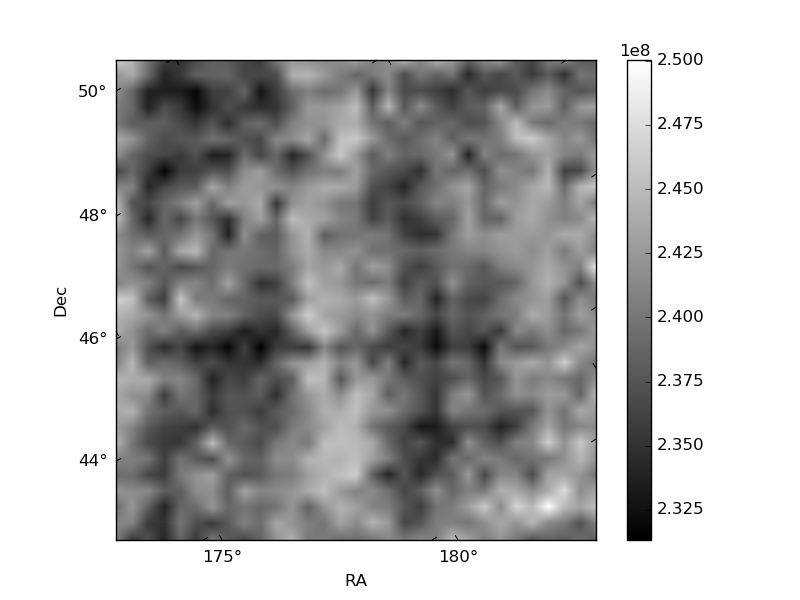
Histogram calculated using DETX and DETY for each event in the final _common_clean file
| Quadrant A | 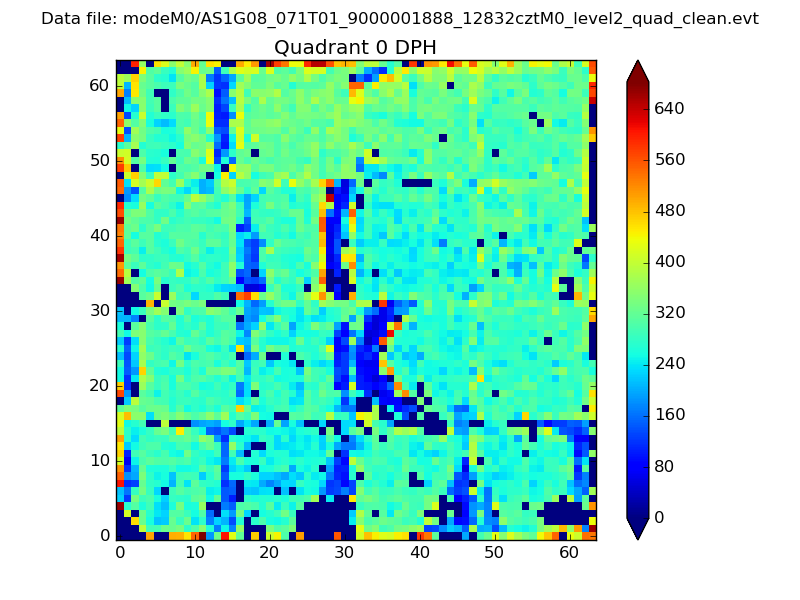 |
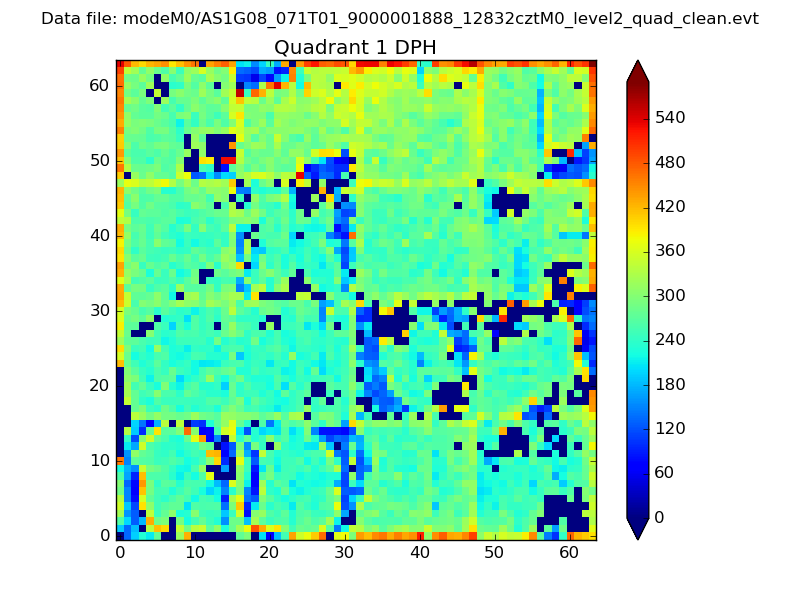 |
Quadrant B |
|---|---|---|---|
| Quadrant D | 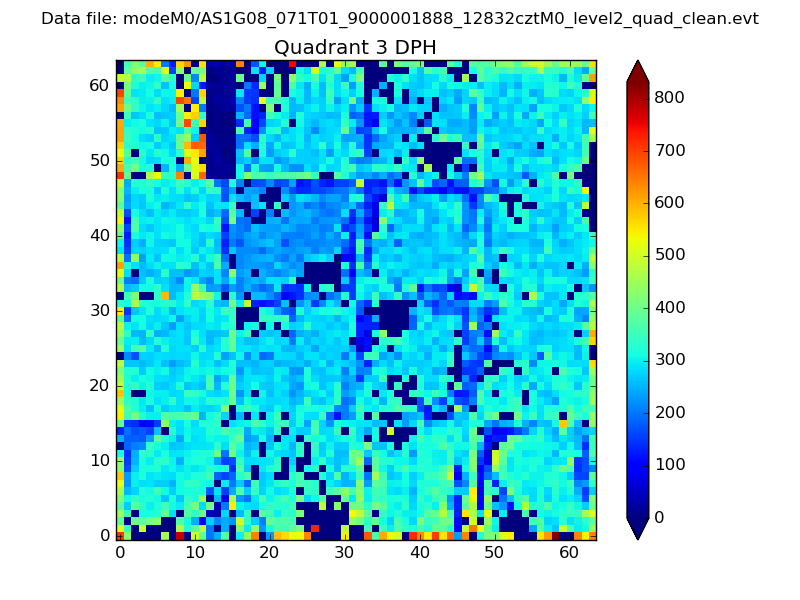 |
 |
Quadrant C |
| Plot type | Count rate plots | Images |
|---|---|---|
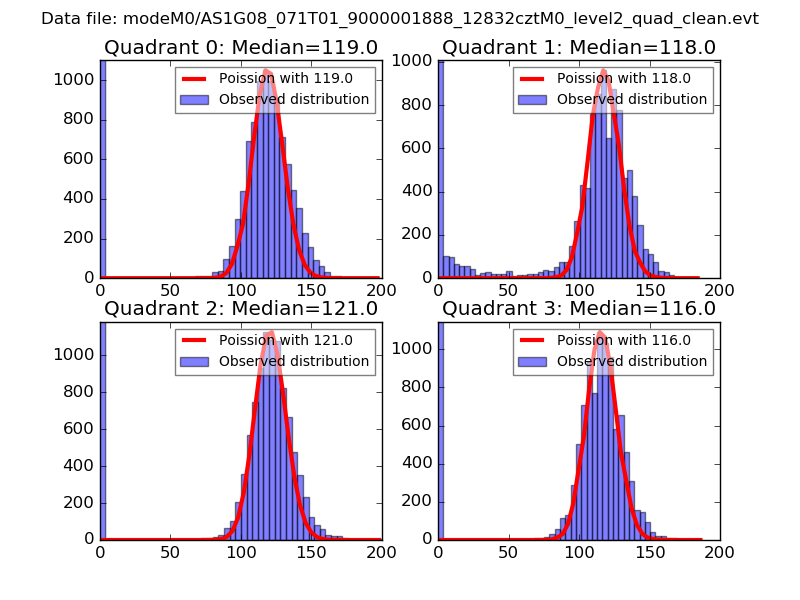
| Comparison with Poisson distribution Blue bars denote a histogram of data divided into 1 sec bins. Red curve is a Poisson curve with rate = median count rate of data. |
 |
 |
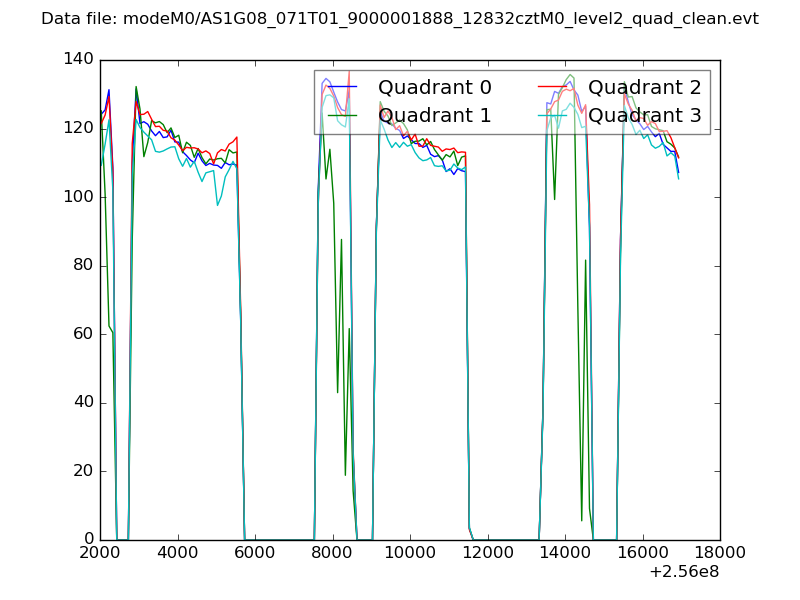
| Quadrant-wise count rates Data is divided into 100 sec bins |
 |
|
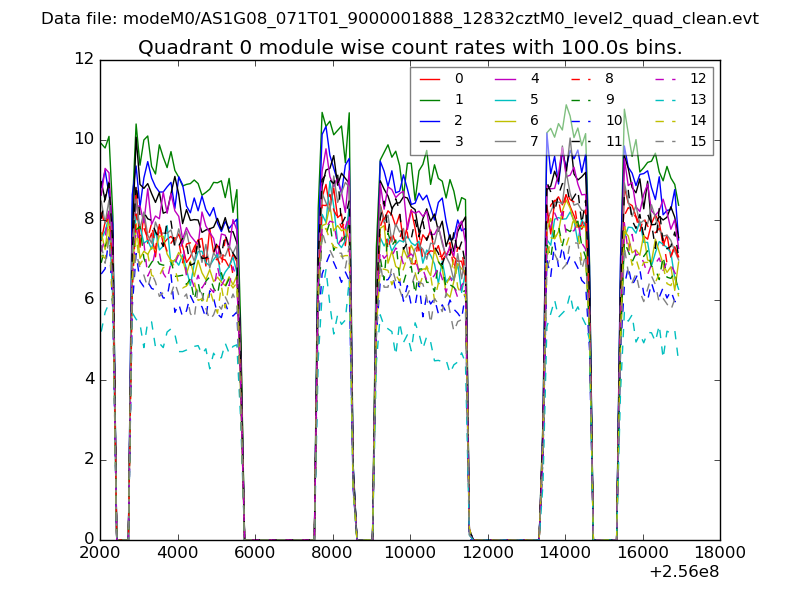
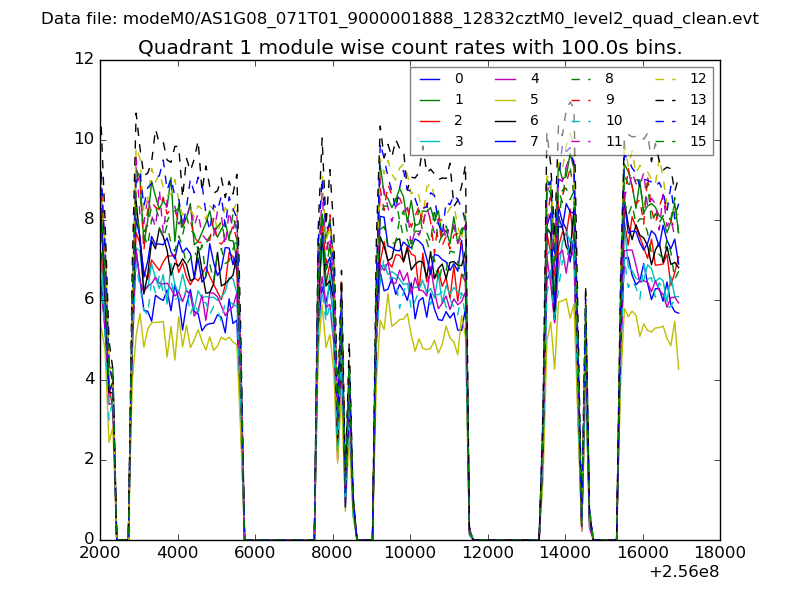
| Module-wise count rates for Quadrant A Data is divided into 100 sec bins |
 |
 |
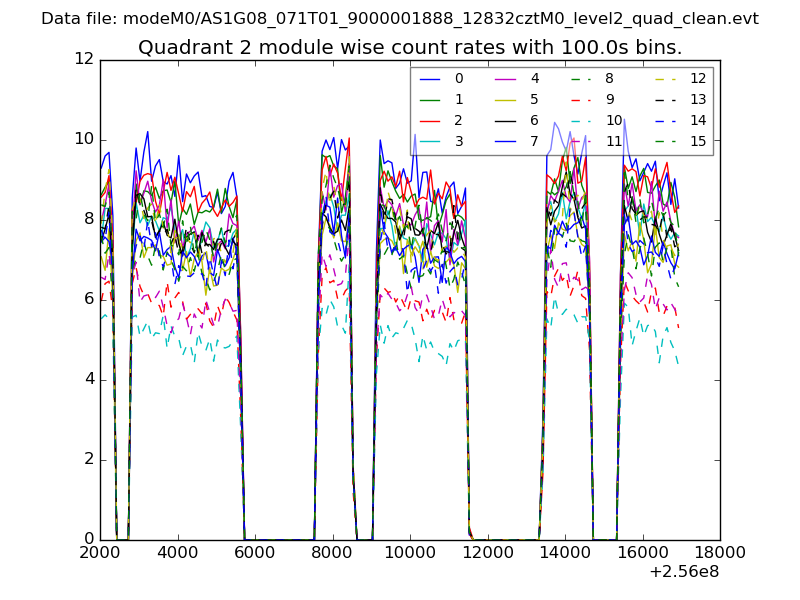
| Module-wise count rates for Quadrant B Data is divided into 100 sec bins |
 |
 |
| Module-wise count rates for Quadrant C Data is divided into 100 sec bins |
 |
 |
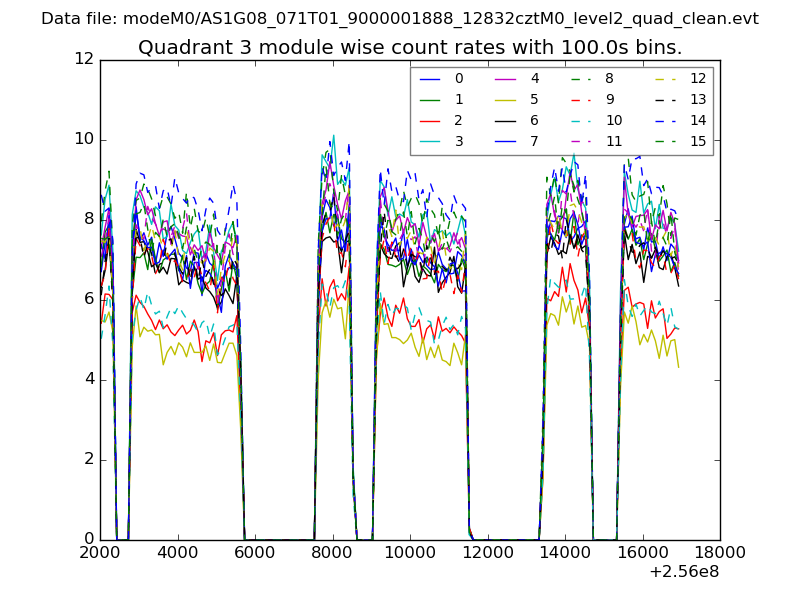
| Module-wise count rates for Quadrant D Data is divided into 100 sec bins |
 |
 |
| Parameter | Plot |
|---|---|
| CZT HV Monitor | 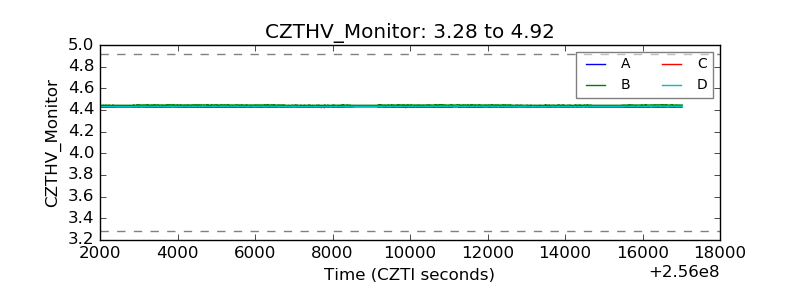 |
| D_VDD | 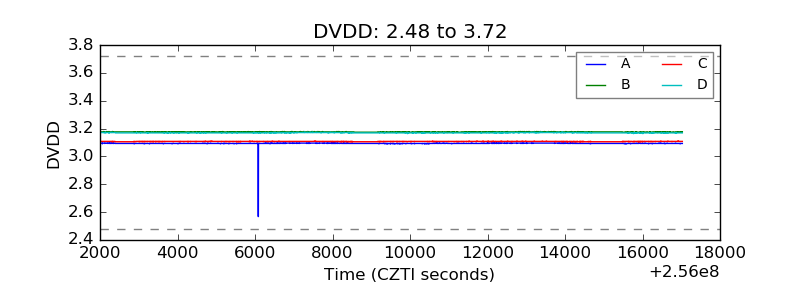 |
| Temperature 1 | 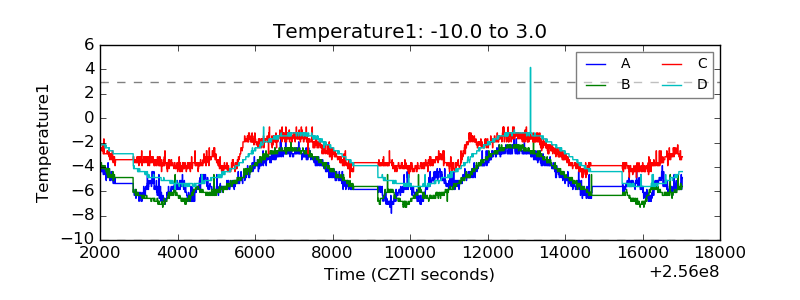 |
| Veto HV Monitor | 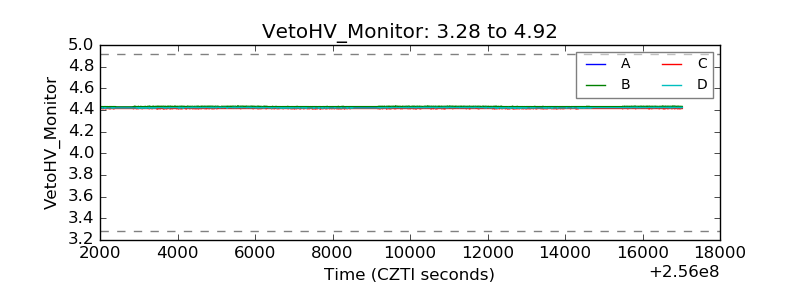 |
| Veto LLD | 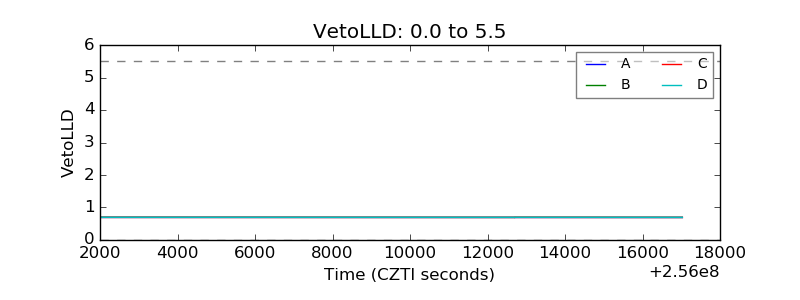 |
| Alpha Counter | 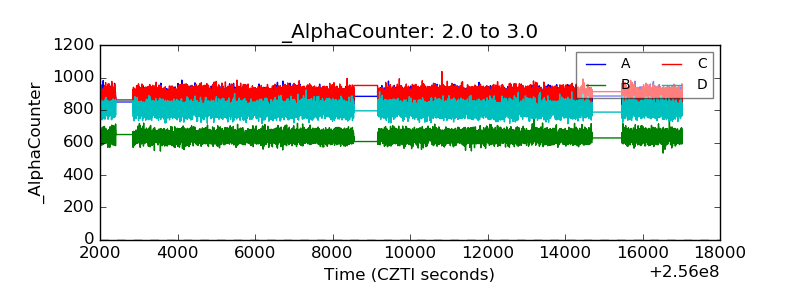 |
| _CPM_Rate | 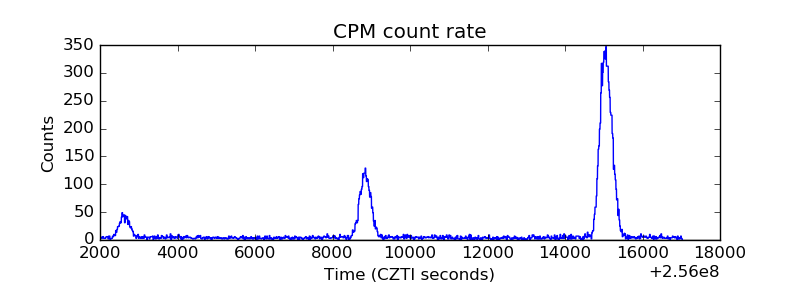 |
| CZT Counter | 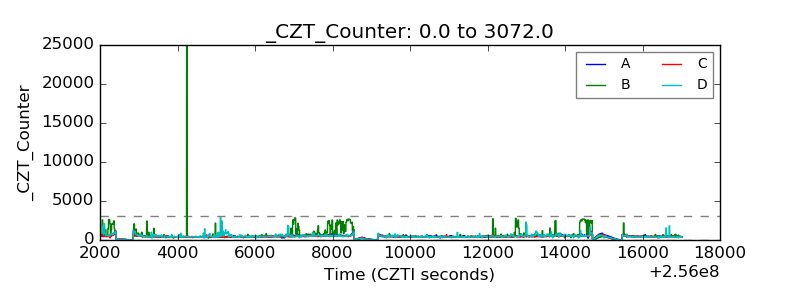 |
| +2.5 Volts monitor | 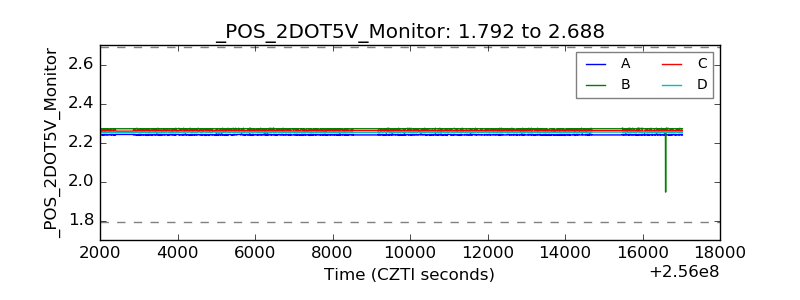 |
| +5 Volts monitor |  |
| _ROLL_ROT | 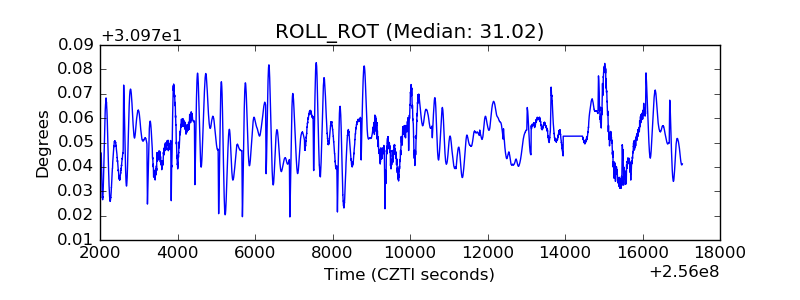 |
| _Roll_DEC | 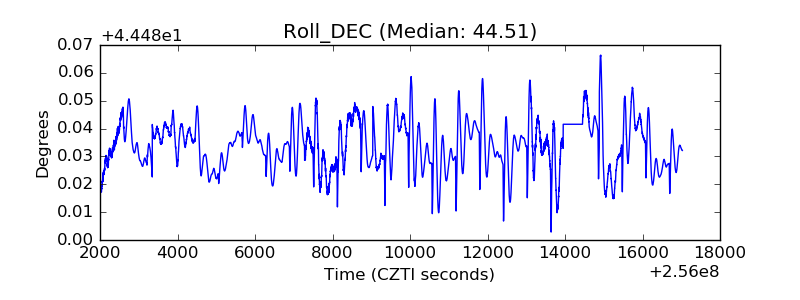 |
| _Roll_RA | 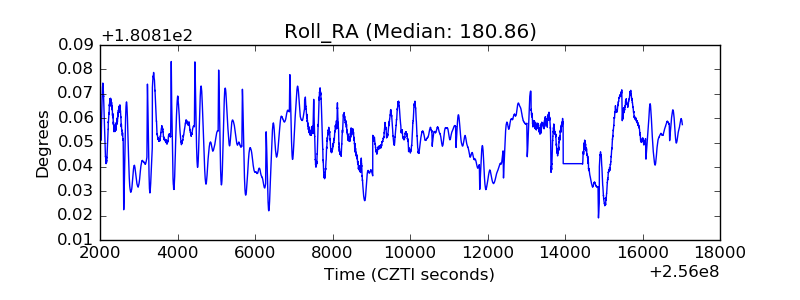 |
| Veto Counter | 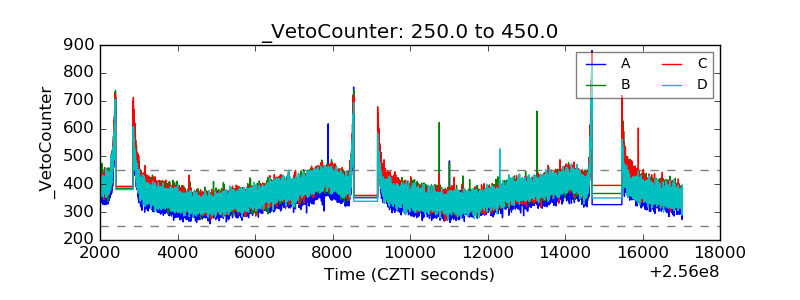 |