| Param | Original file | Final file |
|---|---|---|
| Filename | modeM0/AS1G08_071T01_9000001888_12833cztM0_level2.evt | modeM0/AS1G08_071T01_9000001888_12833cztM0_level2_quad_clean.evt |
| Size (bytes) | 489,614,400 | 97,482,240 |
| Size | 466.9 MB | 93.0 MB |
| Events in quadrant A | 3,373,098 | 626,825 |
| Events in quadrant B | 4,556,071 | 596,807 |
| Events in quadrant C | 3,129,355 | 633,756 |
| Events in quadrant D | 3,293,203 | 606,434 |
| Mode SS | |||
|---|---|---|---|
| Quadrant | BADHDUFLAG | Total packets | Discarded packets |
| A | 0 | 146 | 0 |
| B | 0 | 146 | 0 |
| C | 0 | 146 | 0 |
| D | 0 | 146 | 0 |
| Mode M9 | |||
|---|---|---|---|
| Quadrant | BADHDUFLAG | Total packets | Discarded packets |
| A | 0 | 16 | 0 |
| B | 0 | 16 | 0 |
| C | 0 | 16 | 0 |
| D | 0 | 16 | 0 |
| Mode M0 | |||
|---|---|---|---|
| Quadrant | BADHDUFLAG | Total packets | Discarded packets |
| A | 0 | 14563 | 3 |
| B | 0 | 18077 | 2 |
| C | 0 | 14245 | 2 |
| D | 0 | 14774 | 2 |
| Quadrant | Total seconds | Saturated seconds | Saturation percentage |
|---|---|---|---|
| A | 7002 | 72 | 1.028278% |
| B | 7002 | 535 | 7.640674% |
| C | 7002 | 49 | 0.699800% |
| D | 7002 | 42 | 0.599829% |
Noise dominated data is calculated using 1-second bins in cleaned event files. If a bin has >2000 counts, and if more than 50% of those come from <1% of pixels, then it is considered to be noise-dominated and hence unusable.
| Quadrant | # 1 sec bins | Bins with >0 counts | Bins with >2000 counts | High rate bins dominated by noise | Noise dominated (total time) | Noise dominated (detector-on time) | Marked lightcurve |
|---|---|---|---|---|---|---|---|
| A | 8712 | 7004 | 1 | 1 | 0.01% | 0.01% | 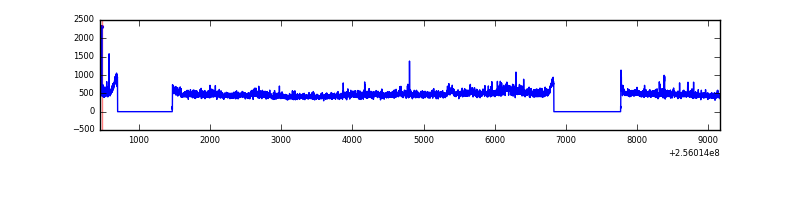 |
| B | 8712 | 7004 | 372 | 372 | 4.27% | 5.31% | 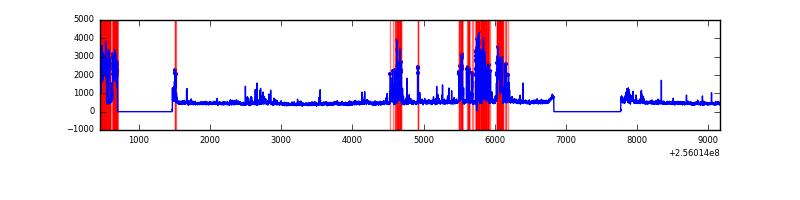 |
| C | 8712 | 7004 | 3 | 3 | 0.03% | 0.04% | 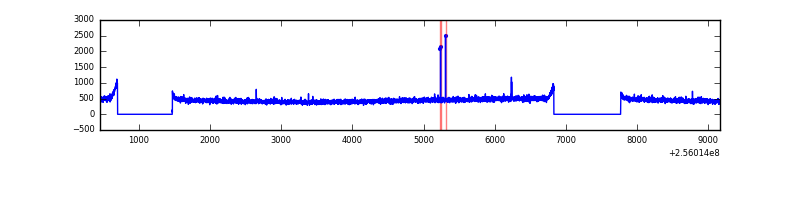 |
| D | 8712 | 7004 | 13 | 13 | 0.15% | 0.19% | 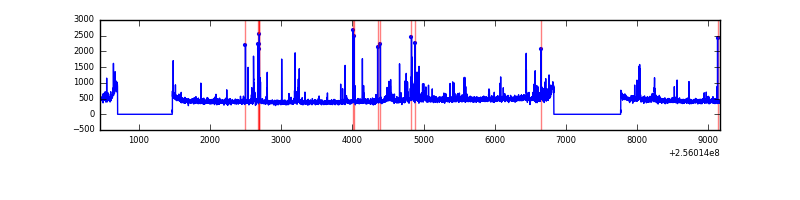 |
Top three noisy pixels from each quadrant. If the there are fewer than three noisy pixels in the level2.evt file, extra rows are filled as -1
| Pixel properties | Quadrant properties | ||||||
|---|---|---|---|---|---|---|---|
| Quadrant | DetID | PixID | Counts | Sigma | Mean | Median | Sigma |
| A | 15 | 222 | 108942 | 641.34 | 825 | 808 | 168.6 |
| A | 12 | 189 | 88501 | 520.11 | 825 | 808 | 168.6 |
| A | 0 | 226 | 7423 | 39.23 | 825 | 808 | 168.6 |
| B | 4 | 239 | 1253281 | 8298.84 | 785 | 765 | 150.9 |
| B | 0 | 85 | 61937 | 405.31 | 785 | 765 | 150.9 |
| B | 0 | 219 | 53146 | 347.06 | 785 | 765 | 150.9 |
| C | 14 | 234 | 9034 | 44.27 | 800 | 802 | 185.9 |
| C | 13 | 61 | 5798 | 26.87 | 800 | 802 | 185.9 |
| C | 12 | 4 | 2874 | 11.14 | 800 | 802 | 185.9 |
| D | 8 | 195 | 81817 | 420.92 | 796 | 772 | 192.5 |
| D | 13 | 172 | 63218 | 324.32 | 796 | 772 | 192.5 |
| D | 2 | 136 | 60226 | 308.78 | 796 | 772 | 192.5 |
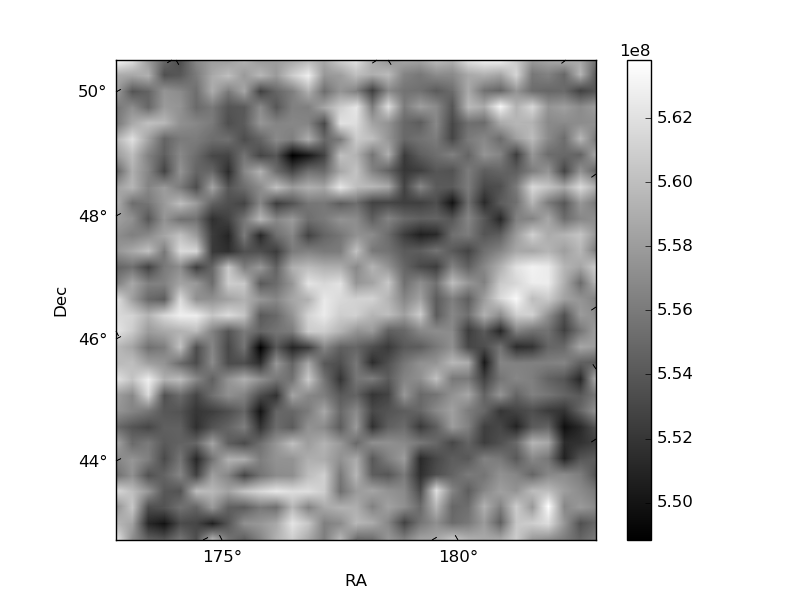
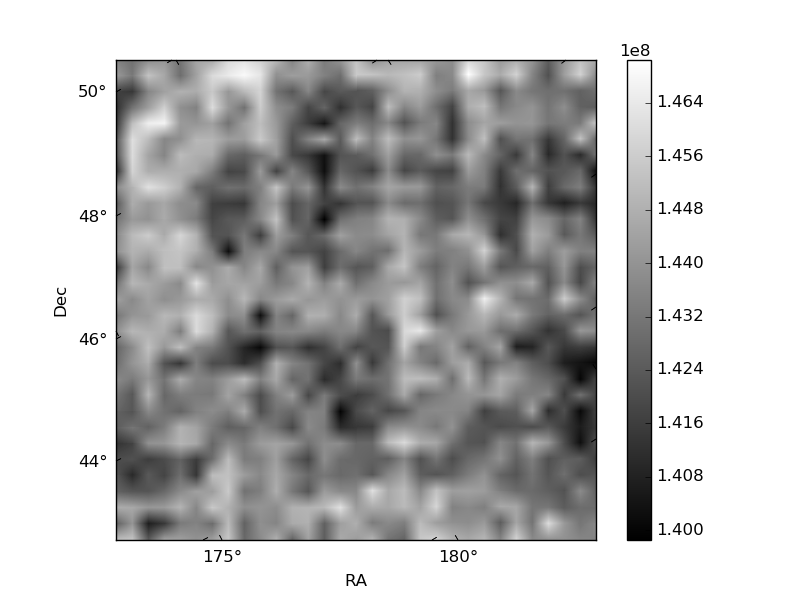
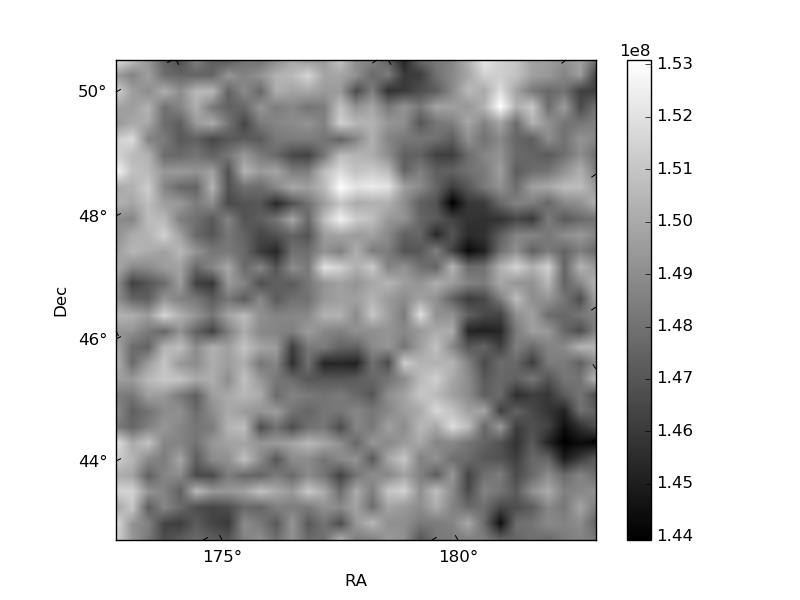
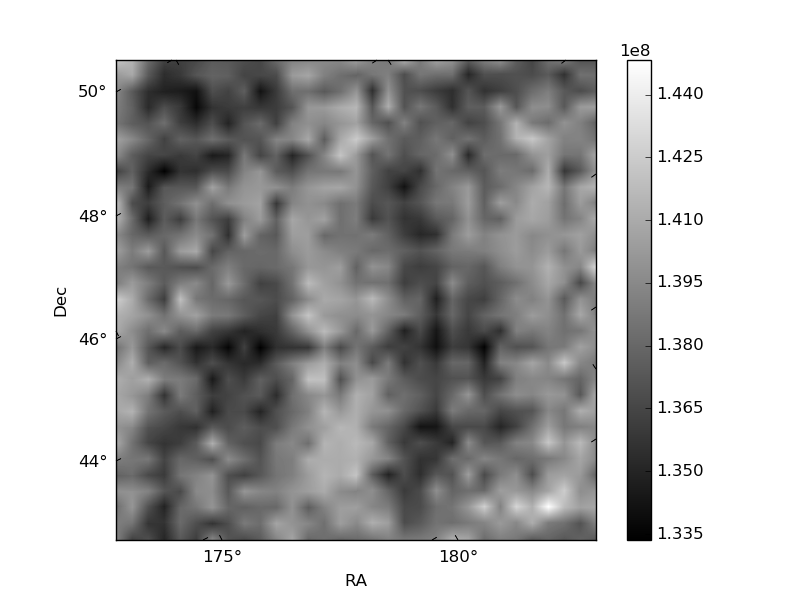
Histogram calculated using DETX and DETY for each event in the final _common_clean file
| Quadrant A | 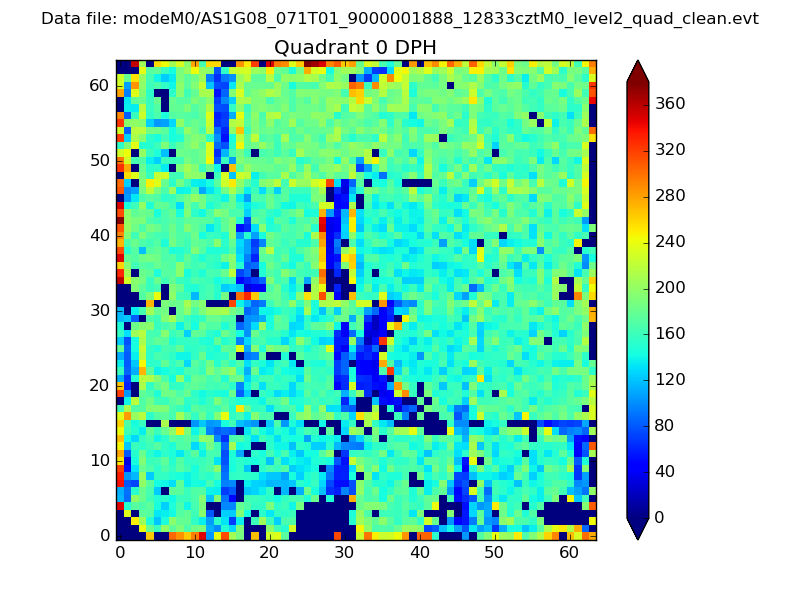 |
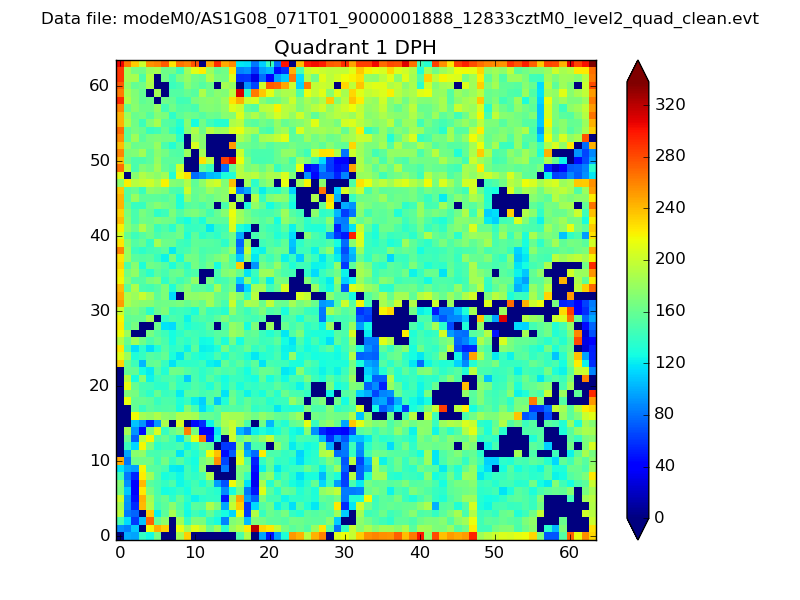 |
Quadrant B |
|---|---|---|---|
| Quadrant D | 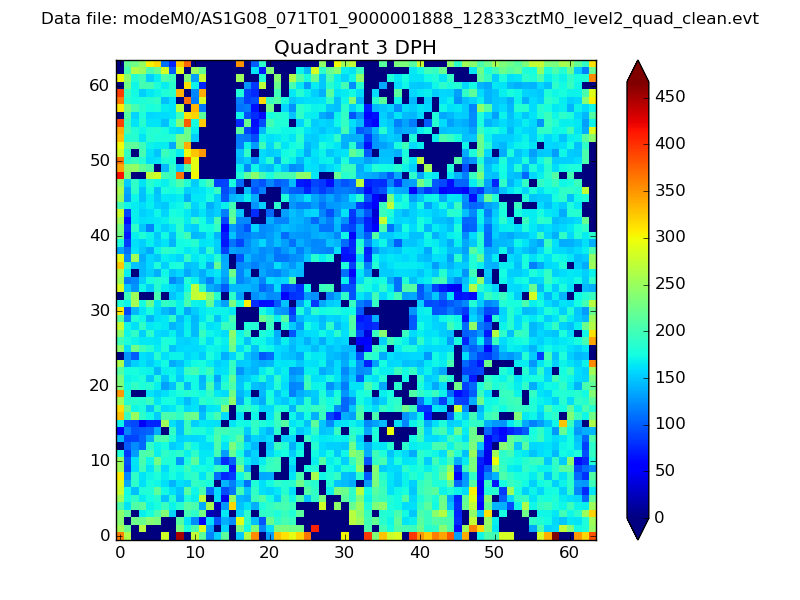 |
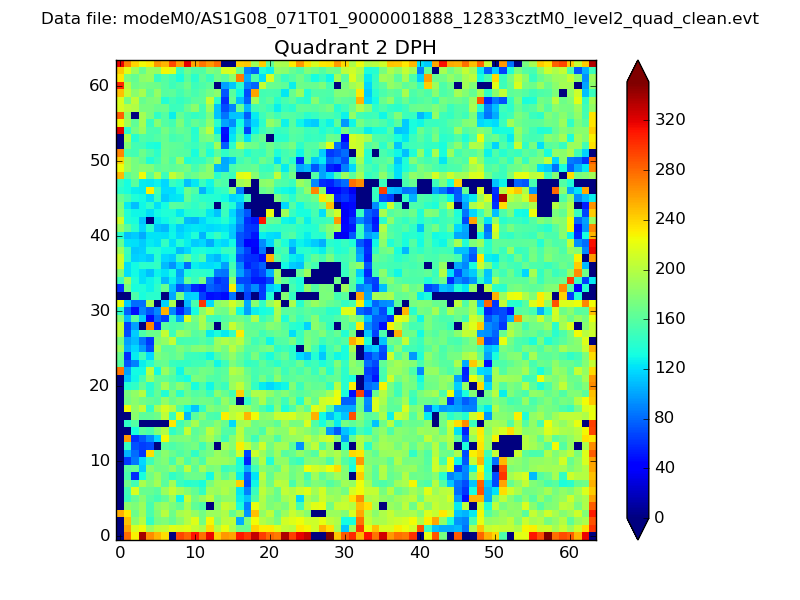 |
Quadrant C |
| Plot type | Count rate plots | Images |
|---|---|---|
| Comparison with Poisson distribution Blue bars denote a histogram of data divided into 1 sec bins. Red curve is a Poisson curve with rate = median count rate of data. |
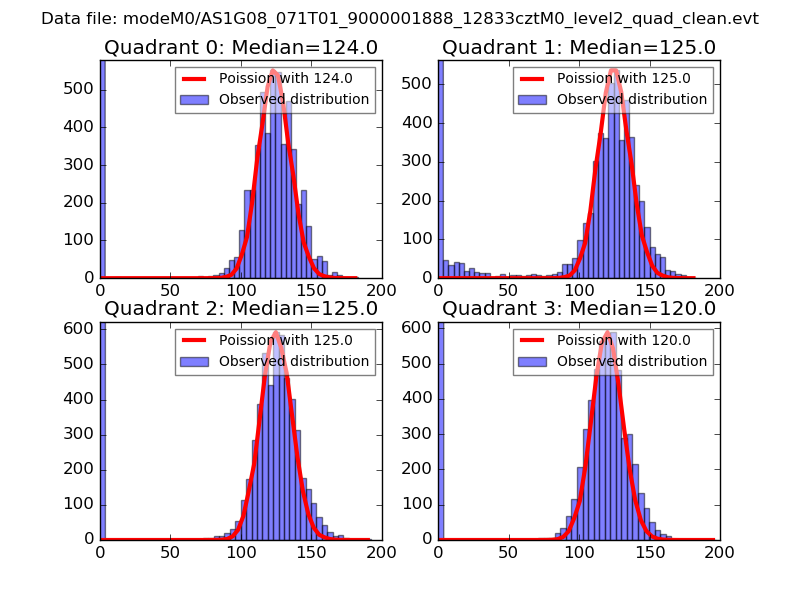 |
 |
| Quadrant-wise count rates Data is divided into 100 sec bins |
 |
|
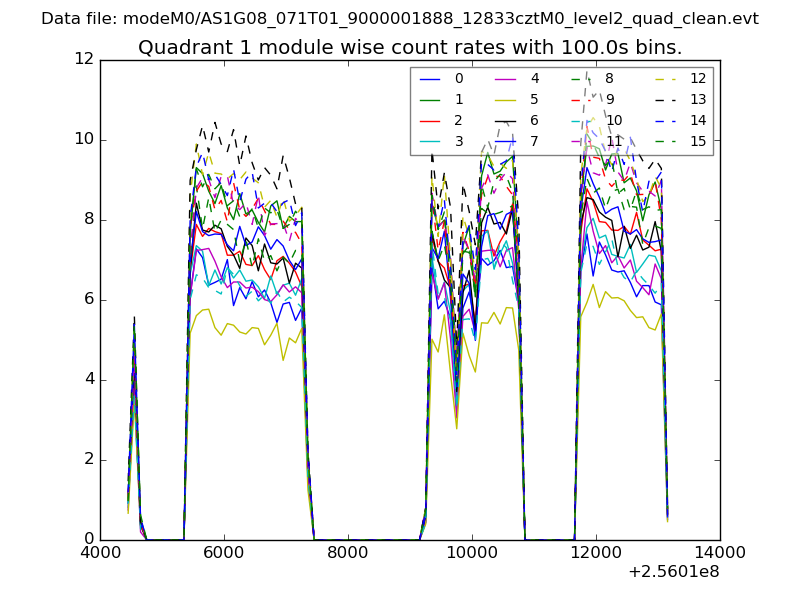
| Module-wise count rates for Quadrant A Data is divided into 100 sec bins |
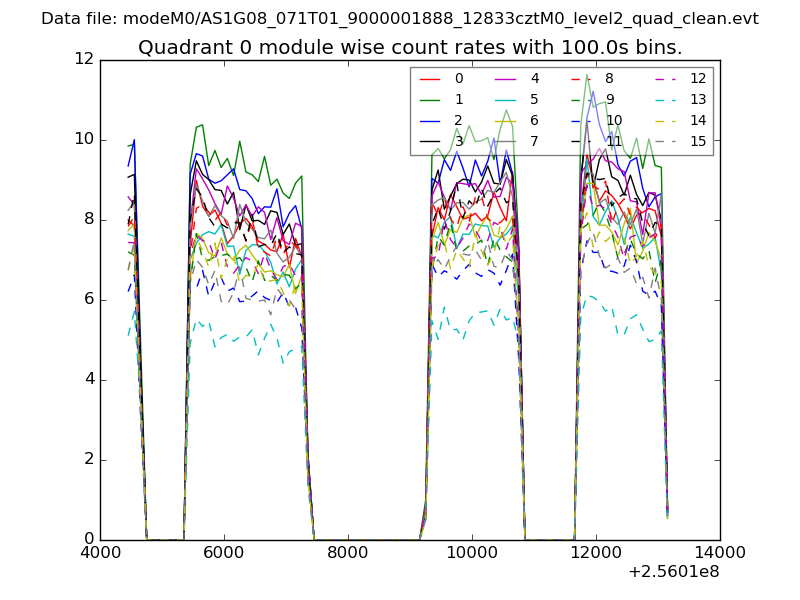 |
 |
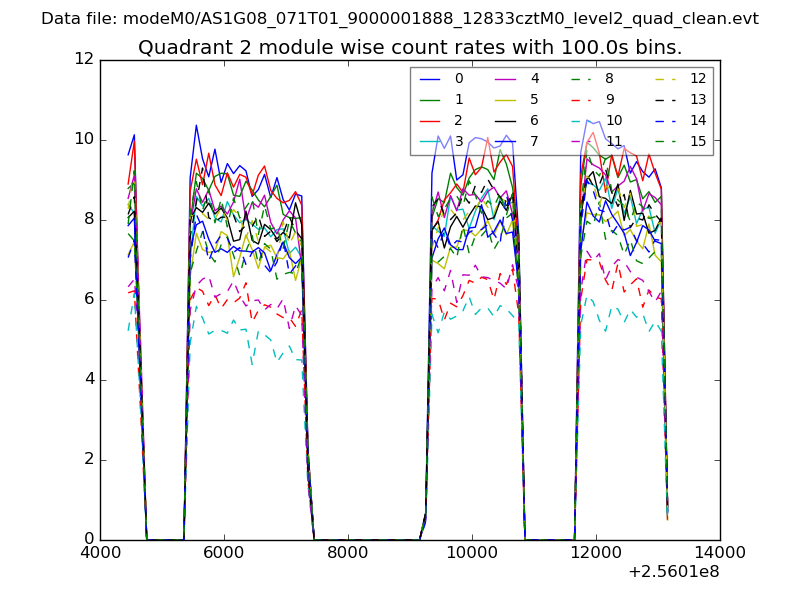
| Module-wise count rates for Quadrant B Data is divided into 100 sec bins |
 |
 |
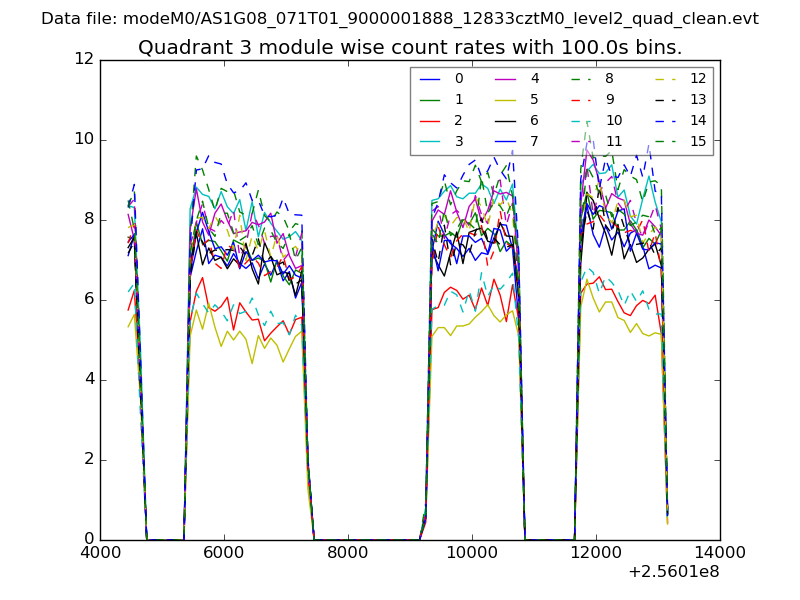
| Module-wise count rates for Quadrant C Data is divided into 100 sec bins |
 |
 |
| Module-wise count rates for Quadrant D Data is divided into 100 sec bins |
 |
 |
| Parameter | Plot |
|---|---|
| CZT HV Monitor | 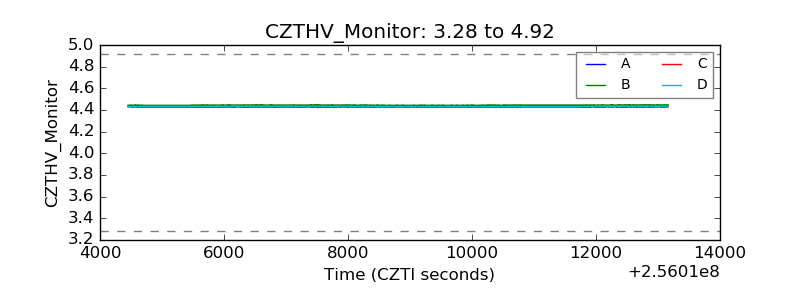 |
| D_VDD | 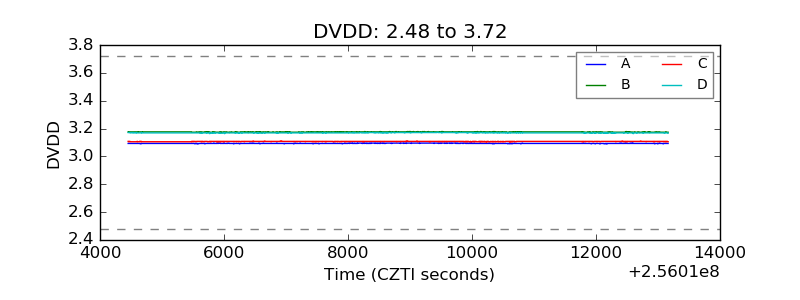 |
| Temperature 1 | 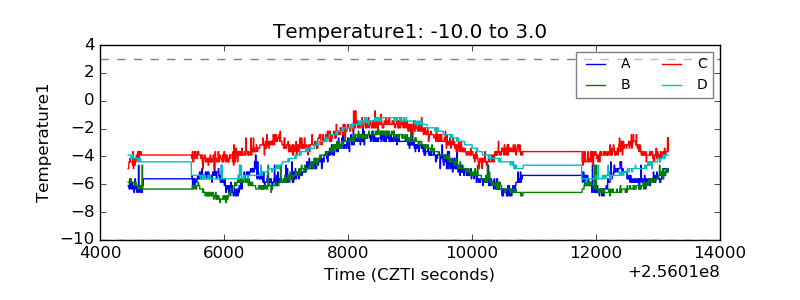 |
| Veto HV Monitor |  |
| Veto LLD | 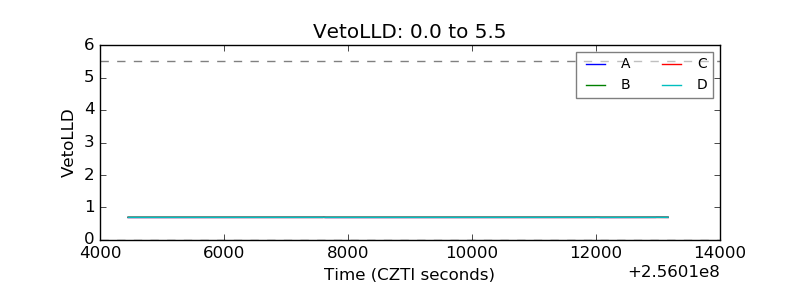 |
| Alpha Counter | 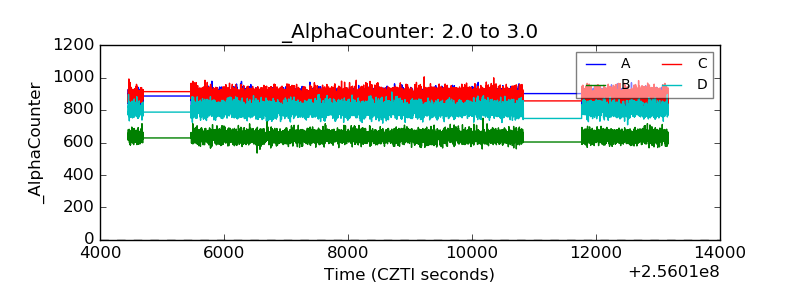 |
| _CPM_Rate | 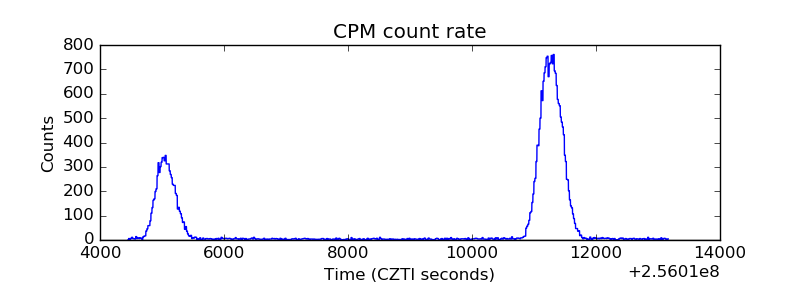 |
| CZT Counter | 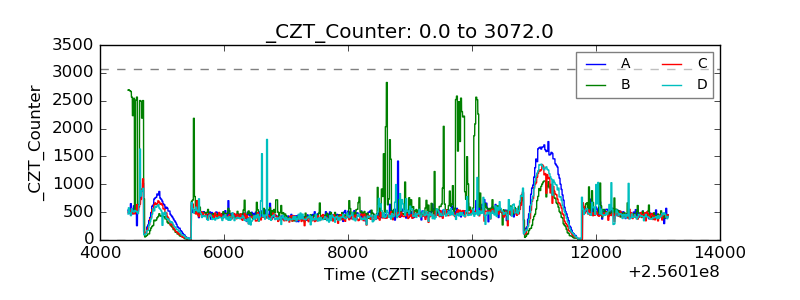 |
| +2.5 Volts monitor |  |
| +5 Volts monitor | 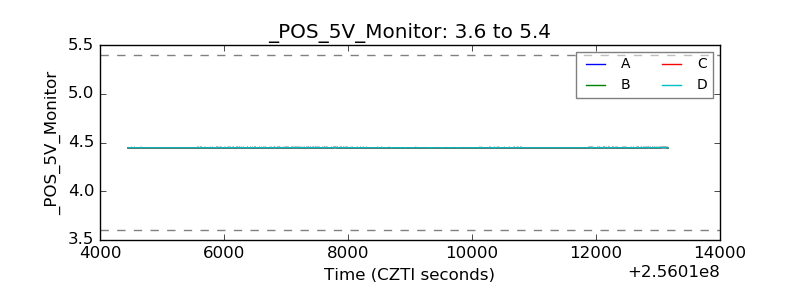 |
| _ROLL_ROT | 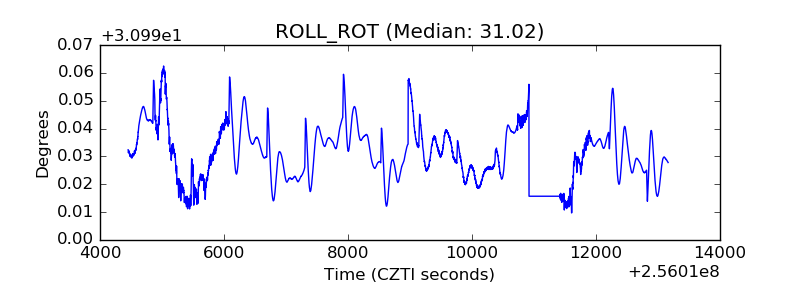 |
| _Roll_DEC | 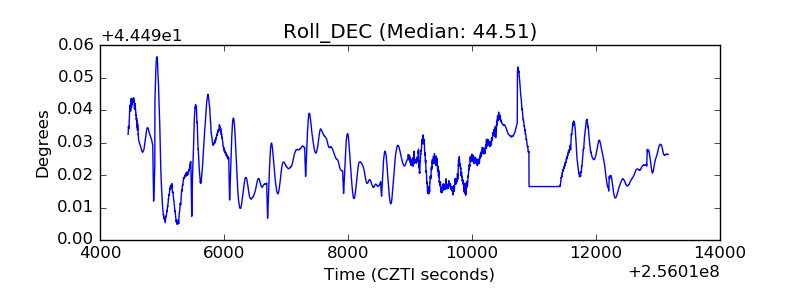 |
| _Roll_RA | 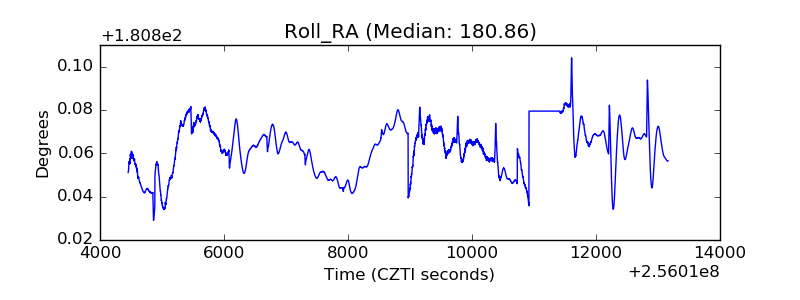 |
| Veto Counter | 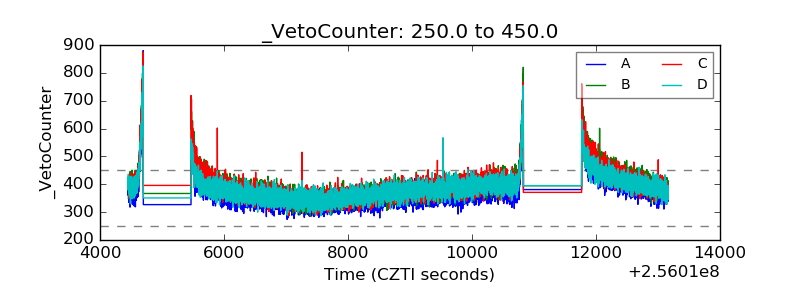 |