| Param | Original file | Final file |
|---|---|---|
| Filename | modeM0/AS1G08_071T01_9000001888_12836cztM0_level2.evt | modeM0/AS1G08_071T01_9000001888_12836cztM0_level2_quad_clean.evt |
| Size (bytes) | 491,613,120 | 82,048,320 |
| Size | 468.8 MB | 78.2 MB |
| Events in quadrant A | 3,242,934 | 521,362 |
| Events in quadrant B | 4,565,629 | 507,335 |
| Events in quadrant C | 3,037,120 | 514,568 |
| Events in quadrant D | 3,606,935 | 493,132 |
| Mode SS | |||
|---|---|---|---|
| Quadrant | BADHDUFLAG | Total packets | Discarded packets |
| A | 0 | 132 | 0 |
| B | 0 | 132 | 0 |
| C | 0 | 132 | 0 |
| D | 0 | 132 | 0 |
| Mode M9 | |||
|---|---|---|---|
| Quadrant | BADHDUFLAG | Total packets | Discarded packets |
| A | 0 | 12 | 0 |
| B | 0 | 12 | 0 |
| C | 0 | 12 | 0 |
| D | 0 | 12 | 0 |
| Mode M0 | |||
|---|---|---|---|
| Quadrant | BADHDUFLAG | Total packets | Discarded packets |
| A | 0 | 13568 | 3 |
| B | 0 | 17460 | 2 |
| C | 0 | 13111 | 2 |
| D | 0 | 14882 | 2 |
| Quadrant | Total seconds | Saturated seconds | Saturation percentage |
|---|---|---|---|
| A | 6415 | 34 | 0.530008% |
| B | 6415 | 433 | 6.749805% |
| C | 6415 | 24 | 0.374123% |
| D | 6415 | 95 | 1.480904% |
Noise dominated data is calculated using 1-second bins in cleaned event files. If a bin has >2000 counts, and if more than 50% of those come from <1% of pixels, then it is considered to be noise-dominated and hence unusable.
| Quadrant | # 1 sec bins | Bins with >0 counts | Bins with >2000 counts | High rate bins dominated by noise | Noise dominated (total time) | Noise dominated (detector-on time) | Marked lightcurve |
|---|---|---|---|---|---|---|---|
| A | 7631 | 6417 | 0 | 0 | 0.00% | 0.00% | 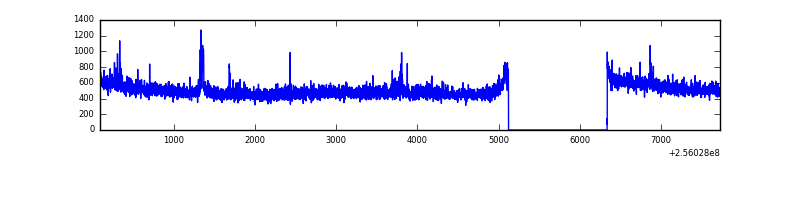 |
| B | 7631 | 6417 | 288 | 288 | 3.77% | 4.49% | 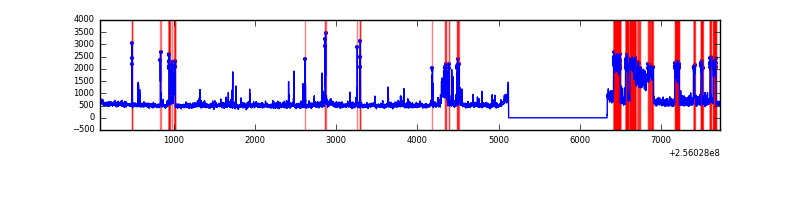 |
| C | 7631 | 6417 | 0 | 0 | 0.00% | 0.00% | 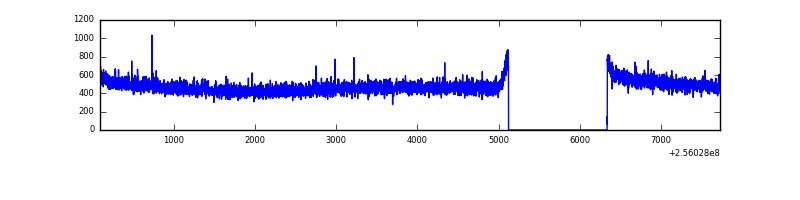 |
| D | 7631 | 6417 | 54 | 54 | 0.71% | 0.84% | 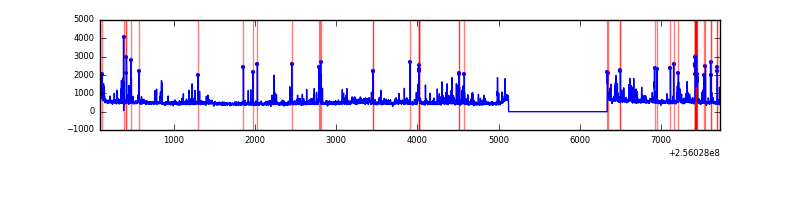 |
Top three noisy pixels from each quadrant. If the there are fewer than three noisy pixels in the level2.evt file, extra rows are filled as -1
| Pixel properties | Quadrant properties | ||||||
|---|---|---|---|---|---|---|---|
| Quadrant | DetID | PixID | Counts | Sigma | Mean | Median | Sigma |
| A | 12 | 189 | 65238 | 392.05 | 818 | 801 | 164.4 |
| A | 15 | 222 | 34102 | 202.61 | 818 | 801 | 164.4 |
| A | 0 | 226 | 7404 | 40.17 | 818 | 801 | 164.4 |
| B | 4 | 206 | 891892 | 5931.44 | 796 | 779 | 150.2 |
| B | 4 | 239 | 220326 | 1461.35 | 796 | 779 | 150.2 |
| B | 0 | 85 | 126899 | 839.48 | 796 | 779 | 150.2 |
| C | 13 | 61 | 5711 | 27.58 | 777 | 781 | 178.8 |
| C | 3 | 248 | 3278 | 13.97 | 777 | 781 | 178.8 |
| C | 3 | 233 | 2137 | 7.59 | 777 | 781 | 178.8 |
| D | 4 | 95 | 234537 | 1271.46 | 779 | 758 | 183.9 |
| D | 8 | 195 | 146625 | 793.33 | 779 | 758 | 183.9 |
| D | 2 | 136 | 126756 | 685.27 | 779 | 758 | 183.9 |
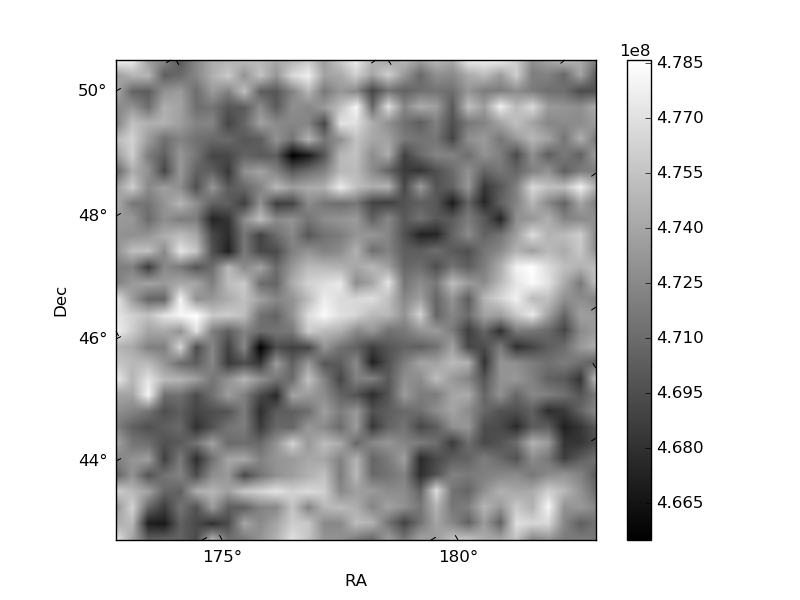
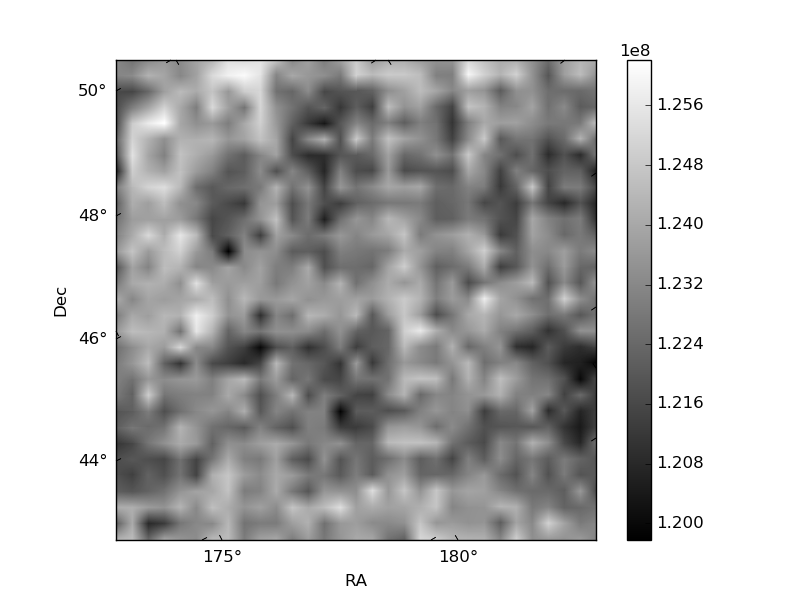
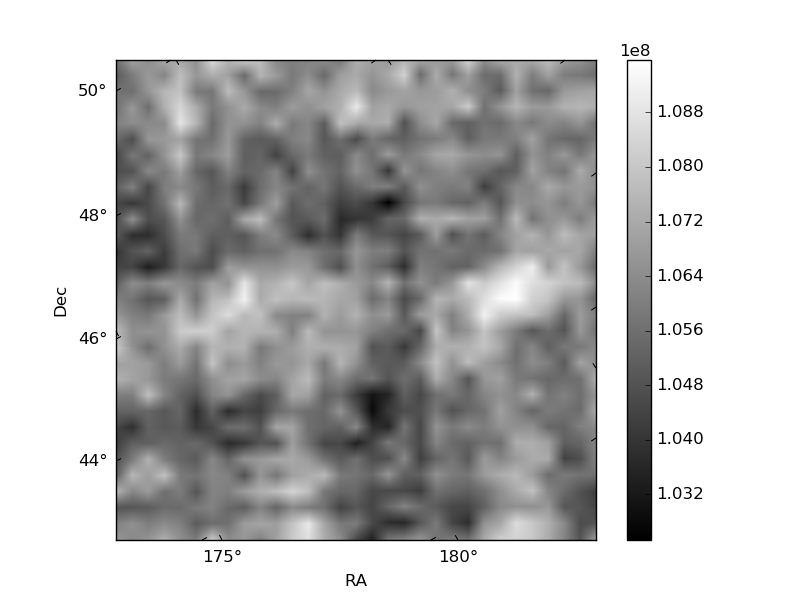
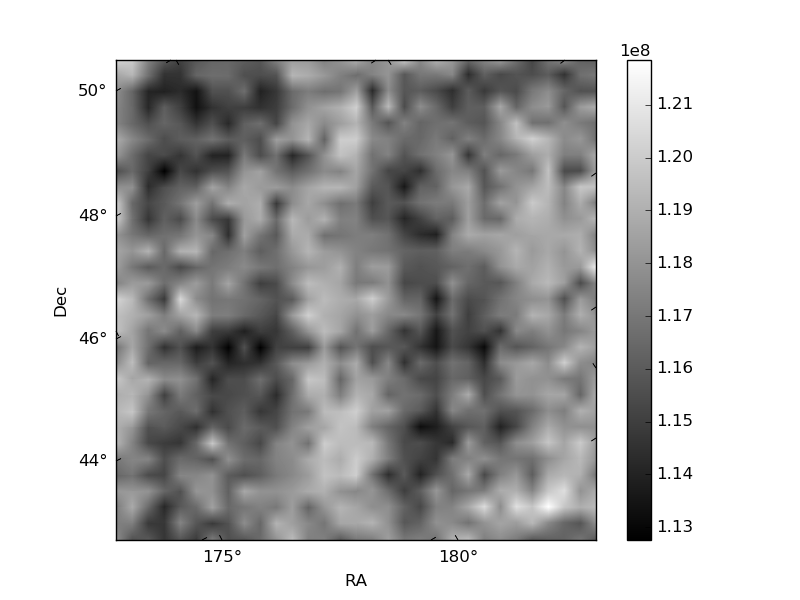
Histogram calculated using DETX and DETY for each event in the final _common_clean file
| Quadrant A | 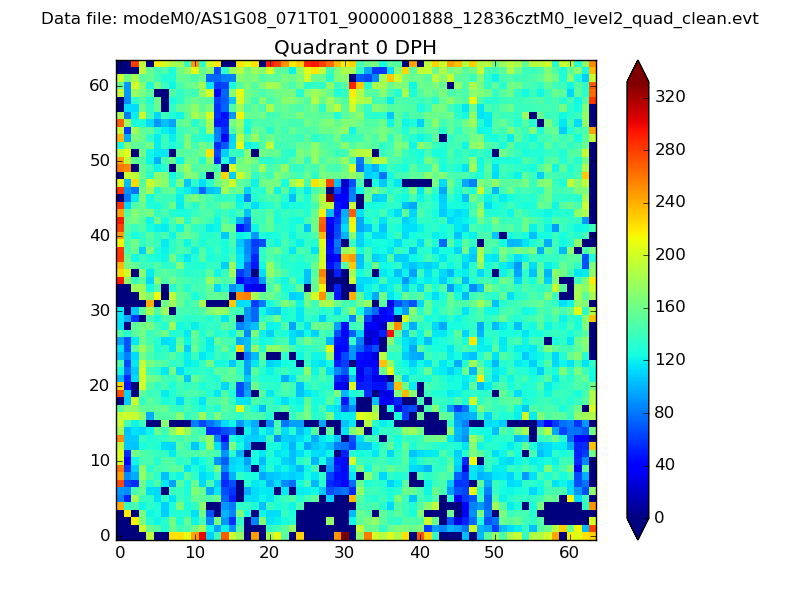 |
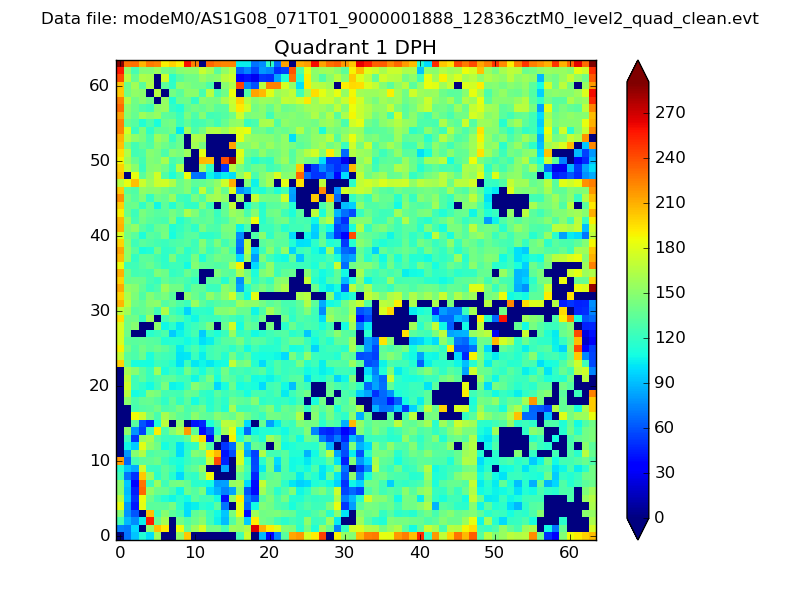 |
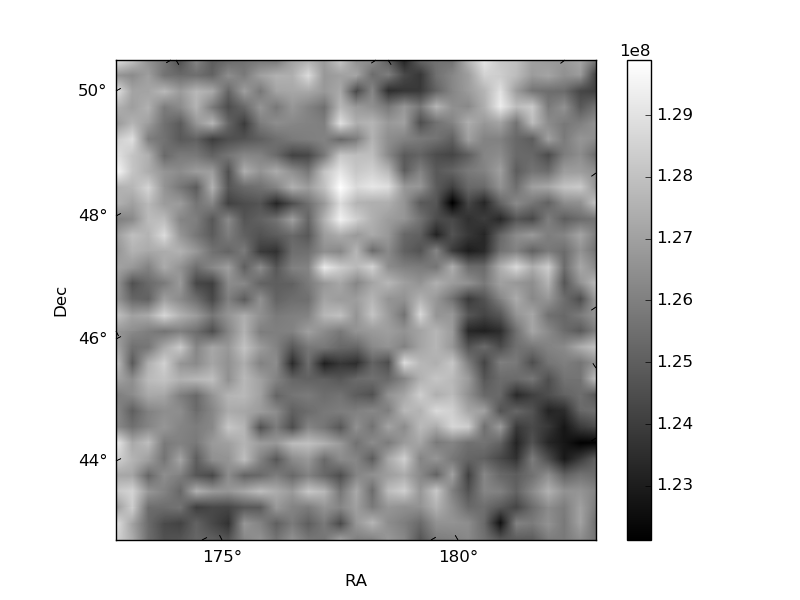
Quadrant B |
|---|---|---|---|
| Quadrant D | 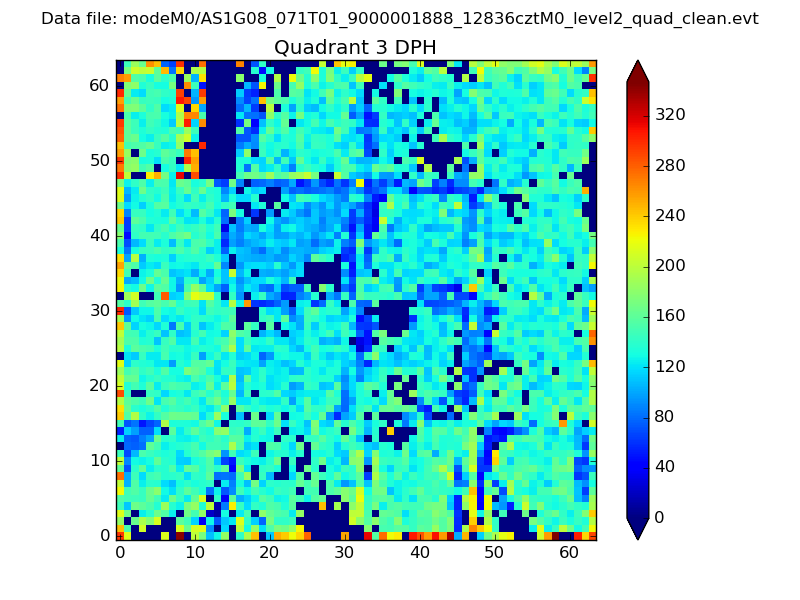 |
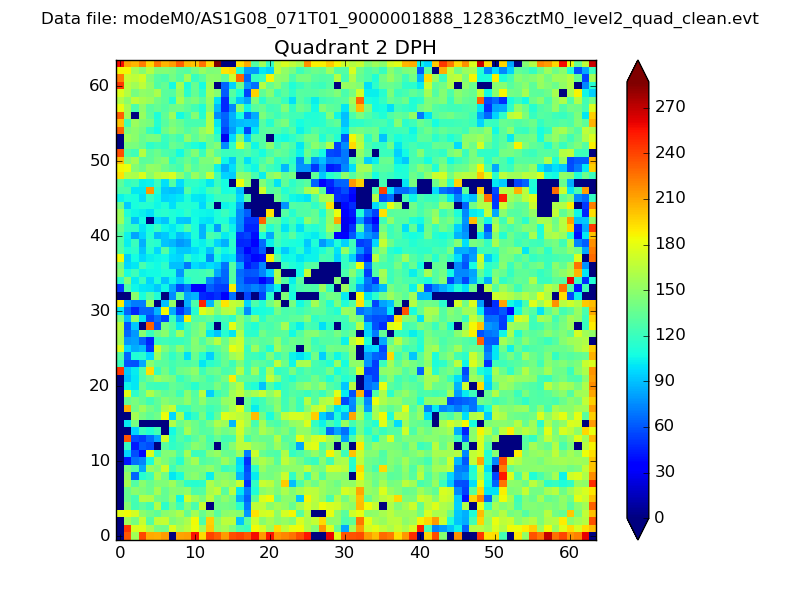 |
Quadrant C |
| Plot type | Count rate plots | Images |
|---|---|---|
| Comparison with Poisson distribution Blue bars denote a histogram of data divided into 1 sec bins. Red curve is a Poisson curve with rate = median count rate of data. |
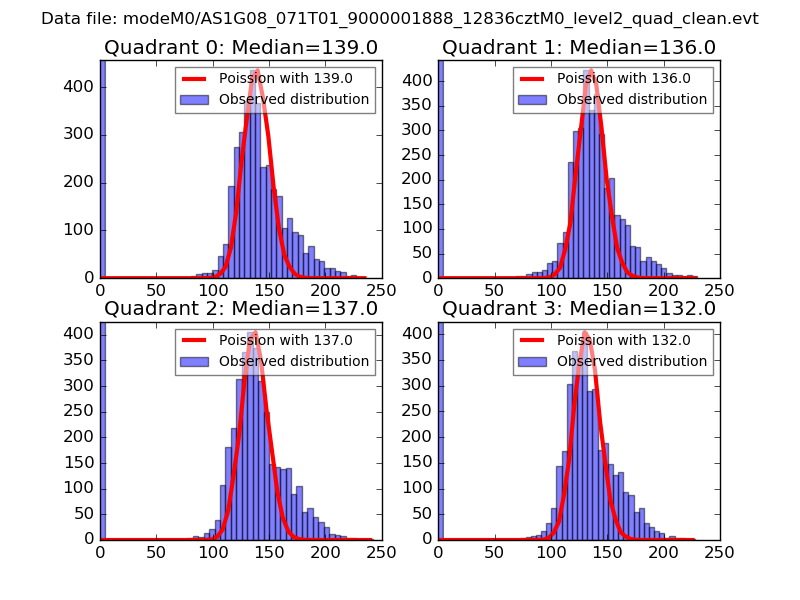 |
 |
| Quadrant-wise count rates Data is divided into 100 sec bins |
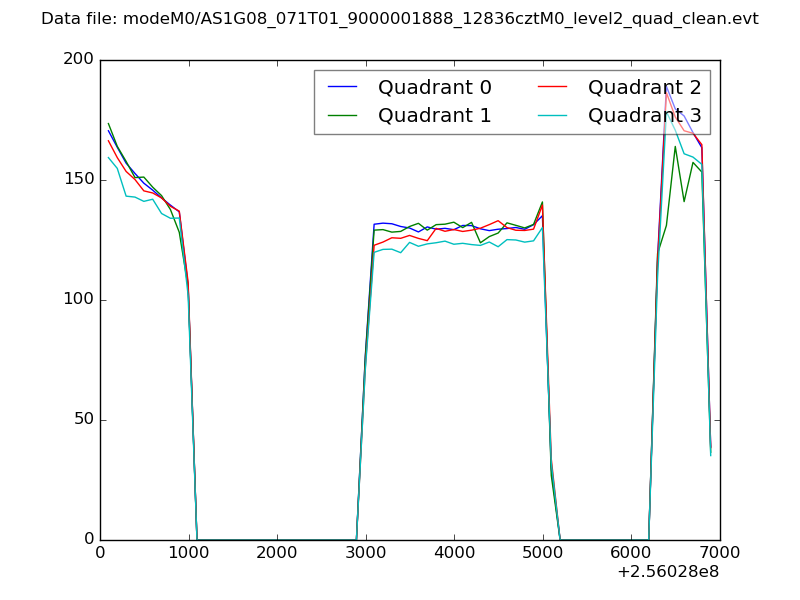 |
|
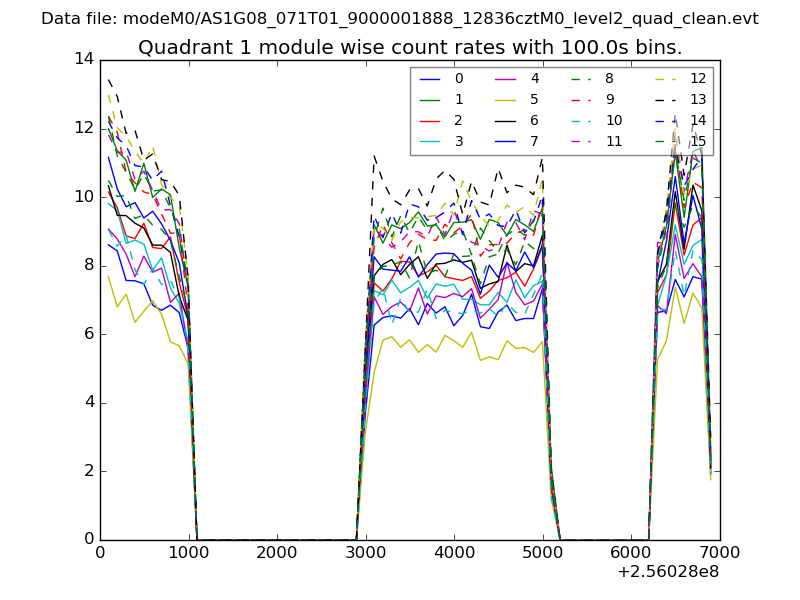
| Module-wise count rates for Quadrant A Data is divided into 100 sec bins |
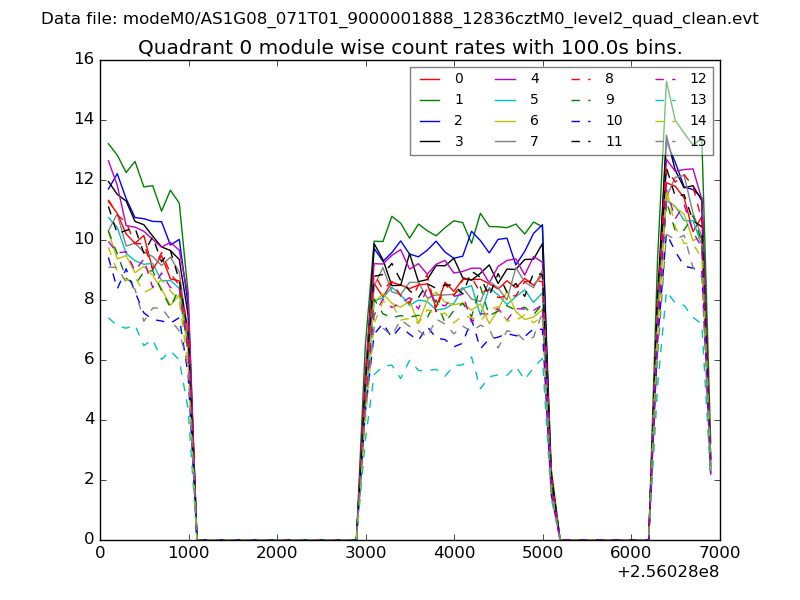 |
 |
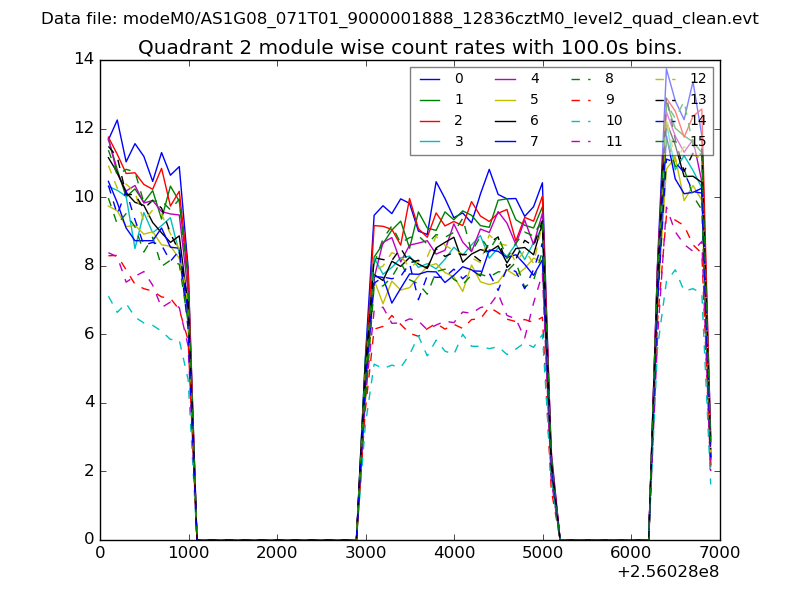
| Module-wise count rates for Quadrant B Data is divided into 100 sec bins |
 |
 |
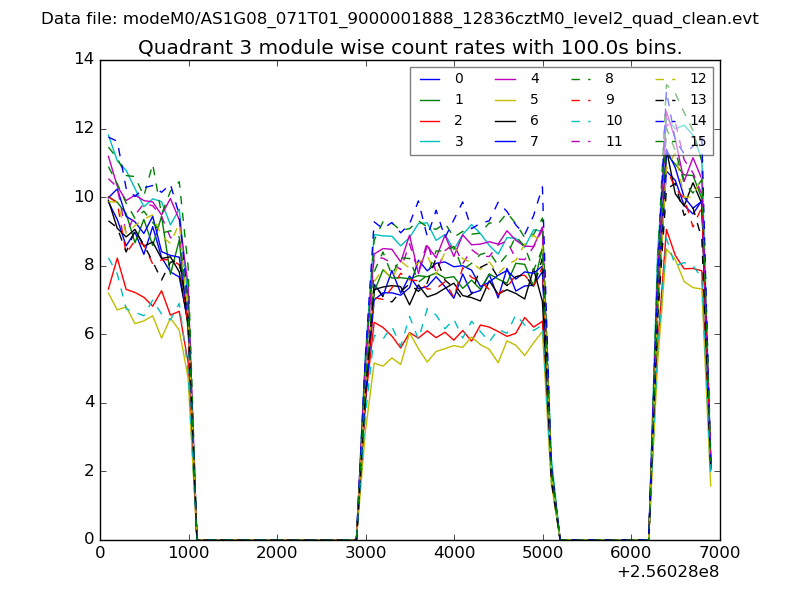
| Module-wise count rates for Quadrant C Data is divided into 100 sec bins |
 |
 |
| Module-wise count rates for Quadrant D Data is divided into 100 sec bins |
 |
 |
| Parameter | Plot |
|---|---|
| CZT HV Monitor | 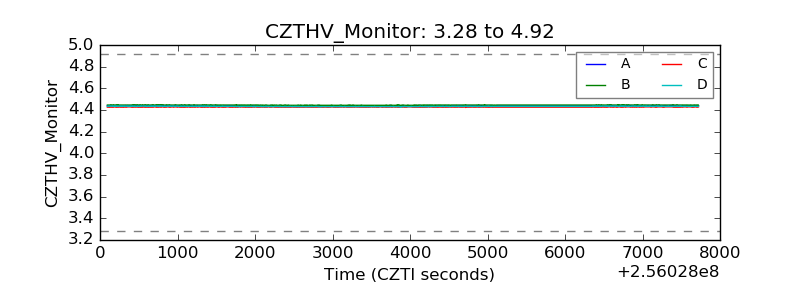 |
| D_VDD | 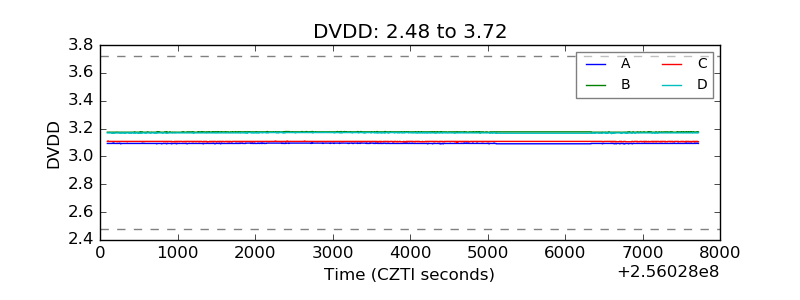 |
| Temperature 1 | 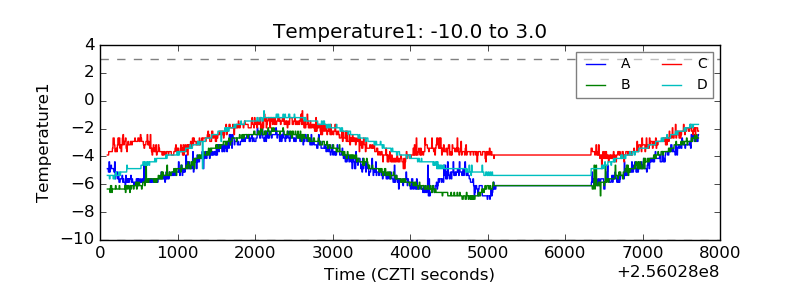 |
| Veto HV Monitor | 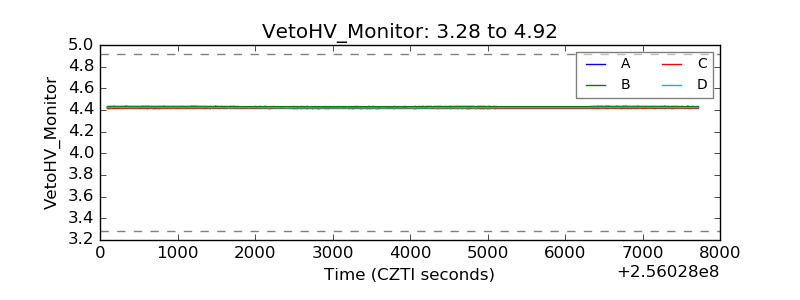 |
| Veto LLD | 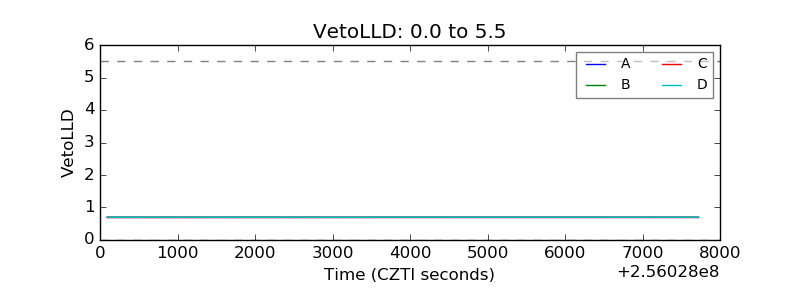 |
| Alpha Counter | 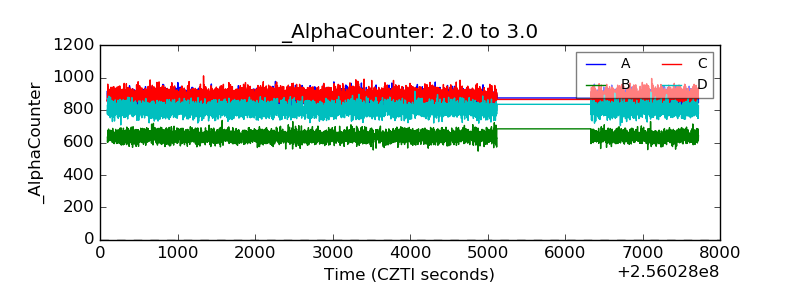 |
| _CPM_Rate | 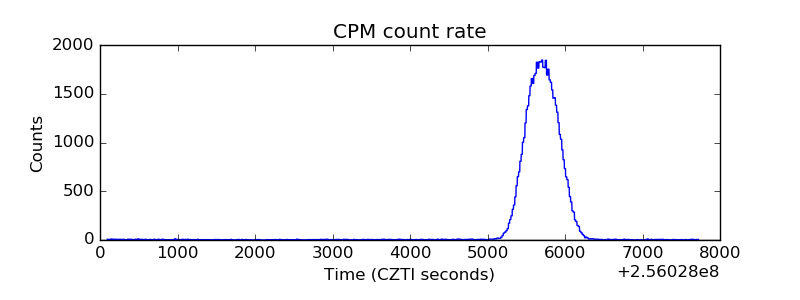 |
| CZT Counter | 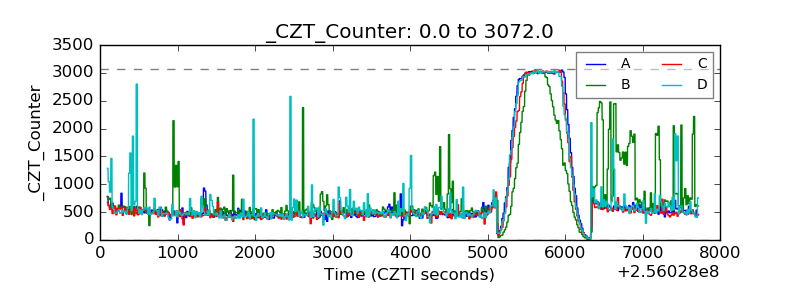 |
| +2.5 Volts monitor |  |
| +5 Volts monitor |  |
| _ROLL_ROT | 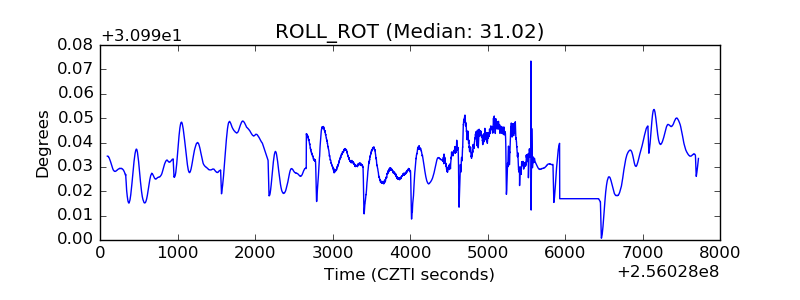 |
| _Roll_DEC | 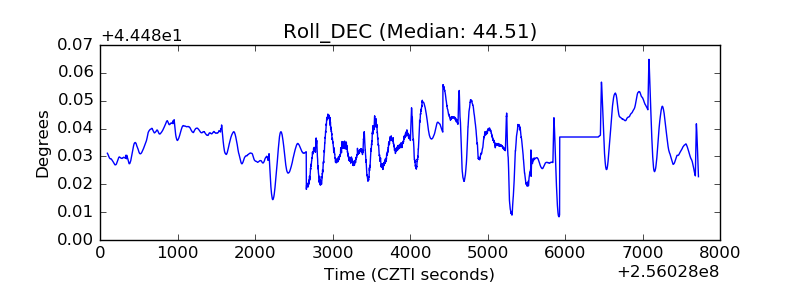 |
| _Roll_RA | 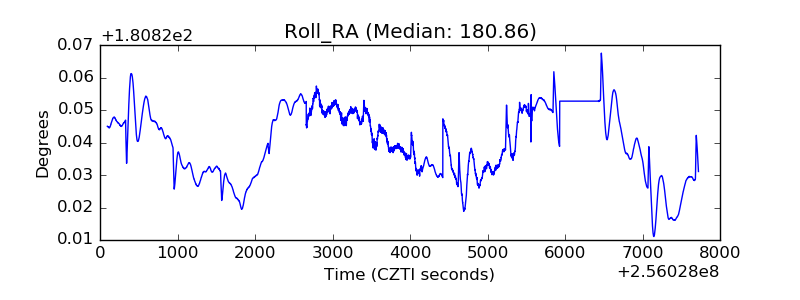 |
| Veto Counter | 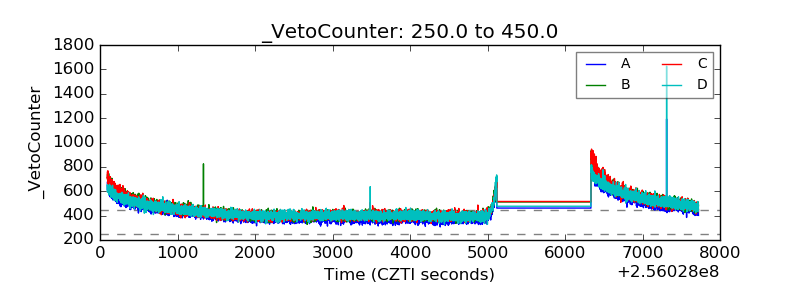 |