| Param | Original file | Final file |
|---|---|---|
| Filename | modeM0/AS1G08_071T01_9000001888_12841cztM0_level2.evt | modeM0/AS1G08_071T01_9000001888_12841cztM0_level2_quad_clean.evt |
| Size (bytes) | 527,880,960 | 92,364,480 |
| Size | 503.4 MB | 88.1 MB |
| Events in quadrant A | 3,207,766 | 598,807 |
| Events in quadrant B | 5,527,714 | 556,892 |
| Events in quadrant C | 3,149,995 | 595,558 |
| Events in quadrant D | 3,641,437 | 573,431 |
| Mode SS | |||
|---|---|---|---|
| Quadrant | BADHDUFLAG | Total packets | Discarded packets |
| A | 0 | 136 | 0 |
| B | 0 | 136 | 0 |
| C | 0 | 136 | 0 |
| D | 0 | 136 | 0 |
| Mode M9 | |||
|---|---|---|---|
| Quadrant | BADHDUFLAG | Total packets | Discarded packets |
| A | 0 | 9 | 0 |
| B | 0 | 9 | 0 |
| C | 0 | 9 | 0 |
| D | 0 | 10 | 0 |
| Mode M0 | |||
|---|---|---|---|
| Quadrant | BADHDUFLAG | Total packets | Discarded packets |
| A | 0 | 13947 | 3 |
| B | 0 | 21059 | 2 |
| C | 0 | 13849 | 2 |
| D | 0 | 15487 | 2 |
| Quadrant | Total seconds | Saturated seconds | Saturation percentage |
|---|---|---|---|
| A | 6779 | 61 | 0.899838% |
| B | 6779 | 1008 | 14.869450% |
| C | 6779 | 48 | 0.708069% |
| D | 6779 | 134 | 1.976693% |
Noise dominated data is calculated using 1-second bins in cleaned event files. If a bin has >2000 counts, and if more than 50% of those come from <1% of pixels, then it is considered to be noise-dominated and hence unusable.
| Quadrant | # 1 sec bins | Bins with >0 counts | Bins with >2000 counts | High rate bins dominated by noise | Noise dominated (total time) | Noise dominated (detector-on time) | Marked lightcurve |
|---|---|---|---|---|---|---|---|
| A | 7635 | 6781 | 0 | 0 | 0.00% | 0.00% | 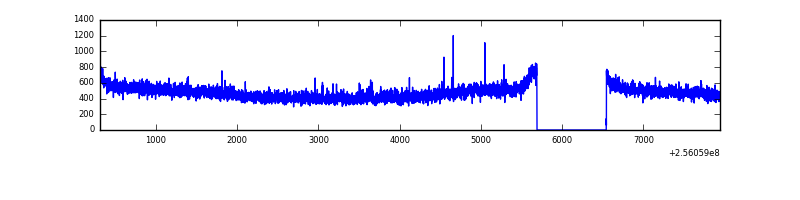 |
| B | 7635 | 6781 | 756 | 756 | 9.90% | 11.15% | 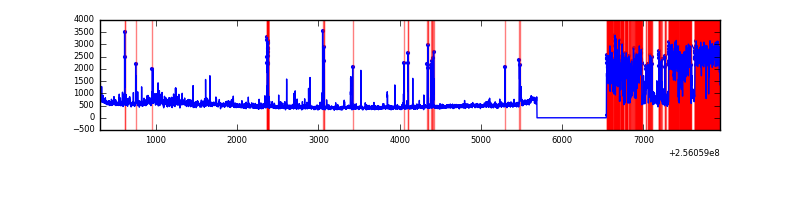 |
| C | 7635 | 6781 | 0 | 0 | 0.00% | 0.00% | 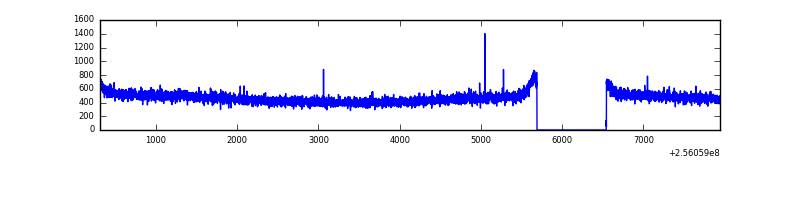 |
| D | 7635 | 6781 | 84 | 84 | 1.10% | 1.24% | 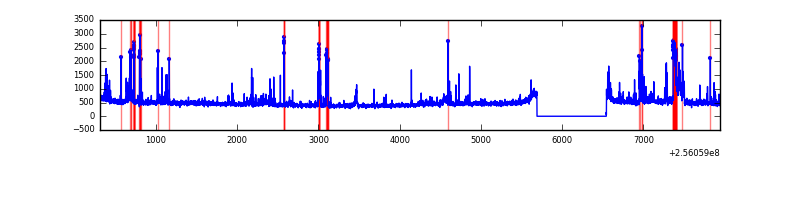 |
Top three noisy pixels from each quadrant. If the there are fewer than three noisy pixels in the level2.evt file, extra rows are filled as -1
| Pixel properties | Quadrant properties | ||||||
|---|---|---|---|---|---|---|---|
| Quadrant | DetID | PixID | Counts | Sigma | Mean | Median | Sigma |
| A | 12 | 189 | 40706 | 240.38 | 823 | 805 | 166.0 |
| A | 0 | 226 | 7531 | 40.52 | 823 | 805 | 166.0 |
| A | 12 | 194 | 6434 | 33.91 | 823 | 805 | 166.0 |
| B | 10 | 245 | 2089003 | 14374.61 | 767 | 749 | 145.3 |
| B | 4 | 239 | 195324 | 1339.37 | 767 | 749 | 145.3 |
| B | 0 | 219 | 87300 | 595.78 | 767 | 749 | 145.3 |
| C | 3 | 233 | 18430 | 94.94 | 803 | 806 | 185.6 |
| C | 13 | 61 | 5851 | 27.18 | 803 | 806 | 185.6 |
| C | 3 | 202 | 1952 | 6.17 | 803 | 806 | 185.6 |
| D | 1 | 52 | 182283 | 946.79 | 799 | 776 | 191.7 |
| D | 13 | 104 | 159816 | 829.6 | 799 | 776 | 191.7 |
| D | 4 | 95 | 138835 | 720.16 | 799 | 776 | 191.7 |
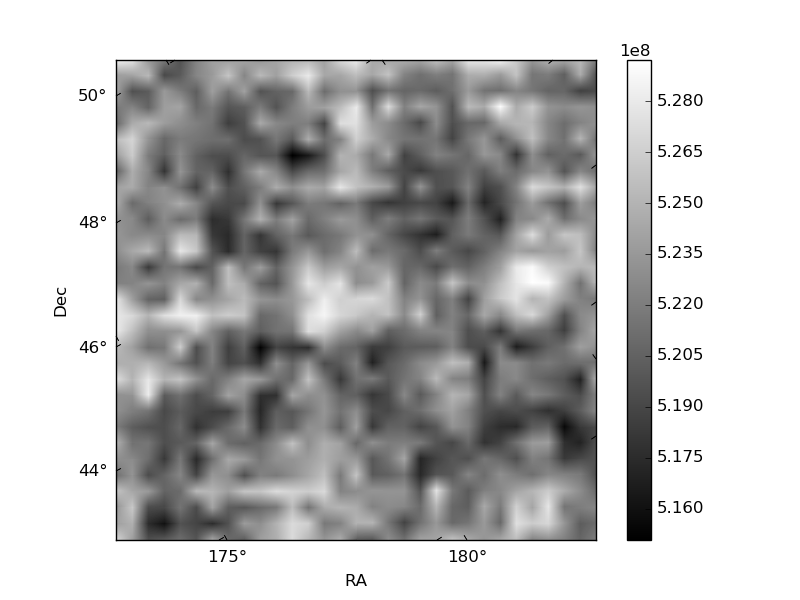
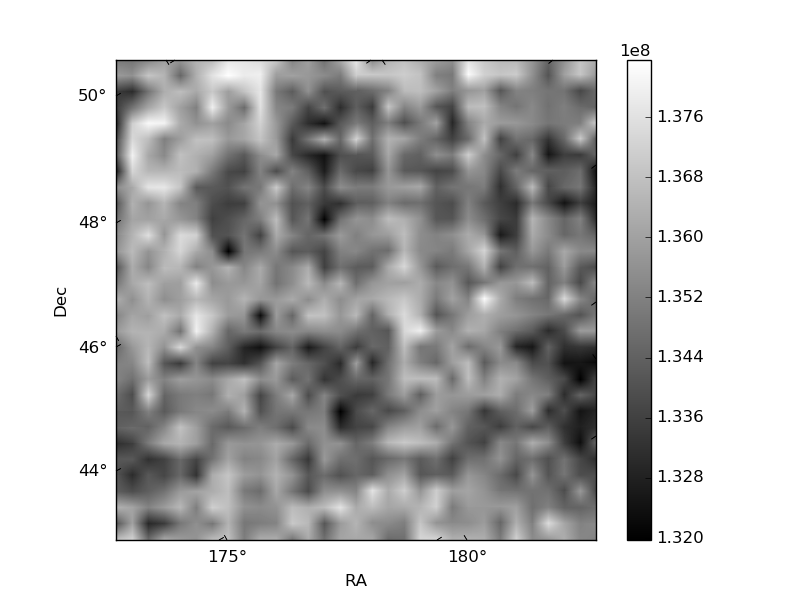
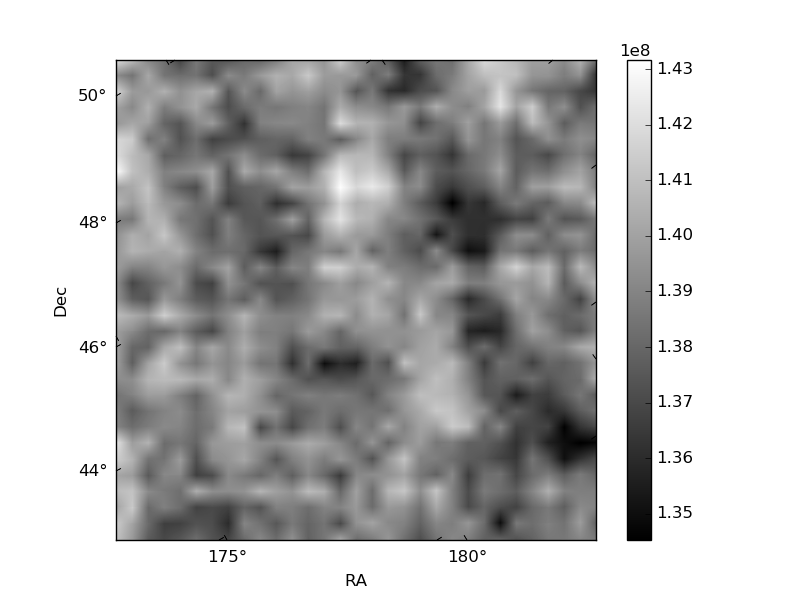
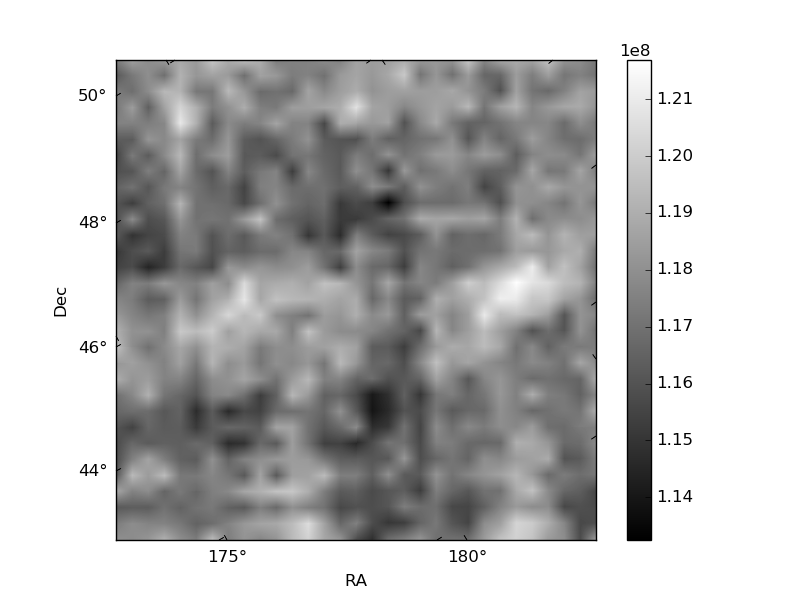
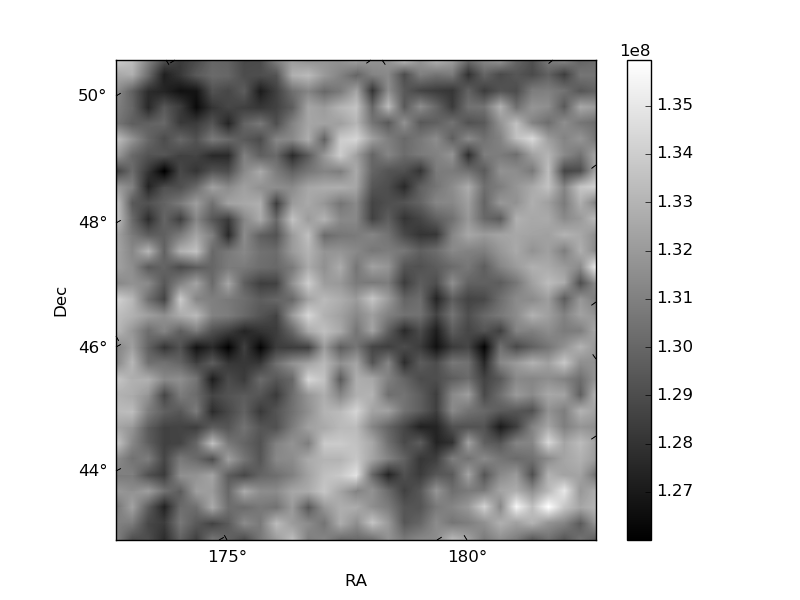
Histogram calculated using DETX and DETY for each event in the final _common_clean file
| Quadrant A | 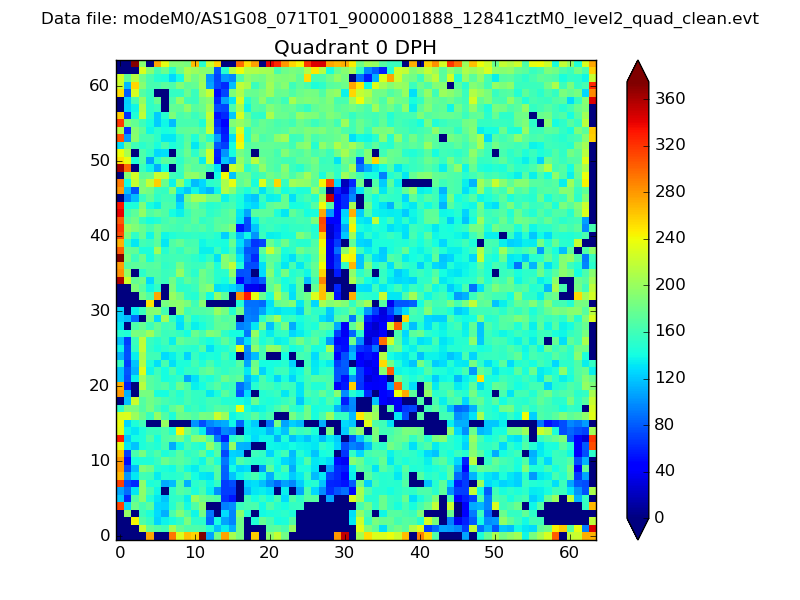 |
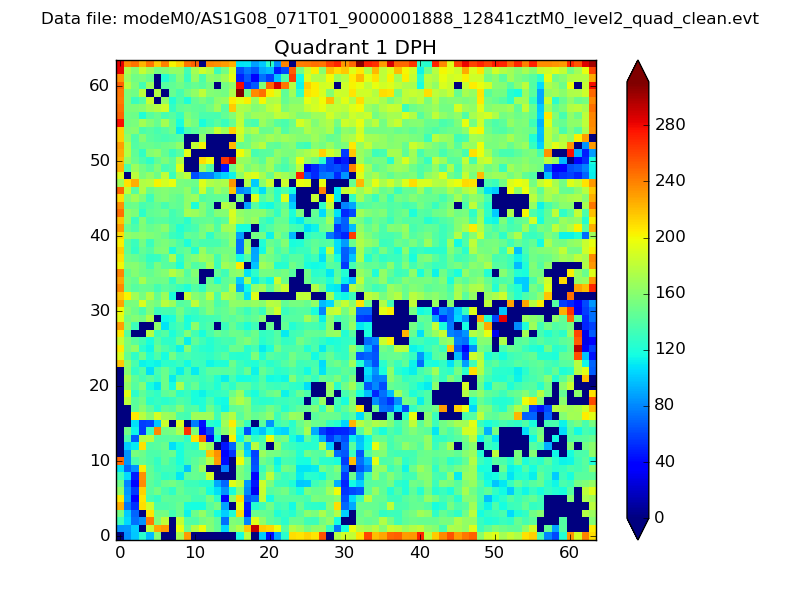 |
Quadrant B |
|---|---|---|---|
| Quadrant D | 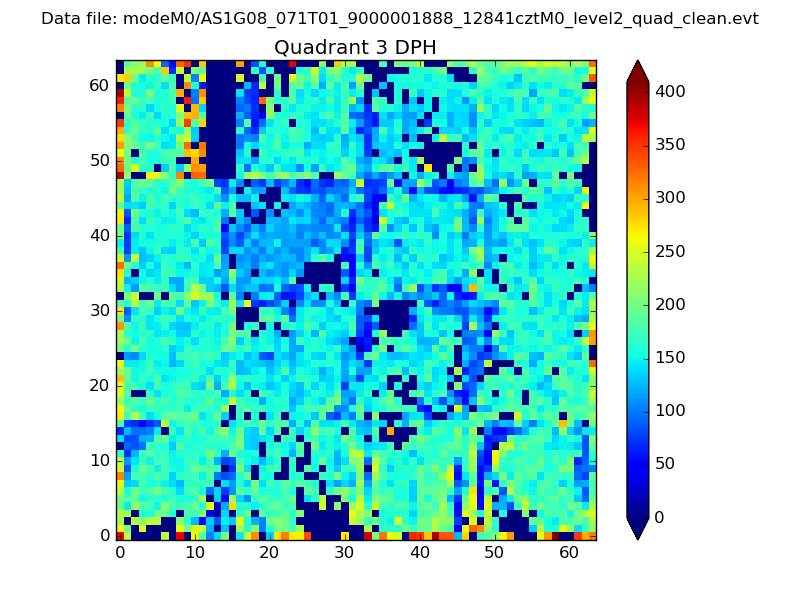 |
 |
Quadrant C |
| Plot type | Count rate plots | Images |
|---|---|---|
| Comparison with Poisson distribution Blue bars denote a histogram of data divided into 1 sec bins. Red curve is a Poisson curve with rate = median count rate of data. |
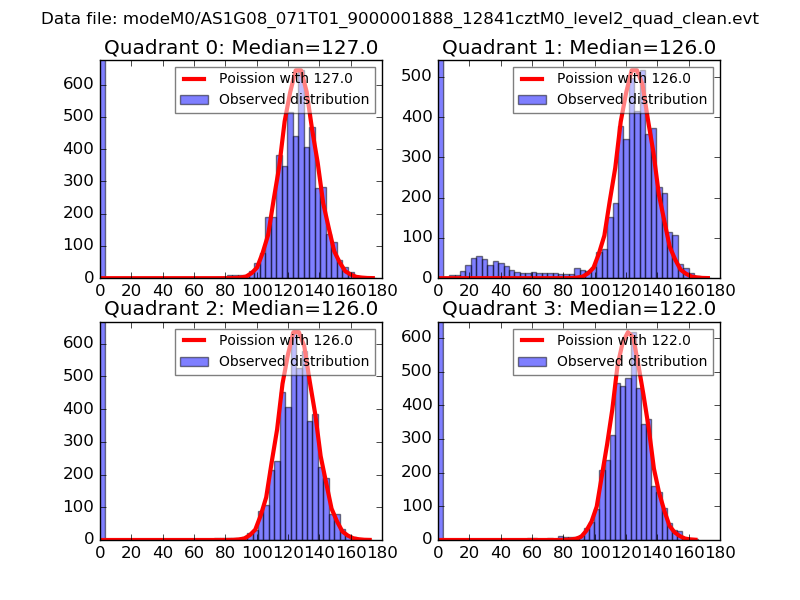 |
 |
| Quadrant-wise count rates Data is divided into 100 sec bins |
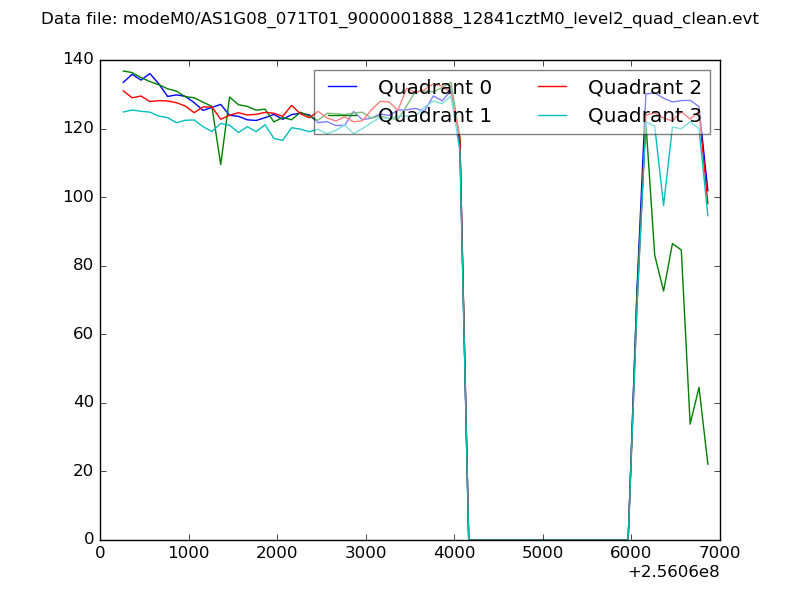 |
|
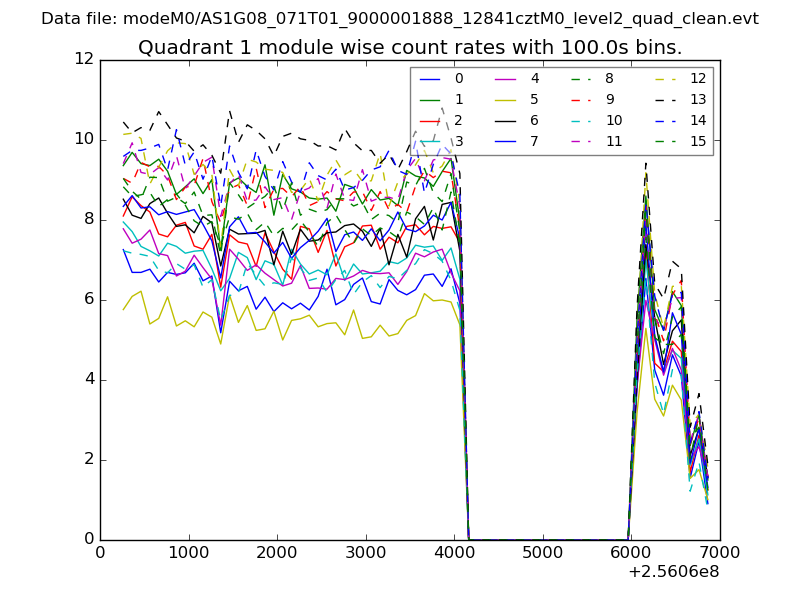
| Module-wise count rates for Quadrant A Data is divided into 100 sec bins |
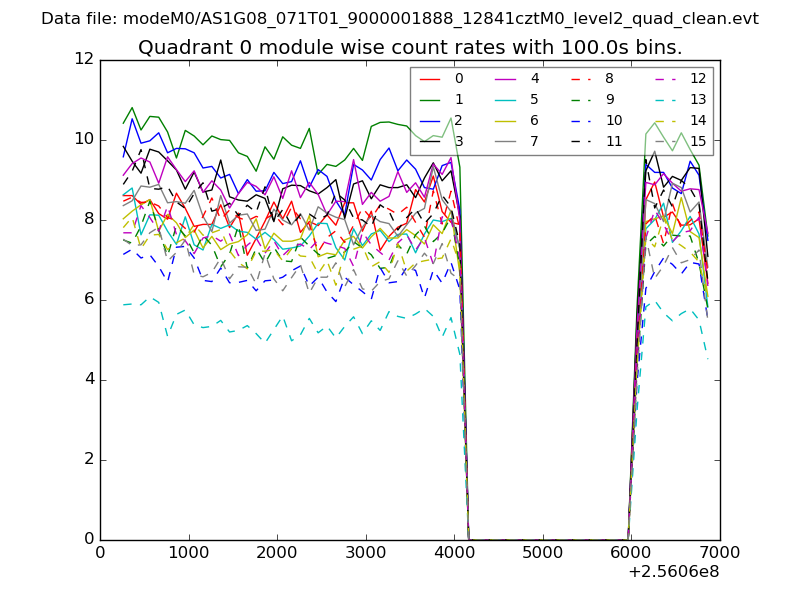 |
 |
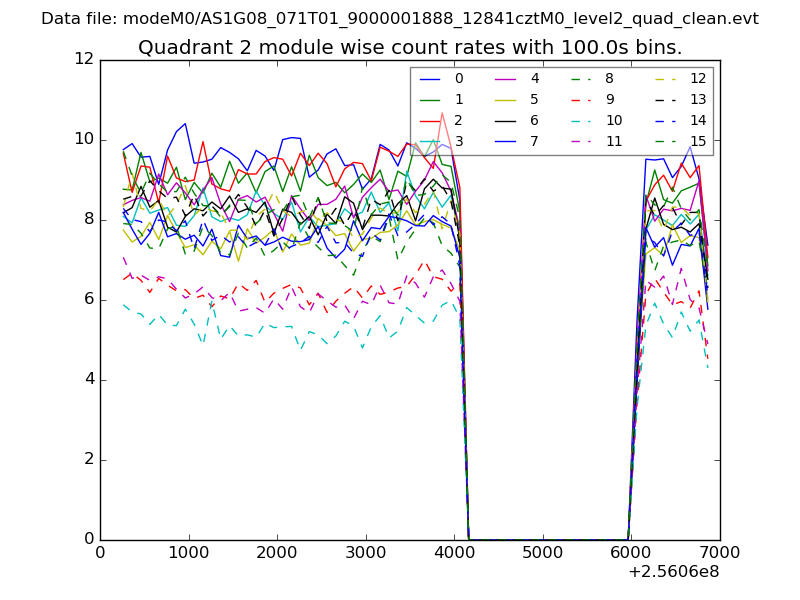
| Module-wise count rates for Quadrant B Data is divided into 100 sec bins |
 |
 |
| Module-wise count rates for Quadrant C Data is divided into 100 sec bins |
 |
 |
| Module-wise count rates for Quadrant D Data is divided into 100 sec bins |
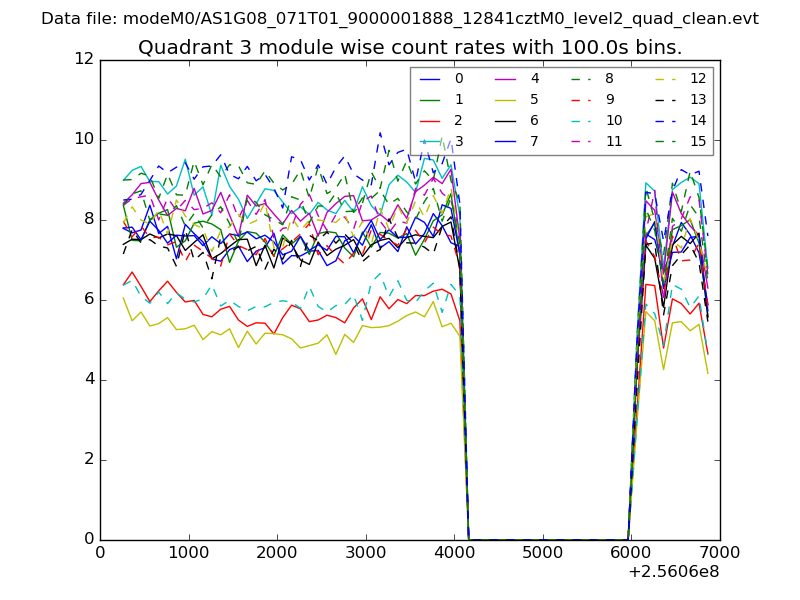 |
 |
| Parameter | Plot |
|---|---|
| CZT HV Monitor | 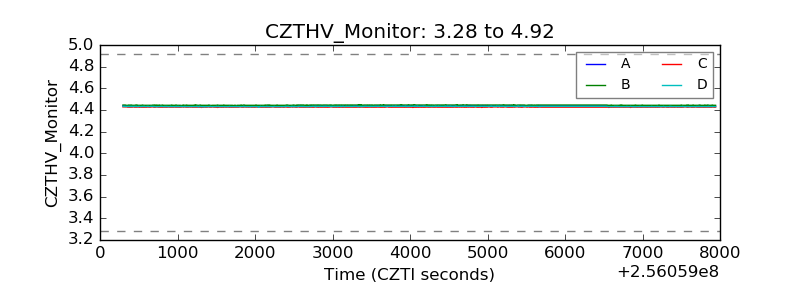 |
| D_VDD | 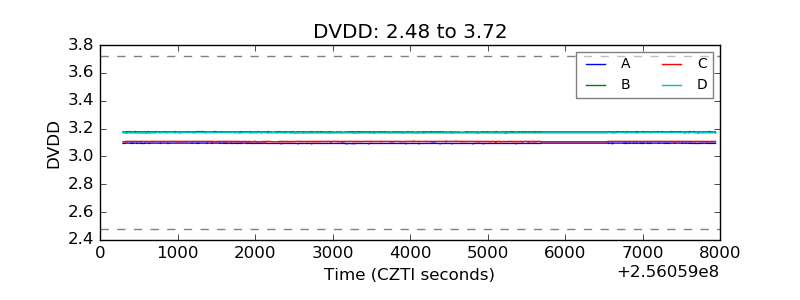 |
| Temperature 1 |  |
| Veto HV Monitor | 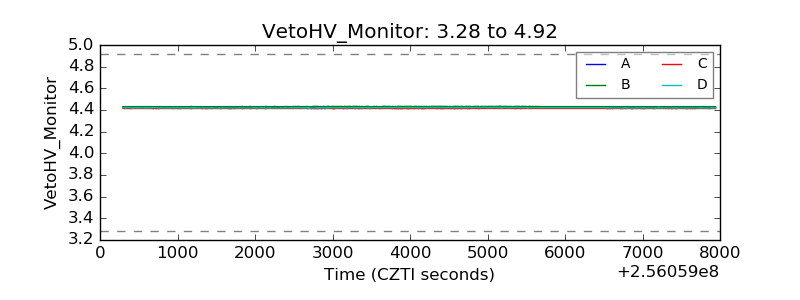 |
| Veto LLD | 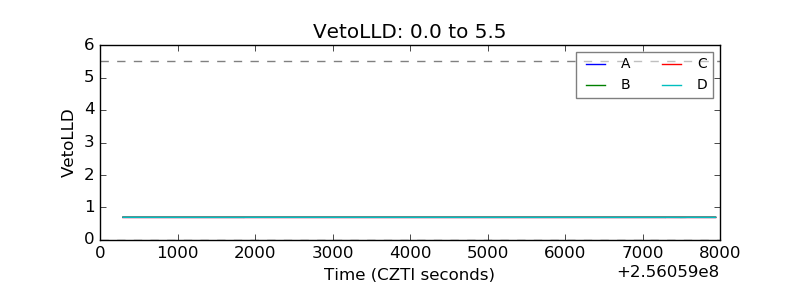 |
| Alpha Counter | 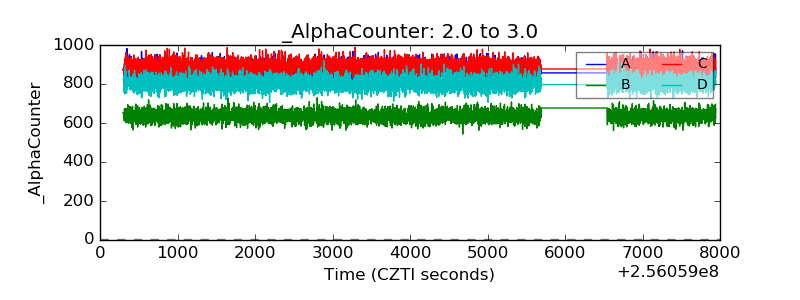 |
| _CPM_Rate | 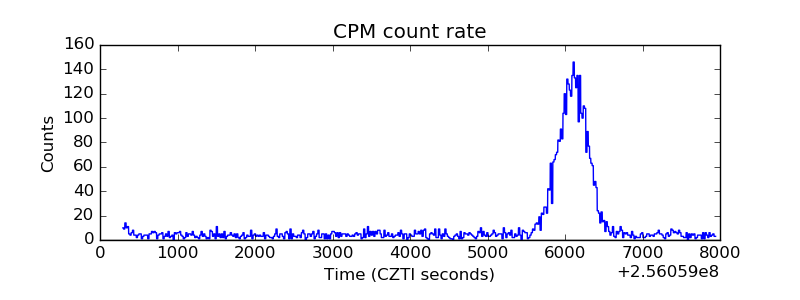 |
| CZT Counter | 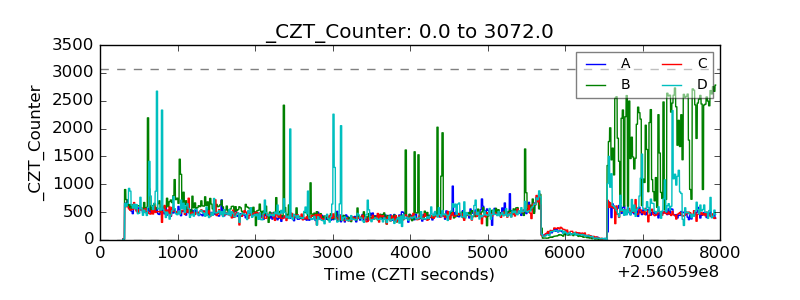 |
| +2.5 Volts monitor | 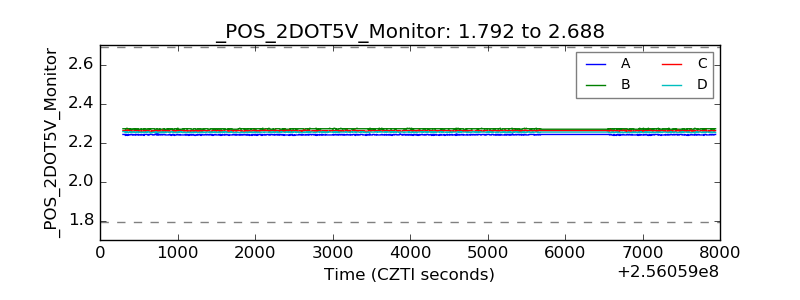 |
| +5 Volts monitor |  |
| _ROLL_ROT | 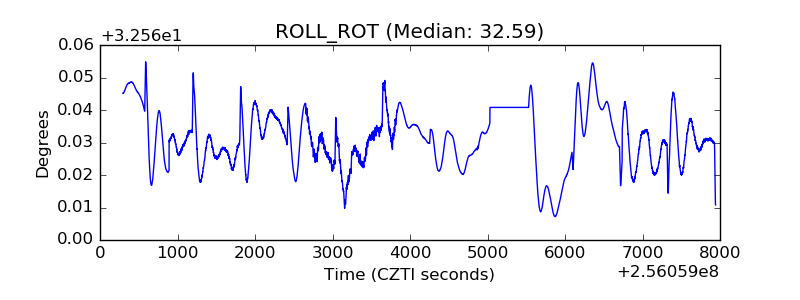 |
| _Roll_DEC | 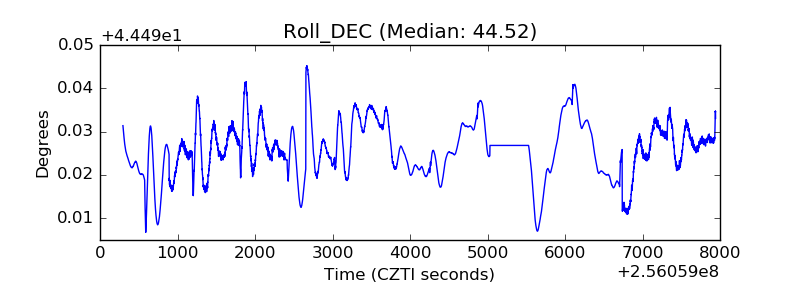 |
| _Roll_RA | 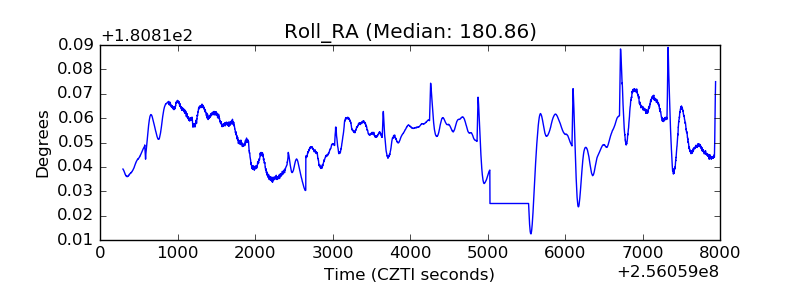 |
| Veto Counter | 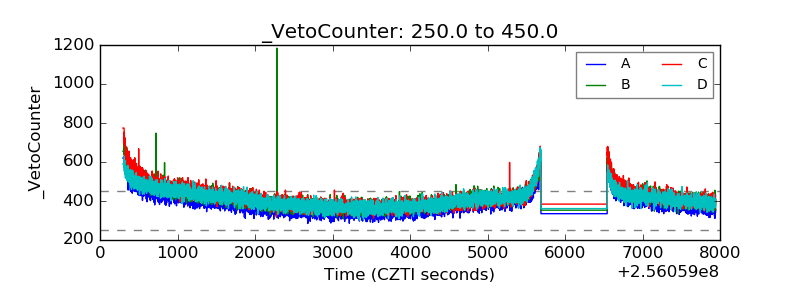 |