| Param | Original file | Final file |
|---|---|---|
| Filename | modeM0/AS1G08_071T01_9000001888_12843cztM0_level2.evt | modeM0/AS1G08_071T01_9000001888_12843cztM0_level2_quad_clean.evt |
| Size (bytes) | 526,158,720 | 104,653,440 |
| Size | 501.8 MB | 99.8 MB |
| Events in quadrant A | 3,569,225 | 666,136 |
| Events in quadrant B | 4,578,500 | 664,881 |
| Events in quadrant C | 3,473,801 | 668,382 |
| Events in quadrant D | 3,797,791 | 641,854 |
| Mode SS | |||
|---|---|---|---|
| Quadrant | BADHDUFLAG | Total packets | Discarded packets |
| A | 0 | 154 | 0 |
| B | 0 | 154 | 0 |
| C | 0 | 154 | 0 |
| D | 0 | 154 | 0 |
| Mode M9 | |||
|---|---|---|---|
| Quadrant | BADHDUFLAG | Total packets | Discarded packets |
| A | 0 | 2 | 0 |
| B | 0 | 2 | 0 |
| C | 0 | 2 | 0 |
| D | 0 | 2 | 0 |
| Mode M0 | |||
|---|---|---|---|
| Quadrant | BADHDUFLAG | Total packets | Discarded packets |
| A | 0 | 15853 | 3 |
| B | 0 | 18706 | 2 |
| C | 0 | 15664 | 2 |
| D | 0 | 16693 | 2 |
| Quadrant | Total seconds | Saturated seconds | Saturation percentage |
|---|---|---|---|
| A | 7591 | 39 | 0.513766% |
| B | 7591 | 366 | 4.821499% |
| C | 7591 | 24 | 0.316164% |
| D | 7591 | 65 | 0.856277% |
Noise dominated data is calculated using 1-second bins in cleaned event files. If a bin has >2000 counts, and if more than 50% of those come from <1% of pixels, then it is considered to be noise-dominated and hence unusable.
| Quadrant | # 1 sec bins | Bins with >0 counts | Bins with >2000 counts | High rate bins dominated by noise | Noise dominated (total time) | Noise dominated (detector-on time) | Marked lightcurve |
|---|---|---|---|---|---|---|---|
| A | 7817 | 7593 | 0 | 0 | 0.00% | 0.00% | 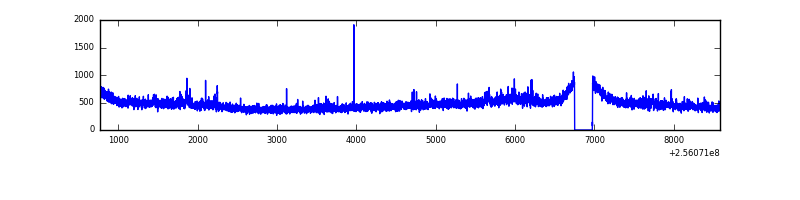 |
| B | 7817 | 7593 | 162 | 162 | 2.07% | 2.13% | 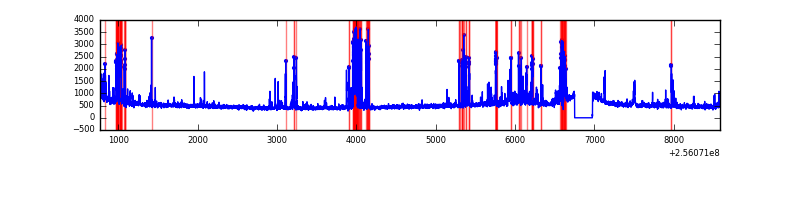 |
| C | 7817 | 7593 | 2 | 2 | 0.03% | 0.03% | 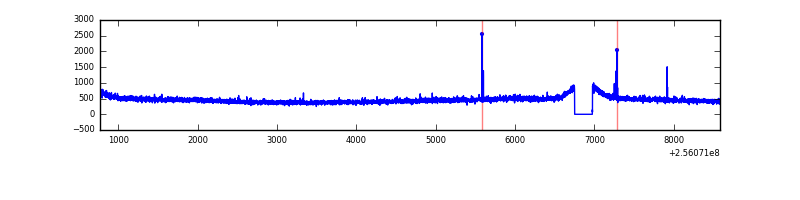 |
| D | 7817 | 7593 | 27 | 27 | 0.35% | 0.36% | 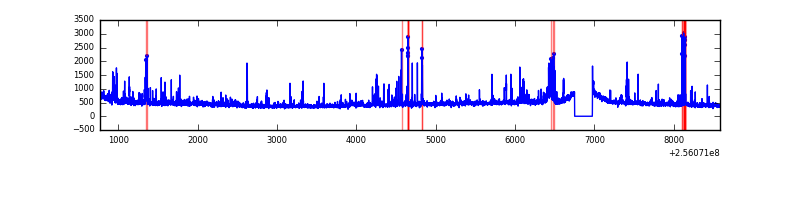 |
Top three noisy pixels from each quadrant. If the there are fewer than three noisy pixels in the level2.evt file, extra rows are filled as -1
| Pixel properties | Quadrant properties | ||||||
|---|---|---|---|---|---|---|---|
| Quadrant | DetID | PixID | Counts | Sigma | Mean | Median | Sigma |
| A | 12 | 189 | 90857 | 487.62 | 903 | 883 | 184.5 |
| A | 0 | 226 | 7865 | 37.84 | 903 | 883 | 184.5 |
| A | 12 | 194 | 6856 | 32.37 | 903 | 883 | 184.5 |
| B | 4 | 239 | 604544 | 3517.42 | 891 | 868 | 171.6 |
| B | 10 | 245 | 158469 | 918.29 | 891 | 868 | 171.6 |
| B | 0 | 219 | 107230 | 619.73 | 891 | 868 | 171.6 |
| C | 14 | 234 | 17308 | 79.95 | 885 | 888 | 205.4 |
| C | 13 | 61 | 6410 | 26.89 | 885 | 888 | 205.4 |
| C | 8 | 128 | 4514 | 17.66 | 885 | 888 | 205.4 |
| D | 1 | 52 | 196614 | 921.69 | 878 | 854 | 212.4 |
| D | 13 | 172 | 101519 | 473.96 | 878 | 854 | 212.4 |
| D | 2 | 136 | 57423 | 266.34 | 878 | 854 | 212.4 |
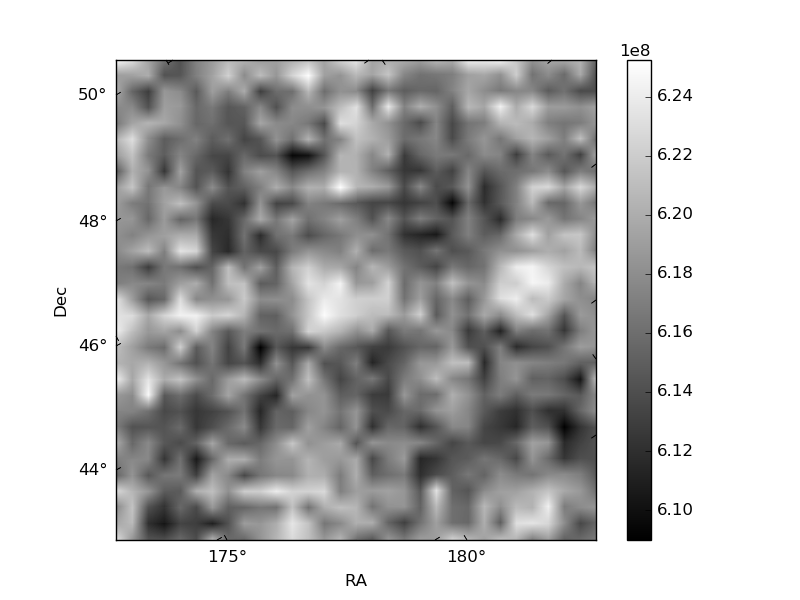
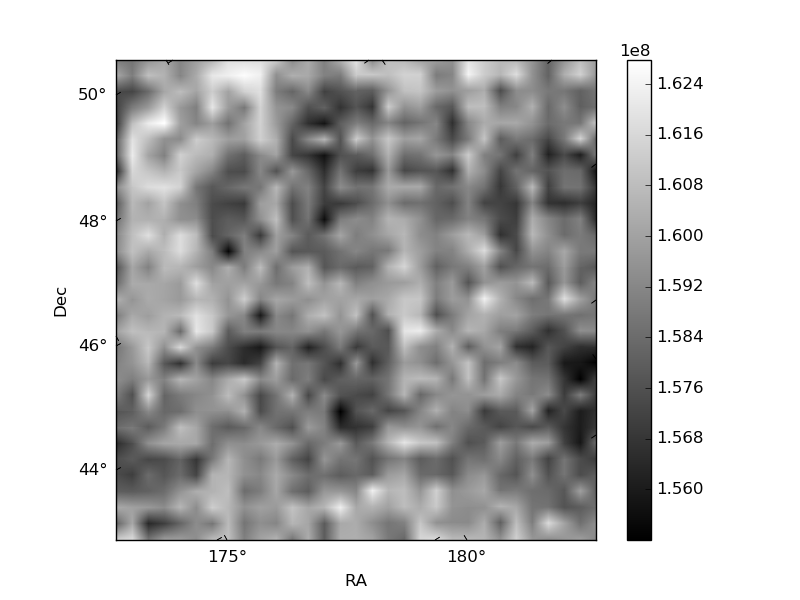
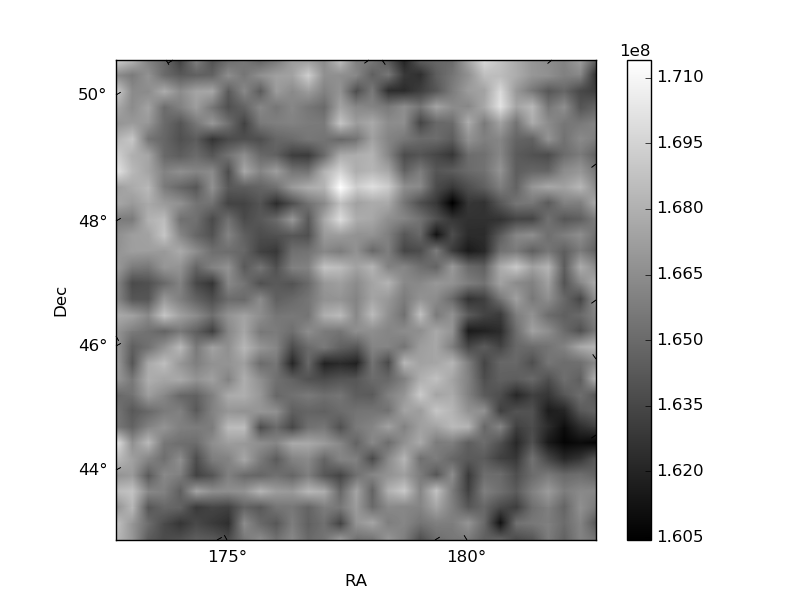
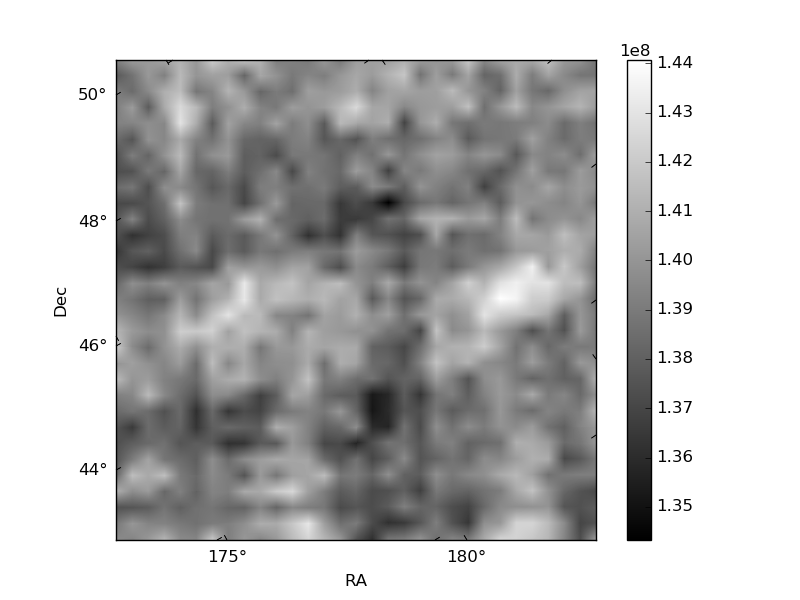
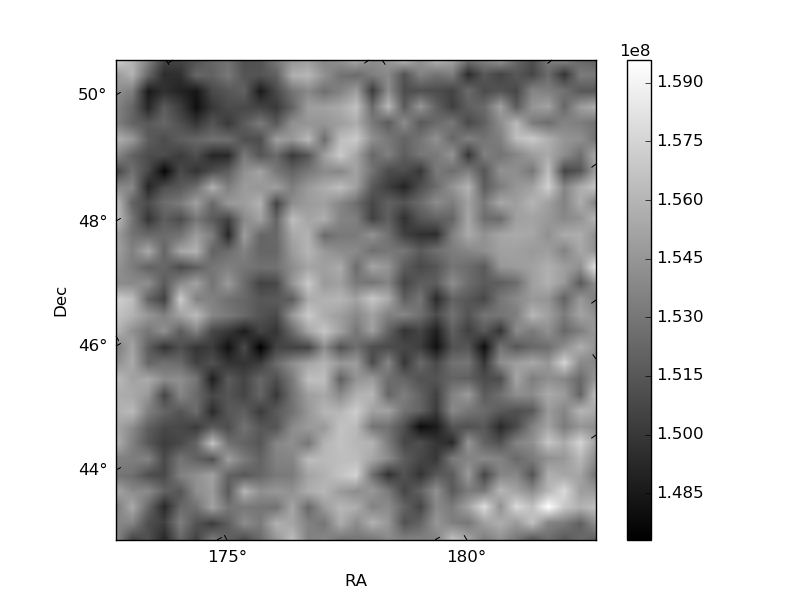
Histogram calculated using DETX and DETY for each event in the final _common_clean file
| Quadrant A | 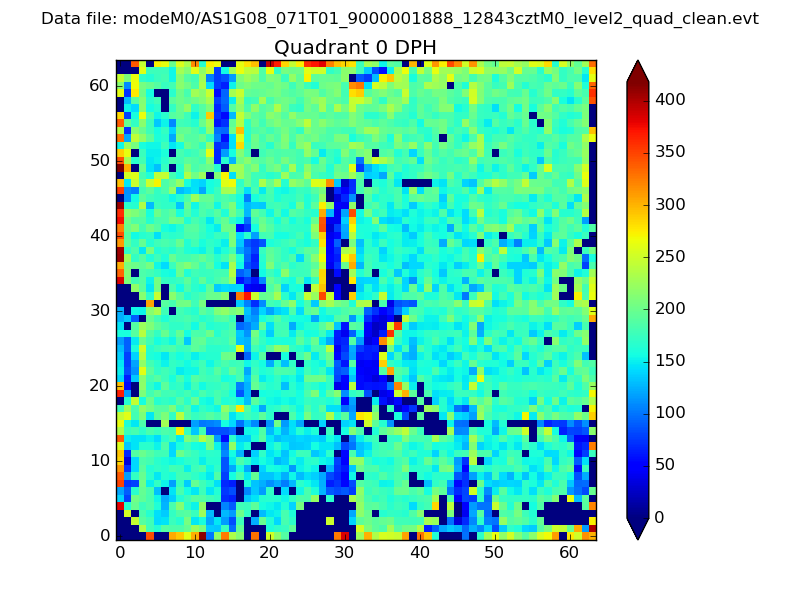 |
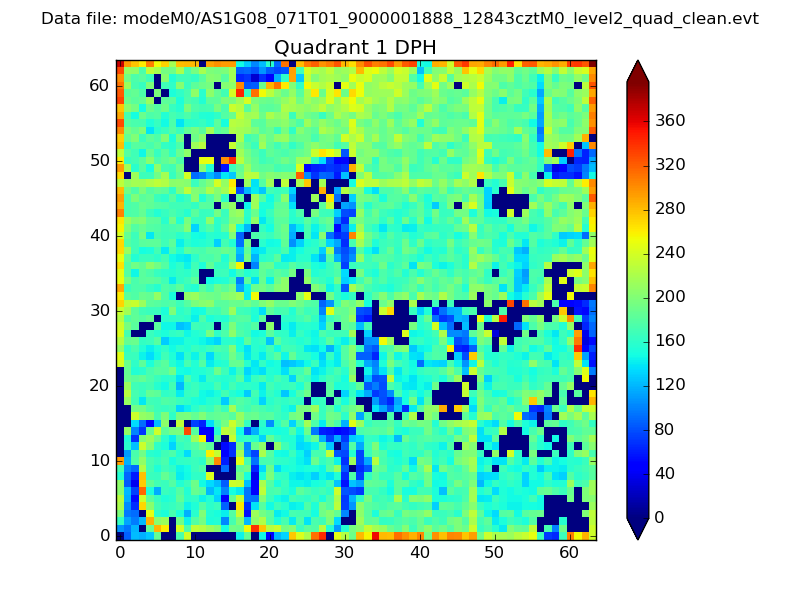 |
Quadrant B |
|---|---|---|---|
| Quadrant D | 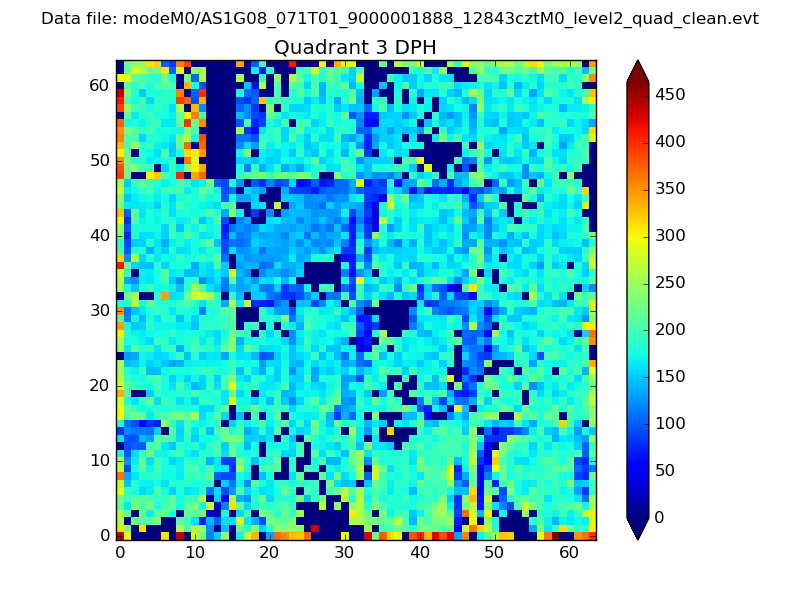 |
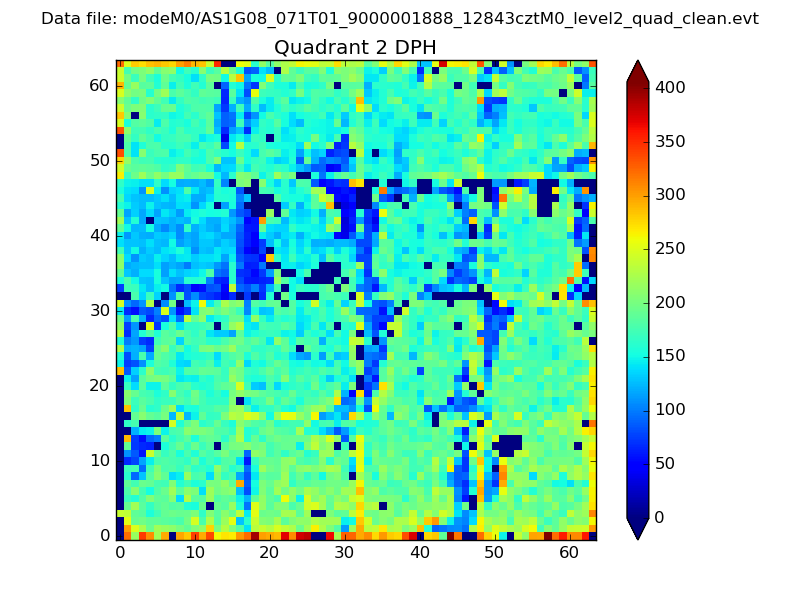 |
Quadrant C |
| Plot type | Count rate plots | Images |
|---|---|---|
| Comparison with Poisson distribution Blue bars denote a histogram of data divided into 1 sec bins. Red curve is a Poisson curve with rate = median count rate of data. |
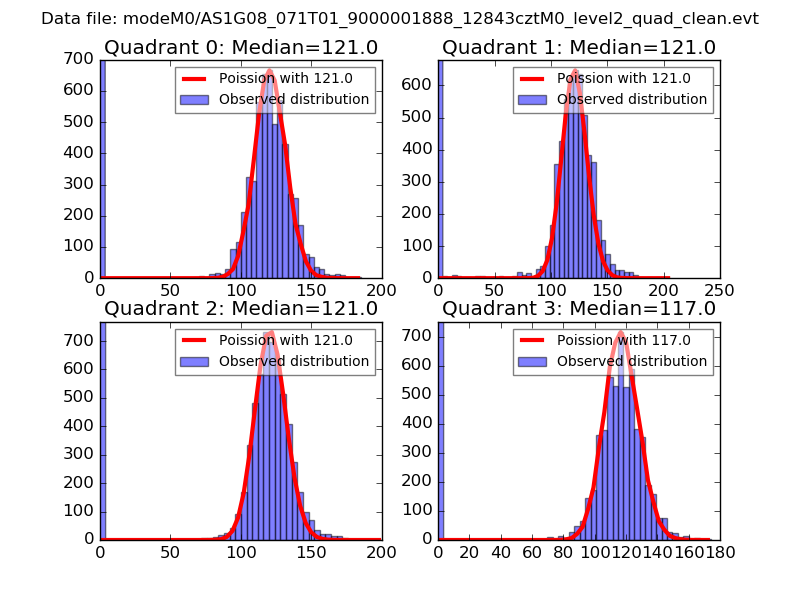 |
 |
| Quadrant-wise count rates Data is divided into 100 sec bins |
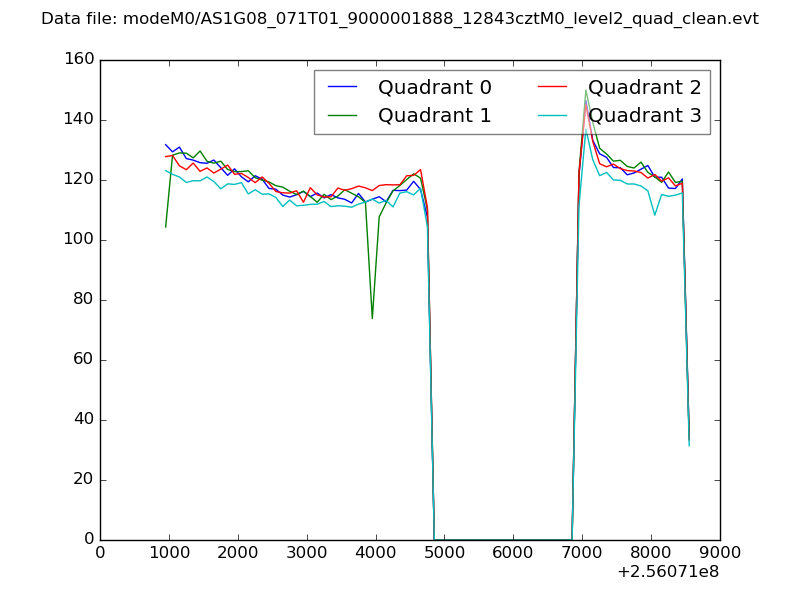 |
|
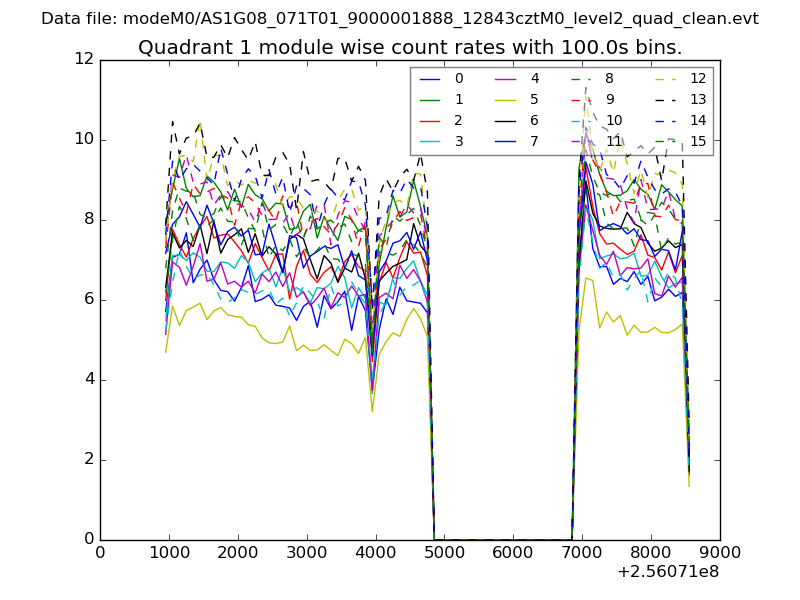
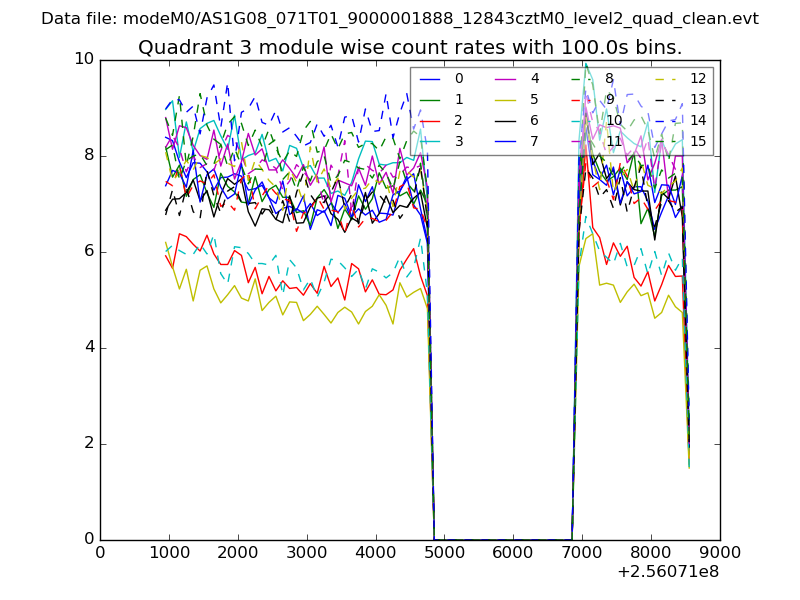
| Module-wise count rates for Quadrant A Data is divided into 100 sec bins |
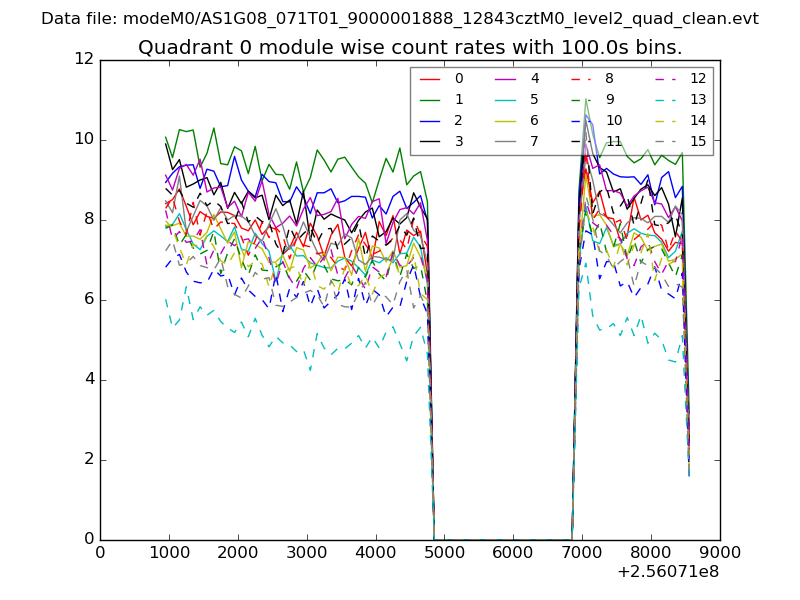 |
 |
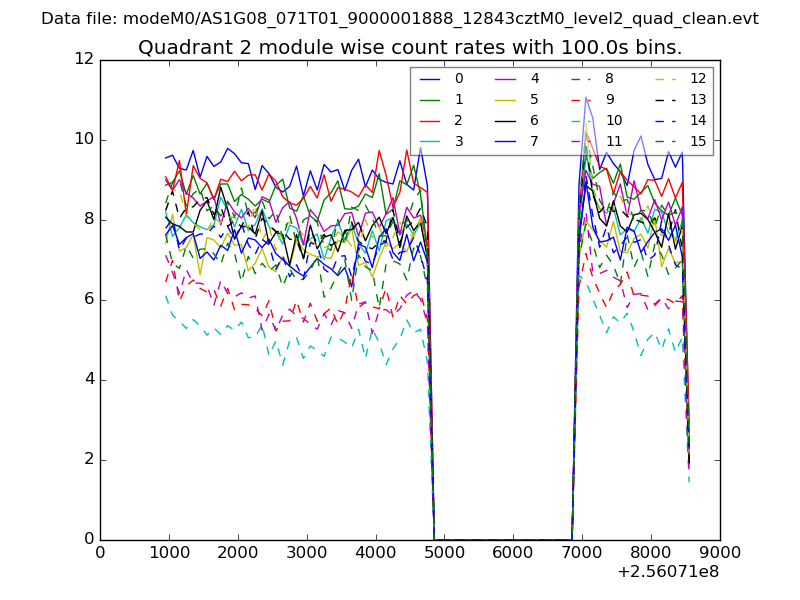
| Module-wise count rates for Quadrant B Data is divided into 100 sec bins |
 |
 |
| Module-wise count rates for Quadrant C Data is divided into 100 sec bins |
 |
 |
| Module-wise count rates for Quadrant D Data is divided into 100 sec bins |
 |
 |
| Parameter | Plot |
|---|---|
| CZT HV Monitor | 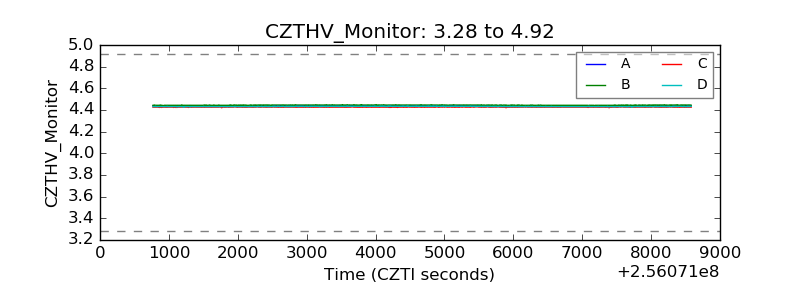 |
| D_VDD | 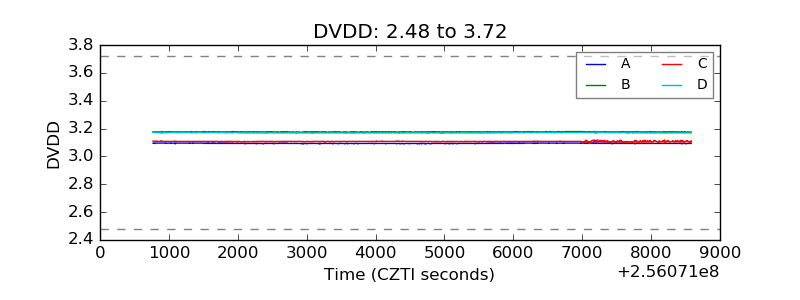 |
| Temperature 1 | 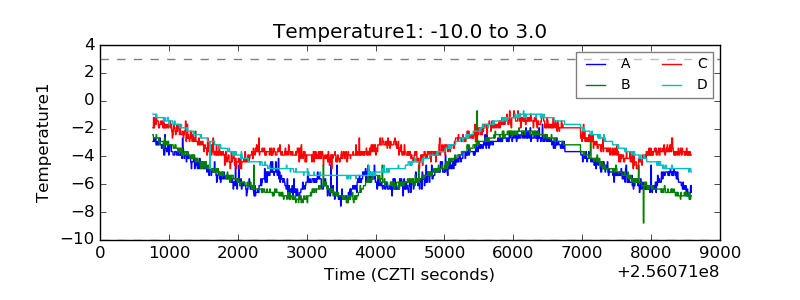 |
| Veto HV Monitor | 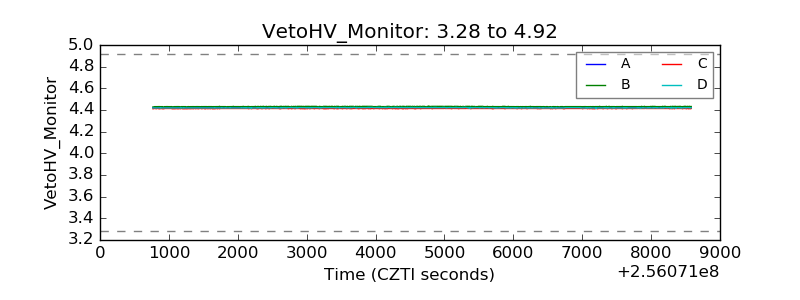 |
| Veto LLD | 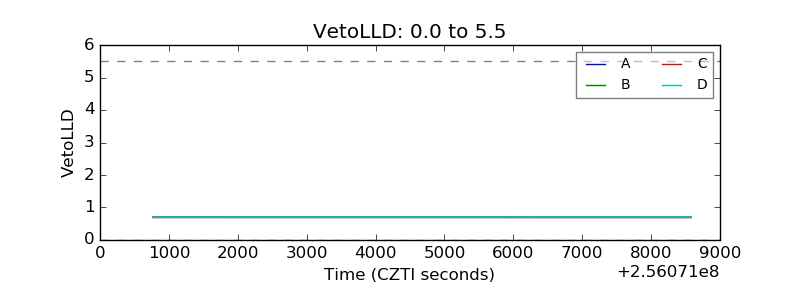 |
| Alpha Counter | 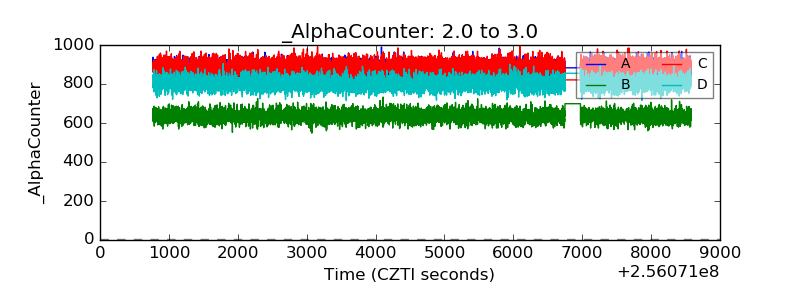 |
| _CPM_Rate | 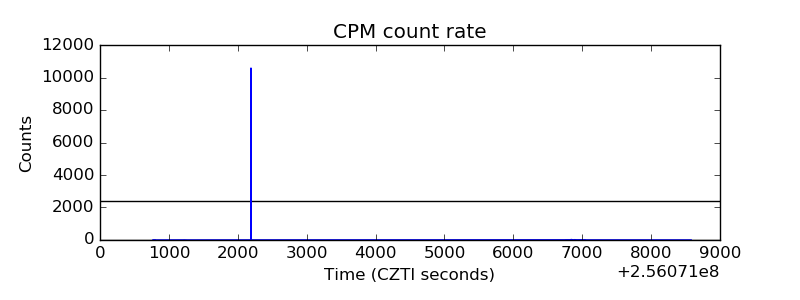 |
| CZT Counter | 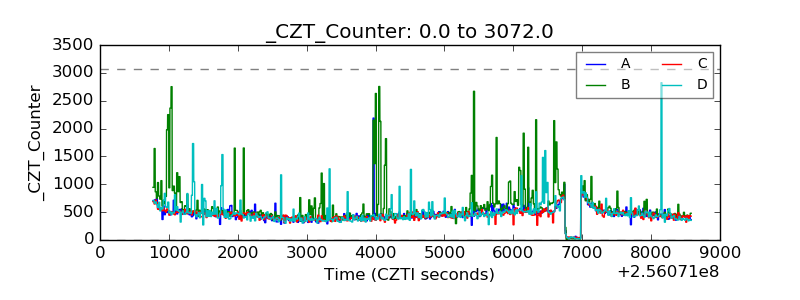 |
| +2.5 Volts monitor |  |
| +5 Volts monitor |  |
| _ROLL_ROT | 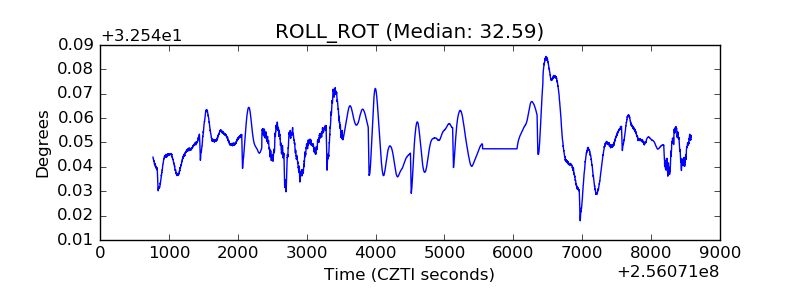 |
| _Roll_DEC | 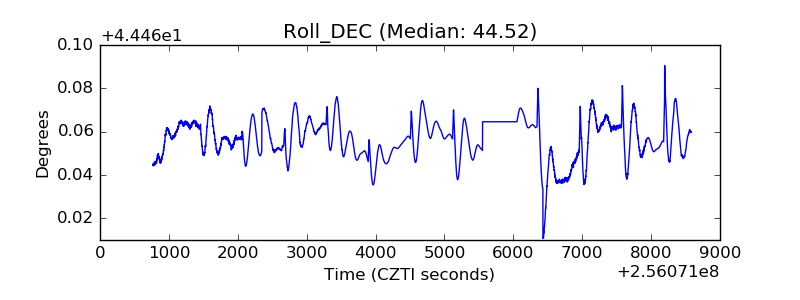 |
| _Roll_RA | 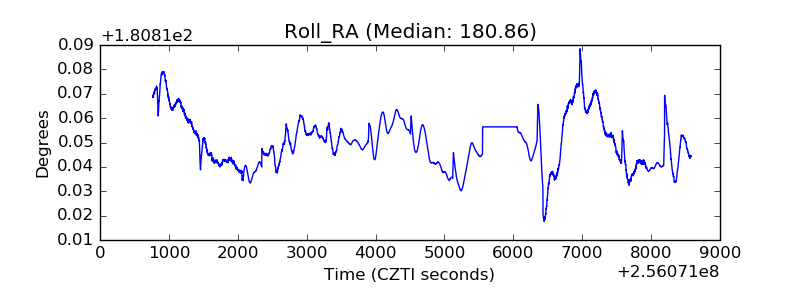 |
| Veto Counter | 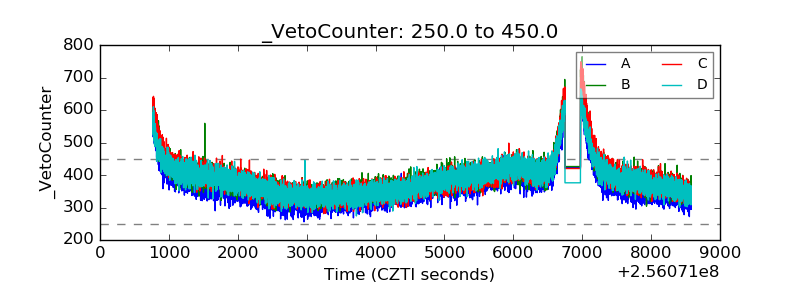 |