| Param | Original file | Final file |
|---|---|---|
| Filename | modeM0/AS1G08_071T01_9000001888_12844cztM0_level2.evt | modeM0/AS1G08_071T01_9000001888_12844cztM0_level2_quad_clean.evt |
| Size (bytes) | 669,867,840 | 106,269,120 |
| Size | 638.8 MB | 101.3 MB |
| Events in quadrant A | 4,198,732 | 669,132 |
| Events in quadrant B | 5,417,040 | 670,577 |
| Events in quadrant C | 3,832,104 | 675,820 |
| Events in quadrant D | 6,283,167 | 632,264 |
| Mode SS | |||
|---|---|---|---|
| Quadrant | BADHDUFLAG | Total packets | Discarded packets |
| A | 0 | 168 | 0 |
| B | 0 | 168 | 0 |
| C | 0 | 168 | 0 |
| D | 0 | 168 | 0 |
| Mode M9 | |||
|---|---|---|---|
| Quadrant | BADHDUFLAG | Total packets | Discarded packets |
| A | 0 | 6 | 0 |
| B | 0 | 6 | 0 |
| C | 0 | 6 | 0 |
| D | 0 | 6 | 0 |
| Mode M0 | |||
|---|---|---|---|
| Quadrant | BADHDUFLAG | Total packets | Discarded packets |
| A | 0 | 17909 | 3 |
| B | 0 | 21690 | 2 |
| C | 0 | 17119 | 2 |
| D | 0 | 24509 | 2 |
| Quadrant | Total seconds | Saturated seconds | Saturation percentage |
|---|---|---|---|
| A | 8209 | 58 | 0.706542% |
| B | 8209 | 467 | 5.688878% |
| C | 8209 | 37 | 0.450725% |
| D | 8209 | 562 | 6.846144% |
Noise dominated data is calculated using 1-second bins in cleaned event files. If a bin has >2000 counts, and if more than 50% of those come from <1% of pixels, then it is considered to be noise-dominated and hence unusable.
| Quadrant | # 1 sec bins | Bins with >0 counts | Bins with >2000 counts | High rate bins dominated by noise | Noise dominated (total time) | Noise dominated (detector-on time) | Marked lightcurve |
|---|---|---|---|---|---|---|---|
| A | 8765 | 8212 | 0 | 0 | 0.00% | 0.00% | 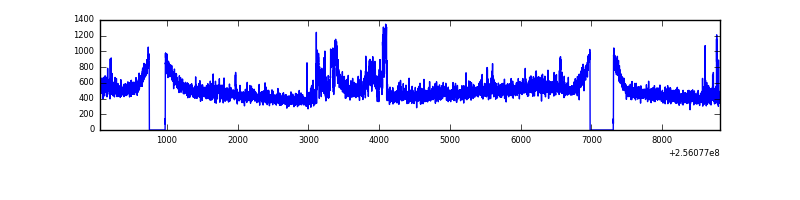 |
| B | 8765 | 8212 | 217 | 217 | 2.48% | 2.64% | 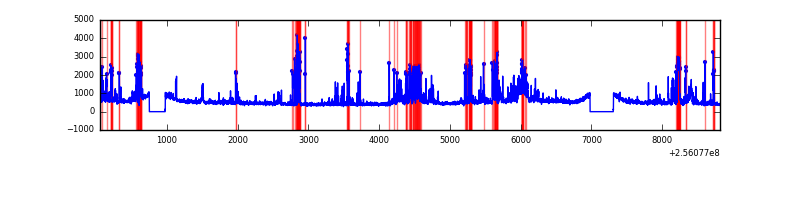 |
| C | 8765 | 8212 | 1 | 1 | 0.01% | 0.01% | 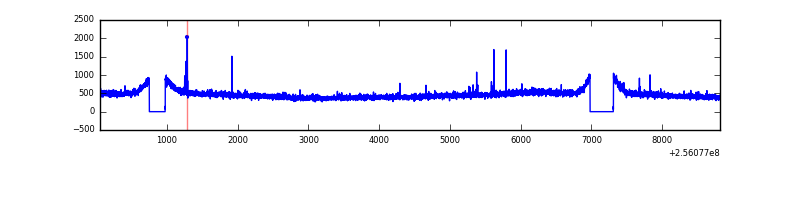 |
| D | 8765 | 8212 | 464 | 464 | 5.29% | 5.65% | 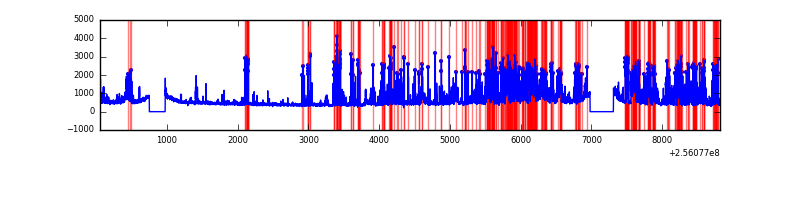 |
Top three noisy pixels from each quadrant. If the there are fewer than three noisy pixels in the level2.evt file, extra rows are filled as -1
| Pixel properties | Quadrant properties | ||||||
|---|---|---|---|---|---|---|---|
| Quadrant | DetID | PixID | Counts | Sigma | Mean | Median | Sigma |
| A | 12 | 189 | 387529 | 1914.89 | 989 | 967 | 201.9 |
| A | 8 | 15 | 10421 | 46.83 | 989 | 967 | 201.9 |
| A | 0 | 226 | 8909 | 39.34 | 989 | 967 | 201.9 |
| B | 4 | 239 | 895537 | 4742.83 | 978 | 953 | 188.6 |
| B | 0 | 85 | 413470 | 2187.05 | 978 | 953 | 188.6 |
| B | 0 | 219 | 98289 | 516.05 | 978 | 953 | 188.6 |
| C | 14 | 234 | 22123 | 93.85 | 972 | 974 | 225.4 |
| C | 8 | 128 | 12632 | 51.73 | 972 | 974 | 225.4 |
| C | 13 | 61 | 7033 | 26.88 | 972 | 974 | 225.4 |
| D | 1 | 52 | 1847899 | 8084.32 | 942 | 912 | 228.5 |
| D | 4 | 95 | 587621 | 2568.04 | 942 | 912 | 228.5 |
| D | 13 | 172 | 192621 | 839.12 | 942 | 912 | 228.5 |
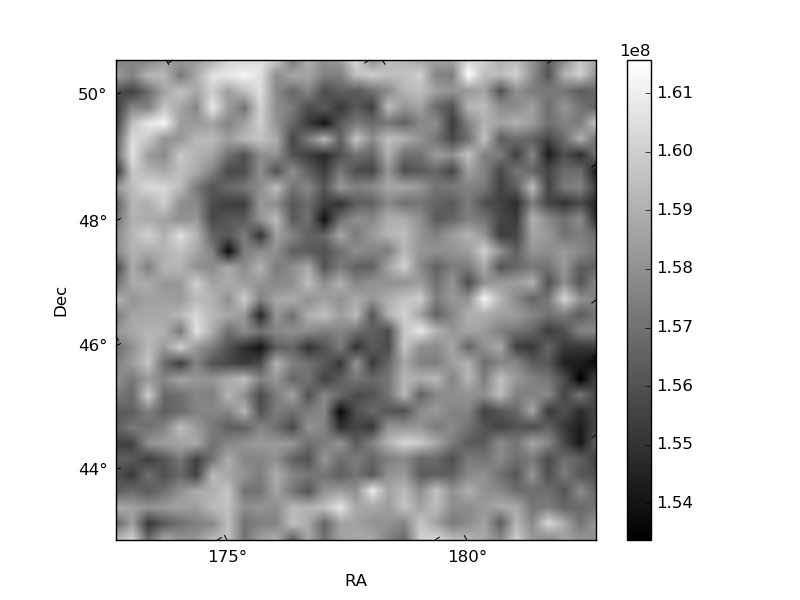
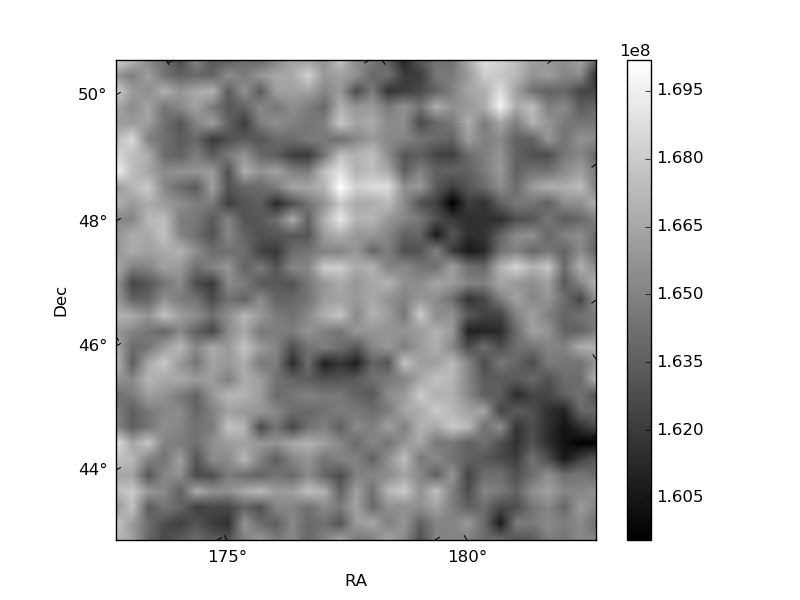
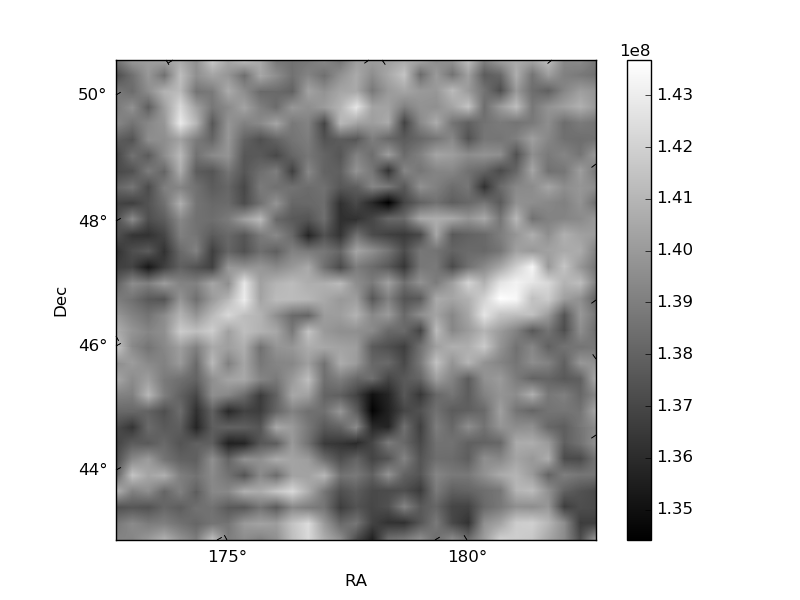
Histogram calculated using DETX and DETY for each event in the final _common_clean file
| Quadrant A |  |
 |
Quadrant B |
|---|---|---|---|
| Quadrant D |  |
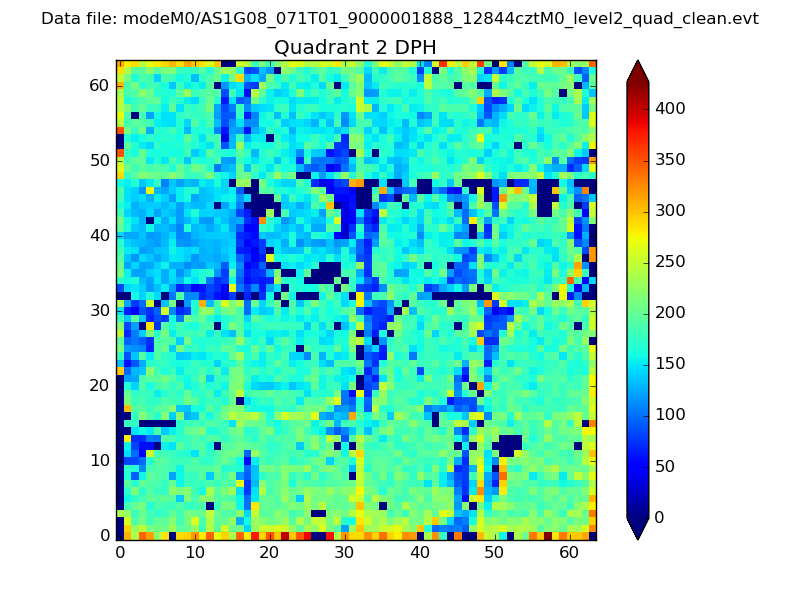 |
Quadrant C |
| Plot type | Count rate plots | Images |
|---|---|---|
| Comparison with Poisson distribution Blue bars denote a histogram of data divided into 1 sec bins. Red curve is a Poisson curve with rate = median count rate of data. |
 |
 |
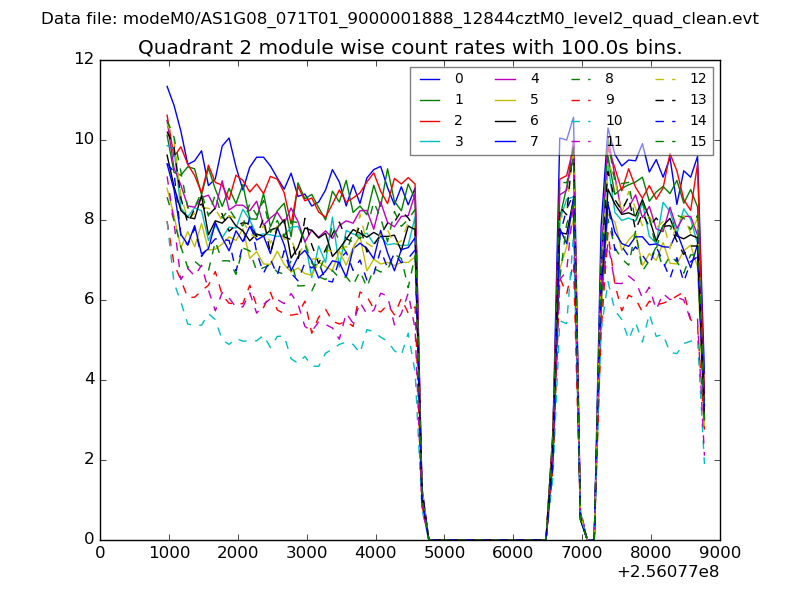
| Quadrant-wise count rates Data is divided into 100 sec bins |
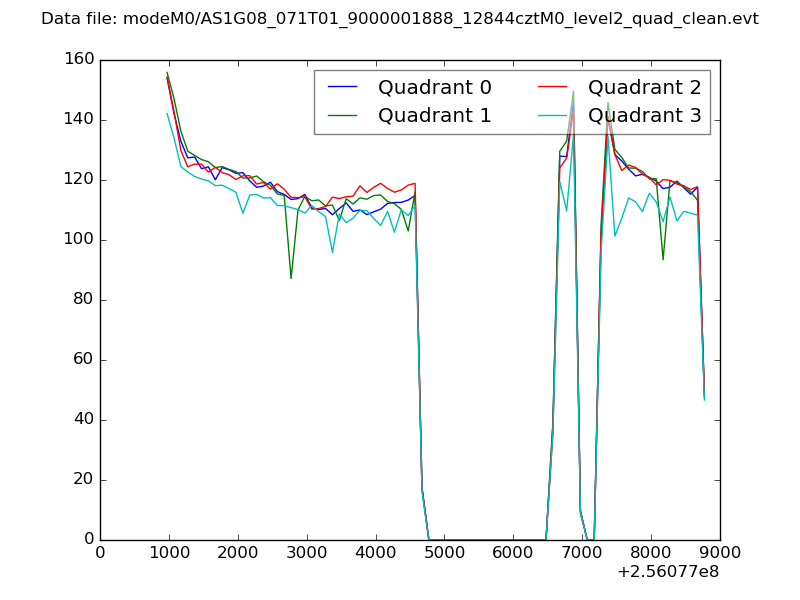 |
|
| Module-wise count rates for Quadrant A Data is divided into 100 sec bins |
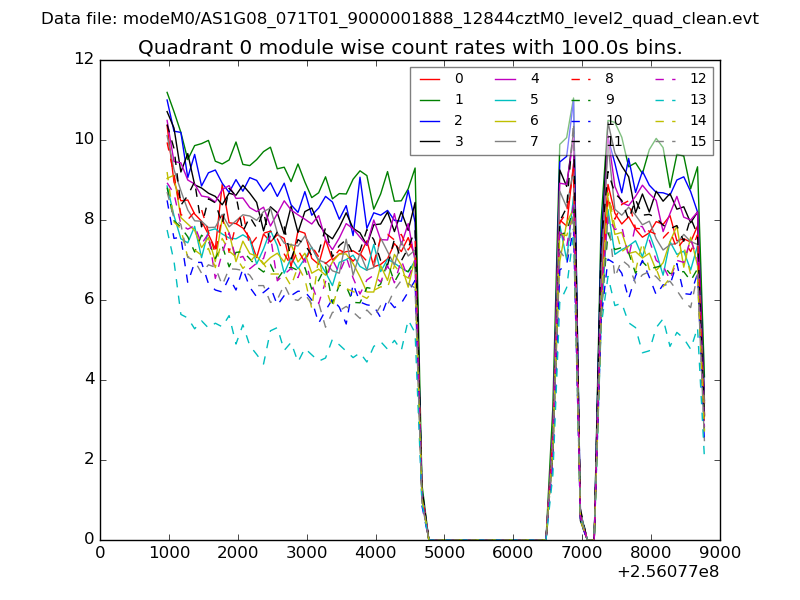 |
 |
| Module-wise count rates for Quadrant B Data is divided into 100 sec bins |
 |
 |
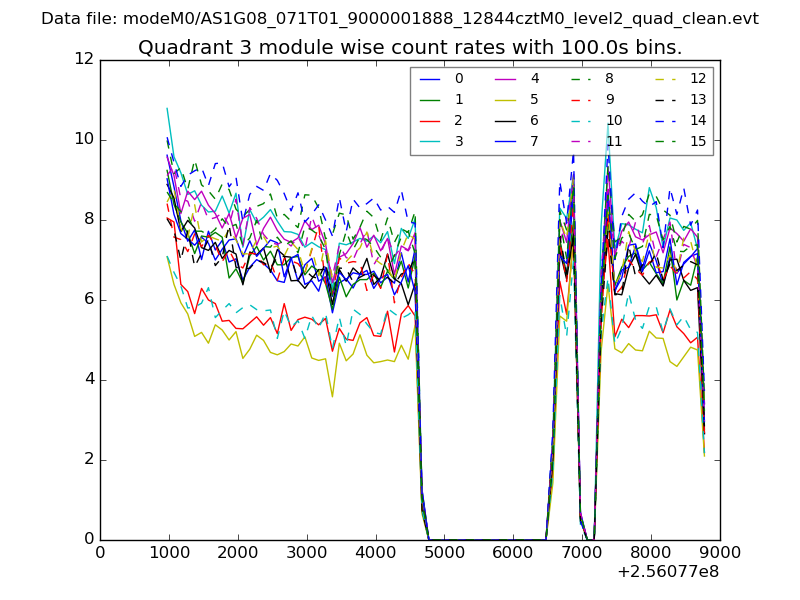
| Module-wise count rates for Quadrant C Data is divided into 100 sec bins |
 |
 |
| Module-wise count rates for Quadrant D Data is divided into 100 sec bins |
 |
 |
| Parameter | Plot |
|---|---|
| CZT HV Monitor | 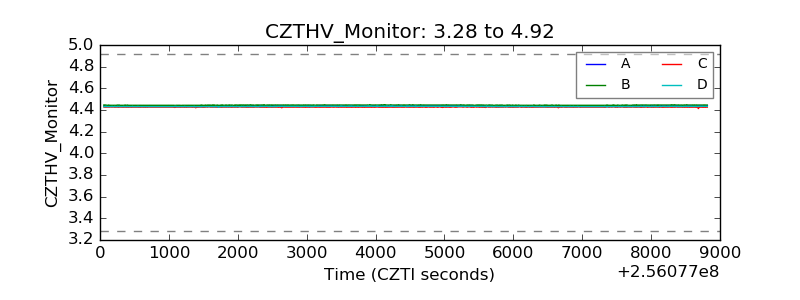 |
| D_VDD | 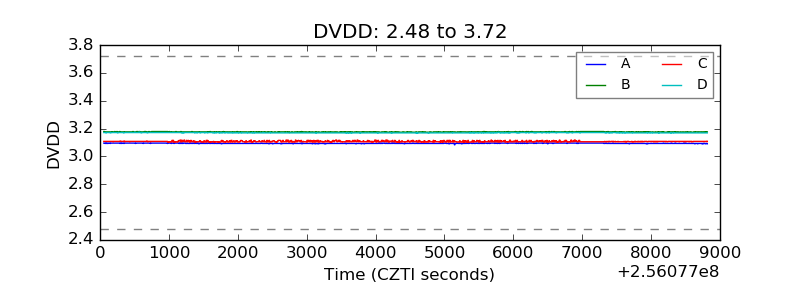 |
| Temperature 1 | 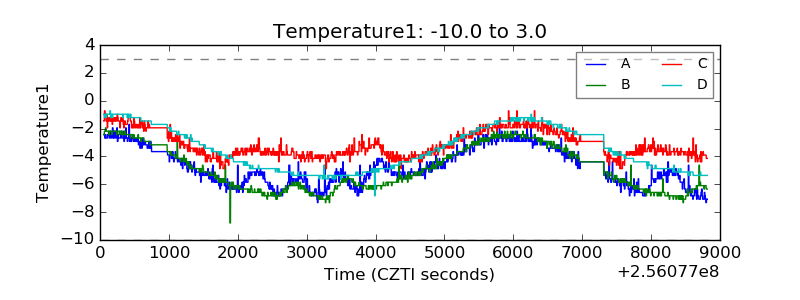 |
| Veto HV Monitor | 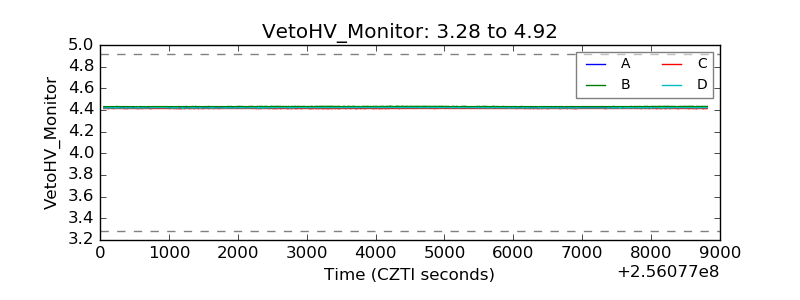 |
| Veto LLD | 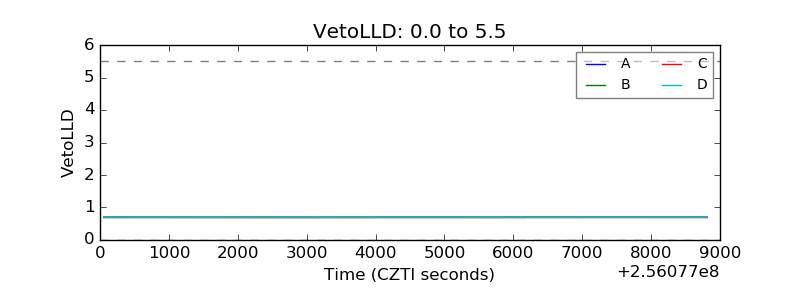 |
| Alpha Counter | 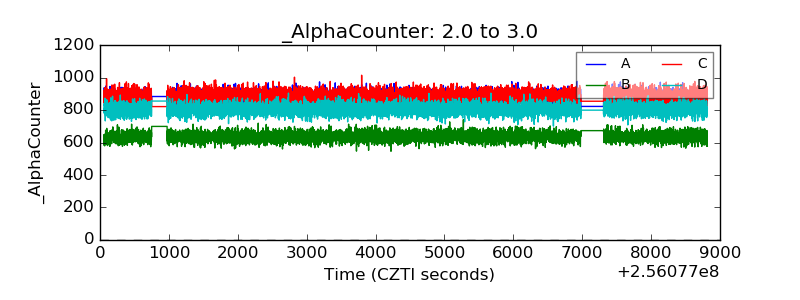 |
| _CPM_Rate | 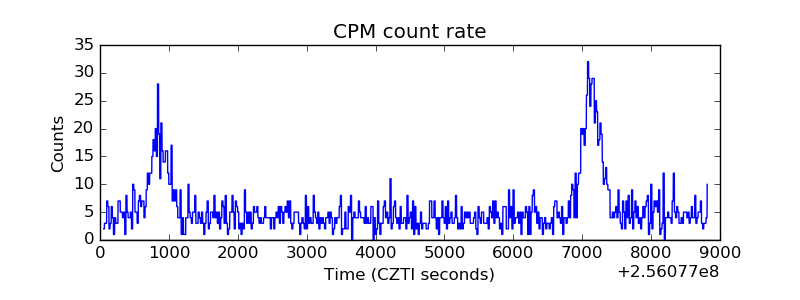 |
| CZT Counter | 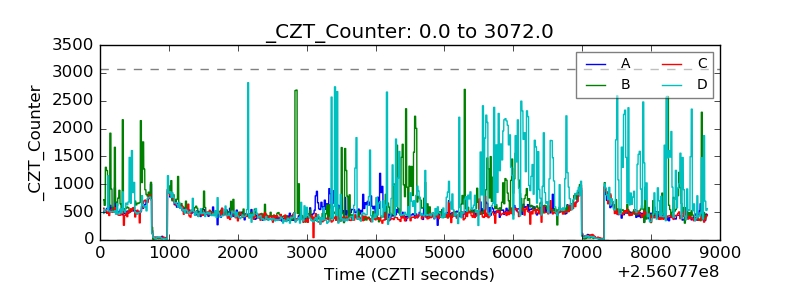 |
| +2.5 Volts monitor |  |
| +5 Volts monitor |  |
| _ROLL_ROT | 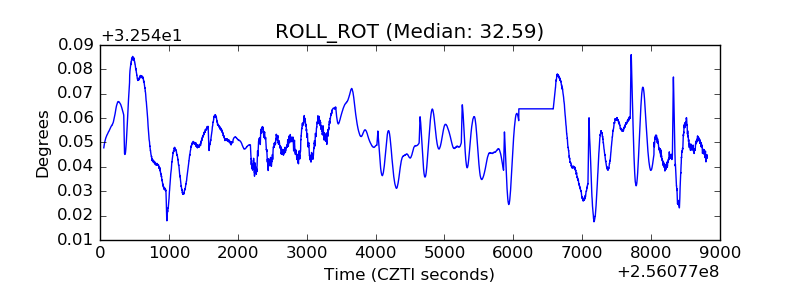 |
| _Roll_DEC | 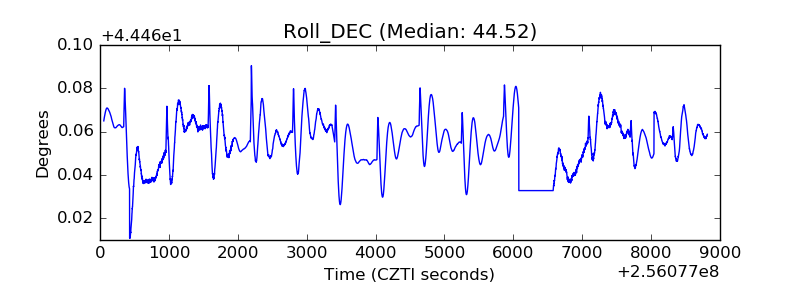 |
| _Roll_RA | 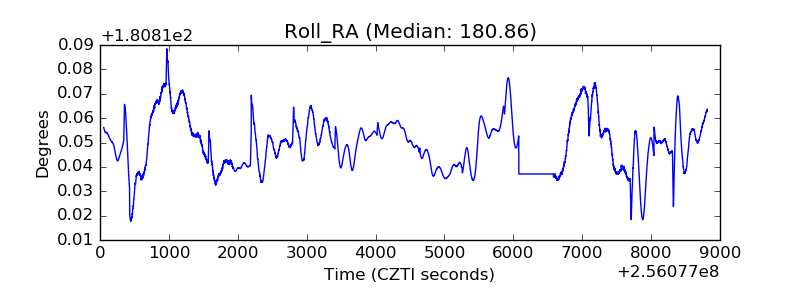 |
| Veto Counter | 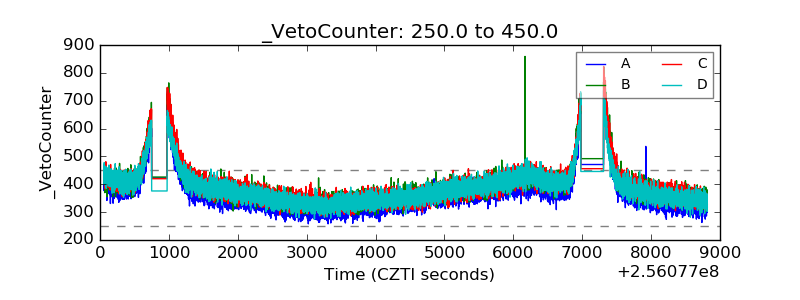 |