| Param | Original file | Final file |
|---|---|---|
| Filename | modeM0/AS1G08_071T01_9000001888_12846cztM0_level2.evt | modeM0/AS1G08_071T01_9000001888_12846cztM0_level2_quad_clean.evt |
| Size (bytes) | 972,037,440 | 177,960,960 |
| Size | 927.0 MB | 169.7 MB |
| Events in quadrant A | 6,093,748 | 1,126,265 |
| Events in quadrant B | 7,695,438 | 1,130,493 |
| Events in quadrant C | 6,006,418 | 1,136,325 |
| Events in quadrant D | 8,738,036 | 1,073,238 |
| Mode SS | |||
|---|---|---|---|
| Quadrant | BADHDUFLAG | Total packets | Discarded packets |
| A | 0 | 274 | 0 |
| B | 0 | 274 | 0 |
| C | 0 | 274 | 0 |
| D | 0 | 274 | 0 |
| Mode M9 | |||
|---|---|---|---|
| Quadrant | BADHDUFLAG | Total packets | Discarded packets |
| A | 0 | 16 | 0 |
| B | 0 | 16 | 0 |
| C | 0 | 16 | 0 |
| D | 0 | 16 | 0 |
| Mode M0 | |||
|---|---|---|---|
| Quadrant | BADHDUFLAG | Total packets | Discarded packets |
| A | 0 | 27494 | 4 |
| B | 0 | 31873 | 3 |
| C | 0 | 27510 | 3 |
| D | 0 | 35888 | 3 |
| Quadrant | Total seconds | Saturated seconds | Saturation percentage |
|---|---|---|---|
| A | 13363 | 50 | 0.374167% |
| B | 13363 | 449 | 3.360024% |
| C | 13363 | 53 | 0.396618% |
| D | 13363 | 717 | 5.365562% |
Noise dominated data is calculated using 1-second bins in cleaned event files. If a bin has >2000 counts, and if more than 50% of those come from <1% of pixels, then it is considered to be noise-dominated and hence unusable.
| Quadrant | # 1 sec bins | Bins with >0 counts | Bins with >2000 counts | High rate bins dominated by noise | Noise dominated (total time) | Noise dominated (detector-on time) | Marked lightcurve |
|---|---|---|---|---|---|---|---|
| A | 14939 | 13367 | 0 | 0 | 0.00% | 0.00% | 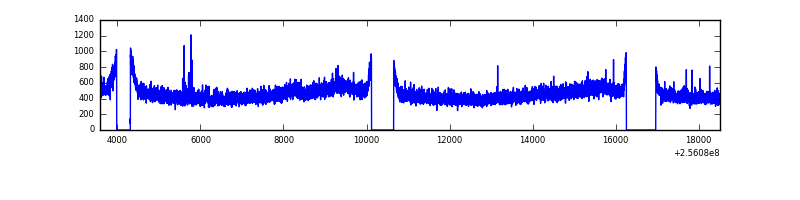 |
| B | 14939 | 13367 | 239 | 239 | 1.60% | 1.79% | 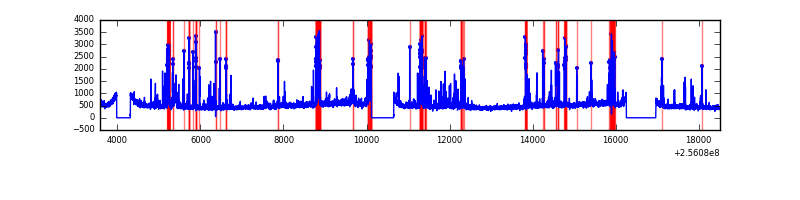 |
| C | 14939 | 13367 | 17 | 17 | 0.11% | 0.13% | 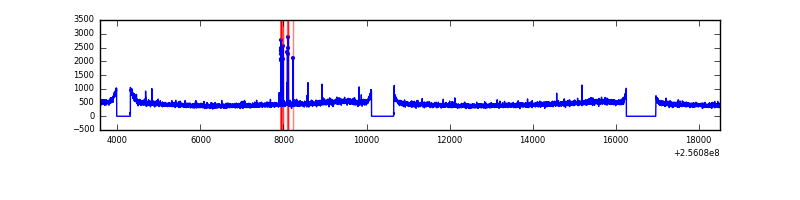 |
| D | 14939 | 13367 | 639 | 639 | 4.28% | 4.78% | 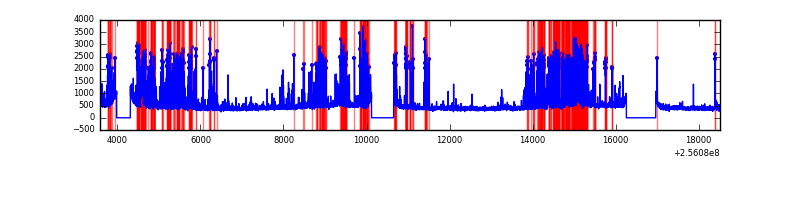 |
Top three noisy pixels from each quadrant. If the there are fewer than three noisy pixels in the level2.evt file, extra rows are filled as -1
| Pixel properties | Quadrant properties | ||||||
|---|---|---|---|---|---|---|---|
| Quadrant | DetID | PixID | Counts | Sigma | Mean | Median | Sigma |
| A | 12 | 189 | 100803 | 314.0 | 1555 | 1516 | 316.2 |
| A | 14 | 250 | 15930 | 45.58 | 1555 | 1516 | 316.2 |
| A | 0 | 226 | 13670 | 38.44 | 1555 | 1516 | 316.2 |
| B | 4 | 239 | 889499 | 2996.81 | 1546 | 1509 | 296.3 |
| B | 0 | 85 | 427856 | 1438.85 | 1546 | 1509 | 296.3 |
| B | 0 | 219 | 155528 | 519.79 | 1546 | 1509 | 296.3 |
| C | 14 | 234 | 63581 | 175.32 | 1524 | 1530 | 353.9 |
| C | 13 | 61 | 11135 | 27.14 | 1524 | 1530 | 353.9 |
| C | 3 | 202 | 3905 | 6.71 | 1524 | 1530 | 353.9 |
| D | 1 | 52 | 2868571 | 8063.17 | 1477 | 1430 | 355.6 |
| D | 13 | 172 | 100102 | 277.49 | 1477 | 1430 | 355.6 |
| D | 8 | 195 | 75129 | 207.26 | 1477 | 1430 | 355.6 |
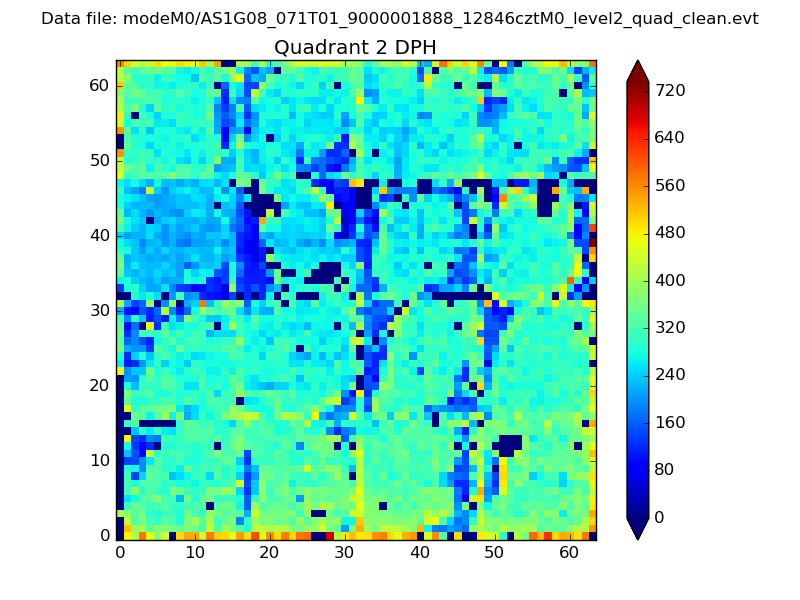
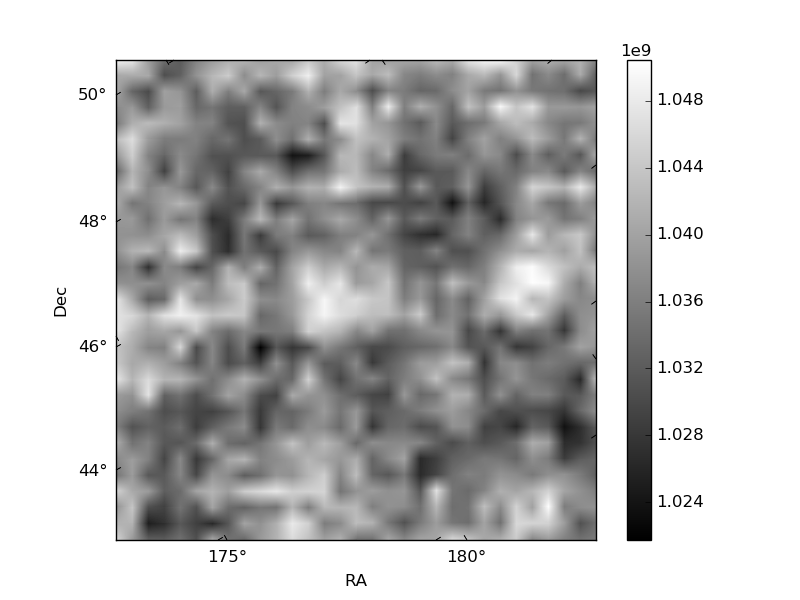
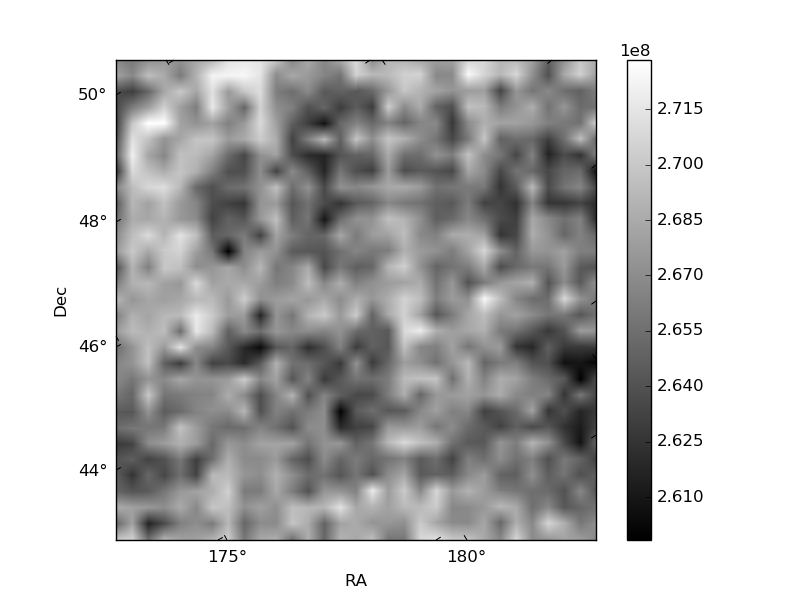
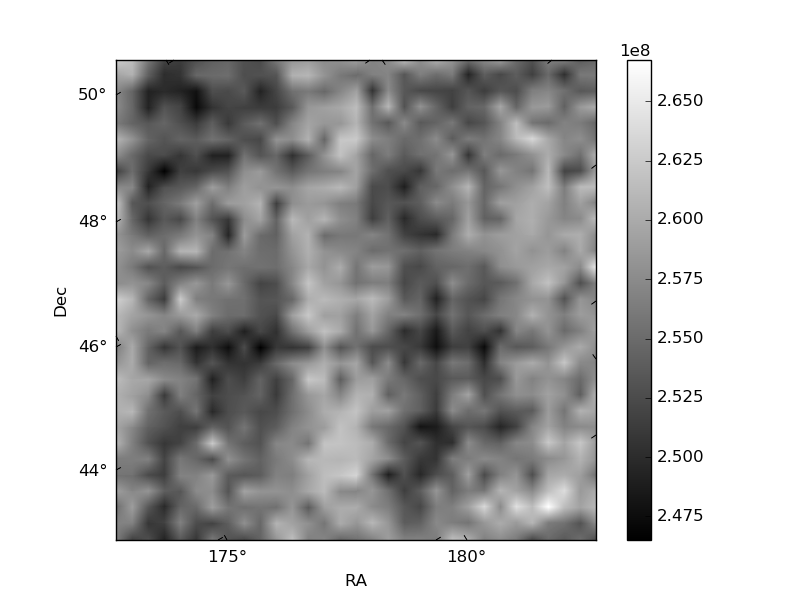
Histogram calculated using DETX and DETY for each event in the final _common_clean file
| Quadrant A | 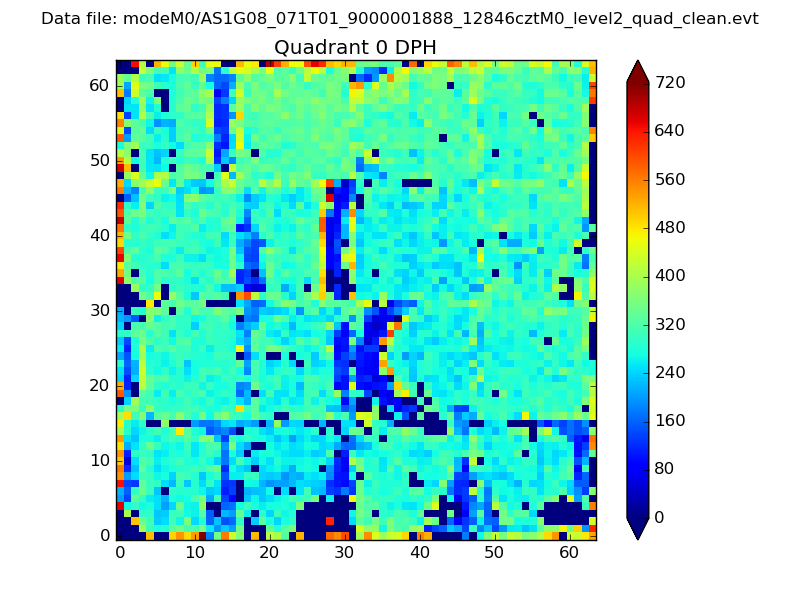 |
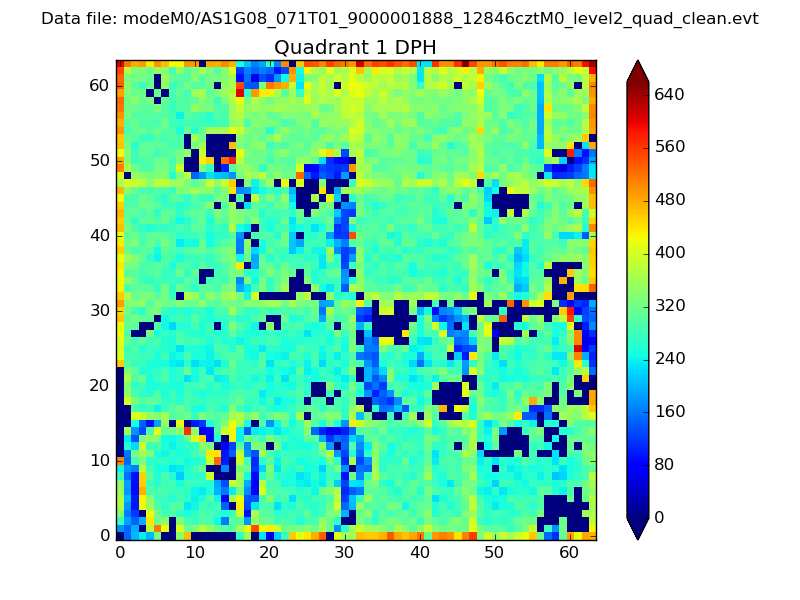 |
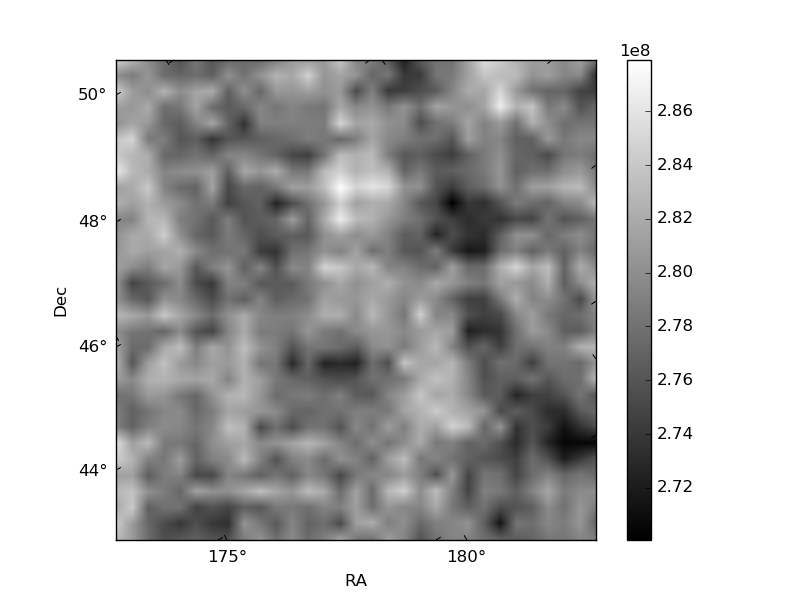
Quadrant B |
|---|---|---|---|
| Quadrant D | 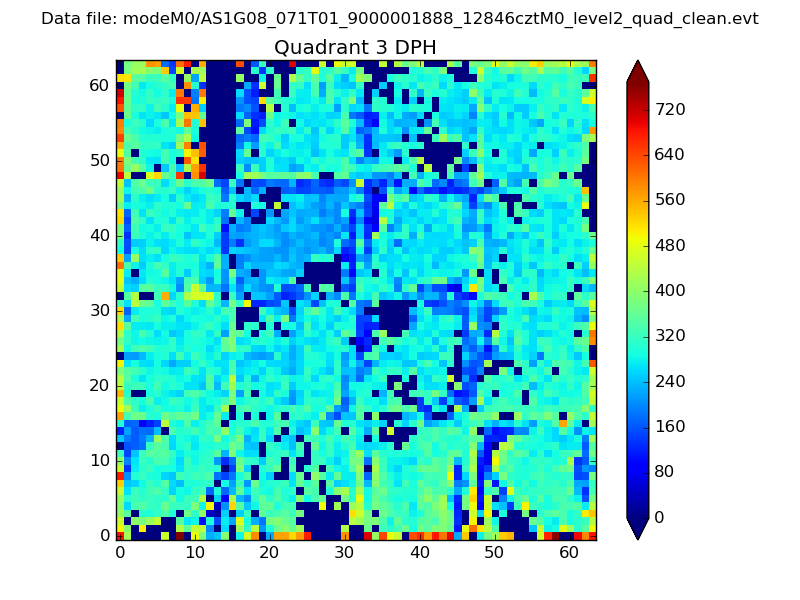 |
 |
Quadrant C |
| Plot type | Count rate plots | Images |
|---|---|---|
| Comparison with Poisson distribution Blue bars denote a histogram of data divided into 1 sec bins. Red curve is a Poisson curve with rate = median count rate of data. |
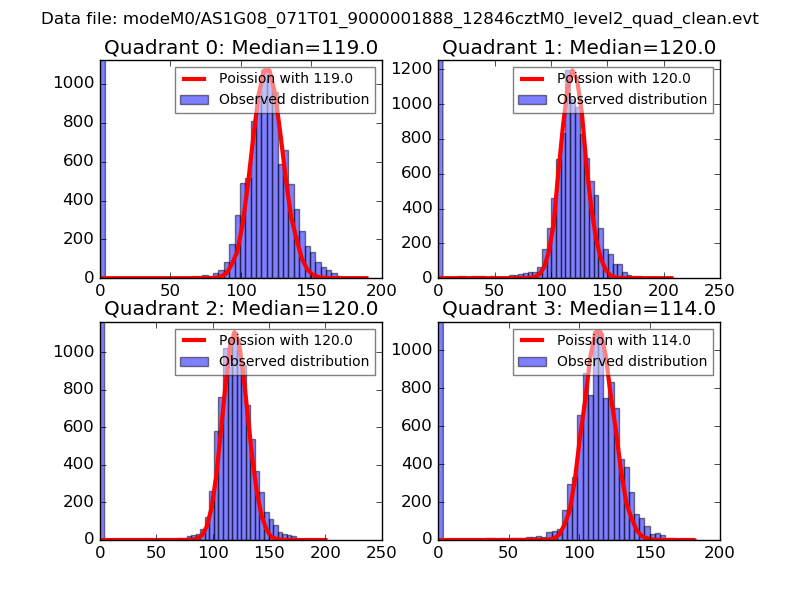 |
 |
| Quadrant-wise count rates Data is divided into 100 sec bins |
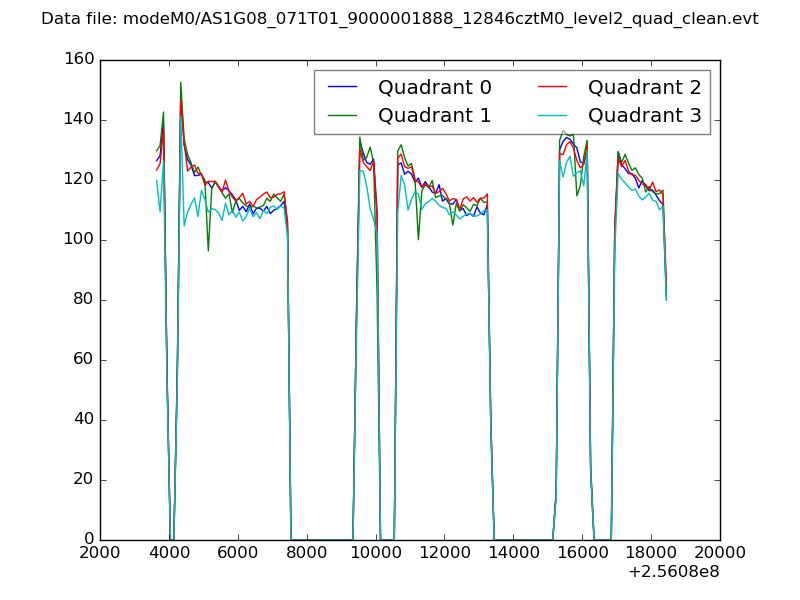 |
|
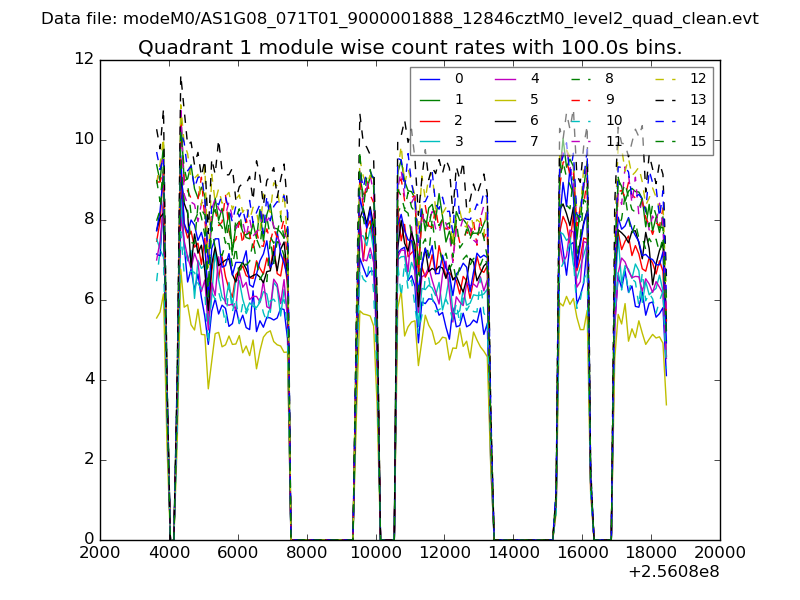
| Module-wise count rates for Quadrant A Data is divided into 100 sec bins |
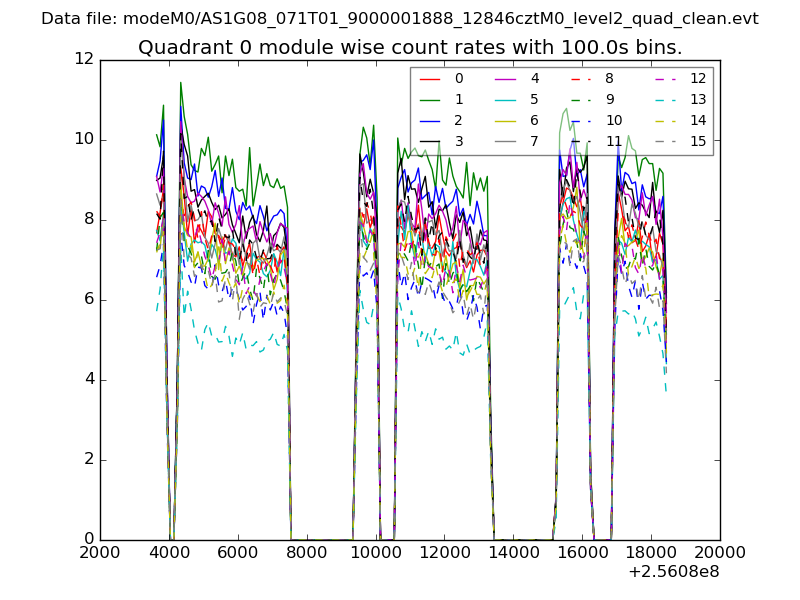 |
 |
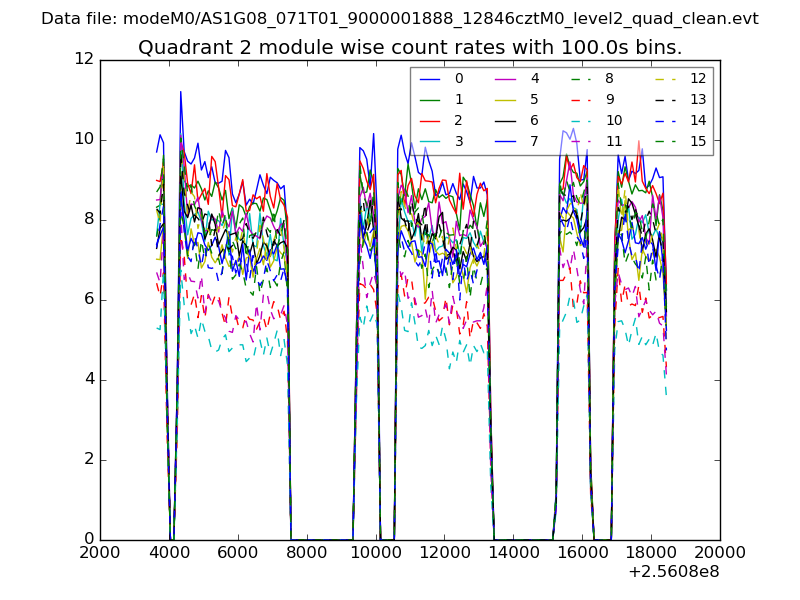
| Module-wise count rates for Quadrant B Data is divided into 100 sec bins |
 |
 |
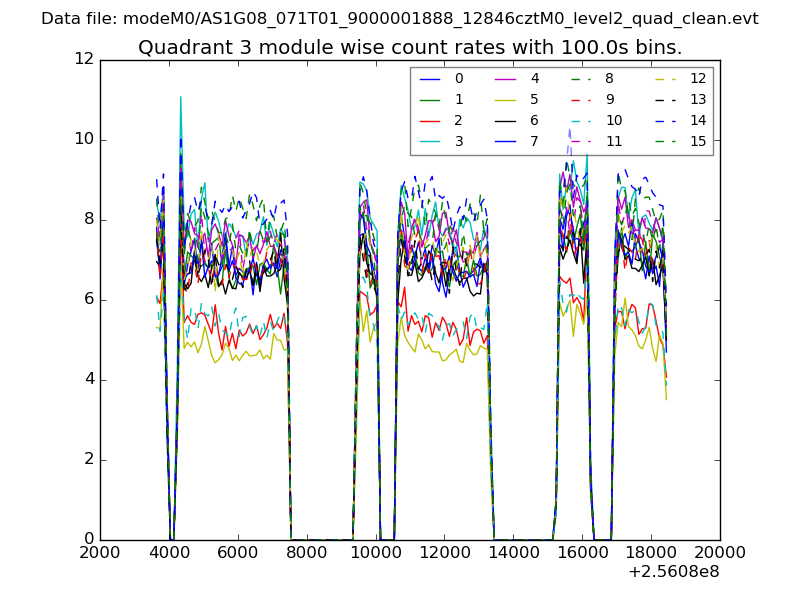
| Module-wise count rates for Quadrant C Data is divided into 100 sec bins |
 |
 |
| Module-wise count rates for Quadrant D Data is divided into 100 sec bins |
 |
 |
| Parameter | Plot |
|---|---|
| CZT HV Monitor | 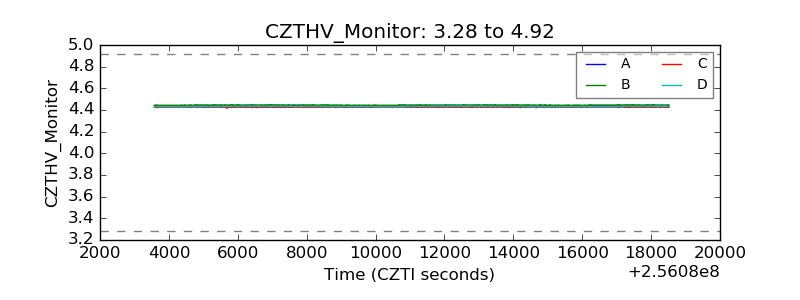 |
| D_VDD | 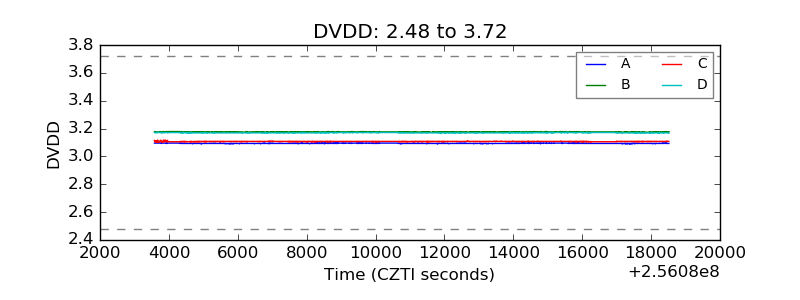 |
| Temperature 1 | 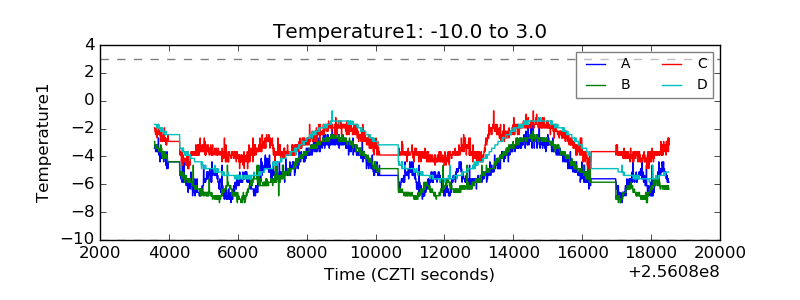 |
| Veto HV Monitor | 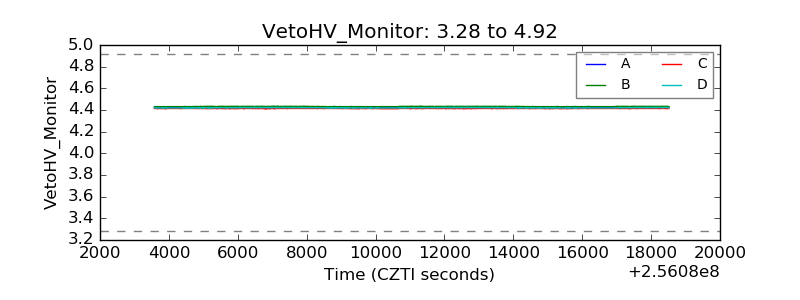 |
| Veto LLD |  |
| Alpha Counter | 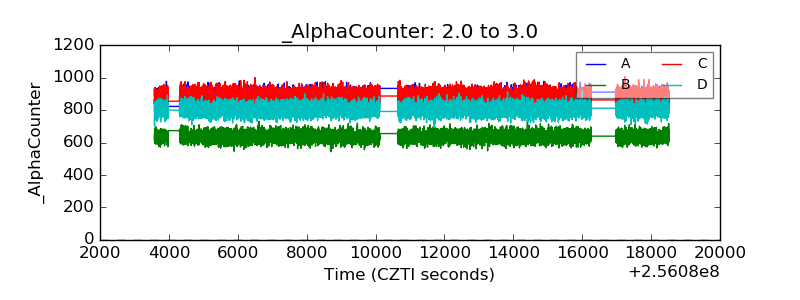 |
| _CPM_Rate | 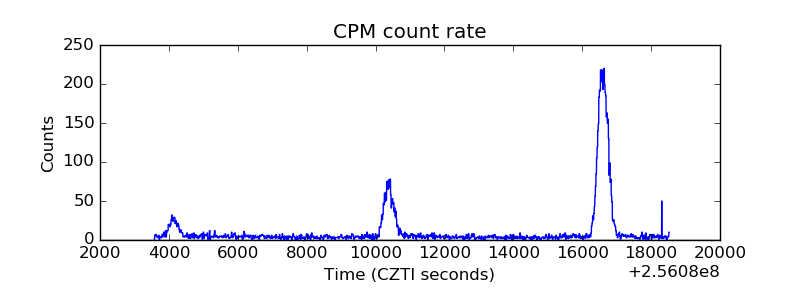 |
| CZT Counter | 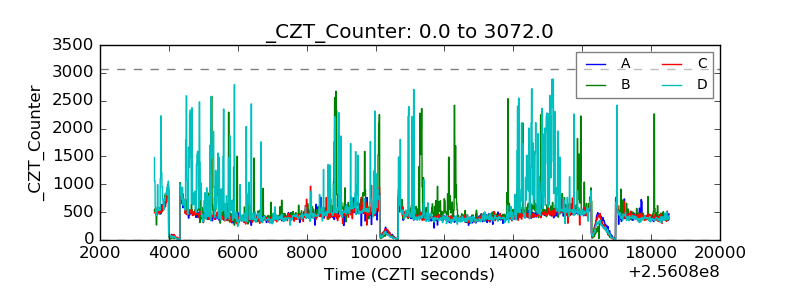 |
| +2.5 Volts monitor |  |
| +5 Volts monitor |  |
| _ROLL_ROT | 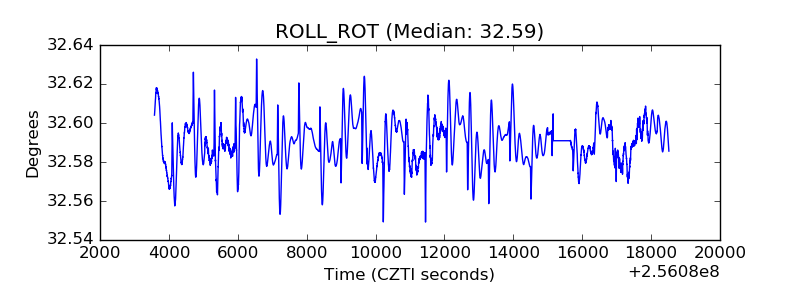 |
| _Roll_DEC | 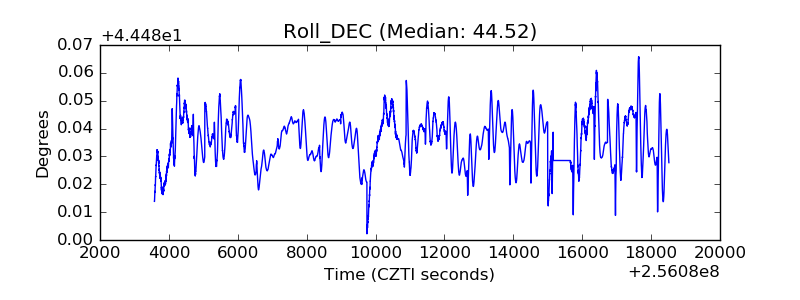 |
| _Roll_RA | 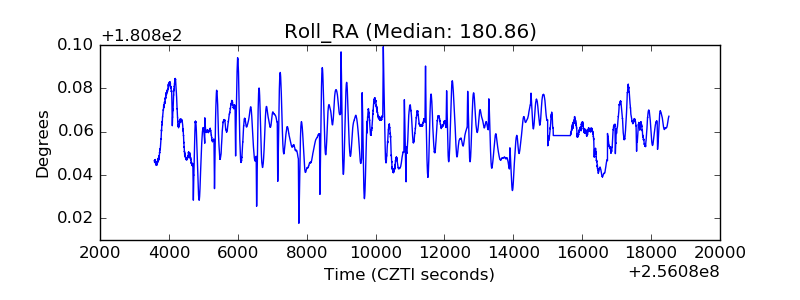 |
| Veto Counter | 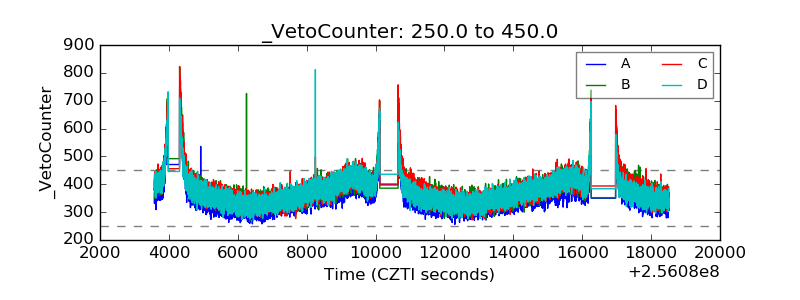 |