| Param | Original file | Final file |
|---|---|---|
| Filename | modeM0/AS1G08_071T01_9000001888_12847cztM0_level2.evt | modeM0/AS1G08_071T01_9000001888_12847cztM0_level2_quad_clean.evt |
| Size (bytes) | 524,600,640 | 107,161,920 |
| Size | 500.3 MB | 102.2 MB |
| Events in quadrant A | 3,446,228 | 686,779 |
| Events in quadrant B | 4,526,399 | 681,450 |
| Events in quadrant C | 3,386,824 | 692,120 |
| Events in quadrant D | 4,016,126 | 660,501 |
| Mode SS | |||
|---|---|---|---|
| Quadrant | BADHDUFLAG | Total packets | Discarded packets |
| A | 0 | 154 | 0 |
| B | 0 | 154 | 0 |
| C | 0 | 154 | 0 |
| D | 0 | 154 | 0 |
| Mode M9 | |||
|---|---|---|---|
| Quadrant | BADHDUFLAG | Total packets | Discarded packets |
| A | 0 | 15 | 0 |
| B | 0 | 15 | 0 |
| C | 0 | 15 | 0 |
| D | 0 | 15 | 0 |
| Mode M0 | |||
|---|---|---|---|
| Quadrant | BADHDUFLAG | Total packets | Discarded packets |
| A | 0 | 15372 | 3 |
| B | 0 | 18395 | 2 |
| C | 0 | 15423 | 2 |
| D | 0 | 17368 | 2 |
| Quadrant | Total seconds | Saturated seconds | Saturation percentage |
|---|---|---|---|
| A | 7534 | 33 | 0.438014% |
| B | 7534 | 402 | 5.335811% |
| C | 7534 | 25 | 0.331829% |
| D | 7534 | 67 | 0.889302% |
Noise dominated data is calculated using 1-second bins in cleaned event files. If a bin has >2000 counts, and if more than 50% of those come from <1% of pixels, then it is considered to be noise-dominated and hence unusable.
| Quadrant | # 1 sec bins | Bins with >0 counts | Bins with >2000 counts | High rate bins dominated by noise | Noise dominated (total time) | Noise dominated (detector-on time) | Marked lightcurve |
|---|---|---|---|---|---|---|---|
| A | 9110 | 7537 | 0 | 0 | 0.00% | 0.00% | 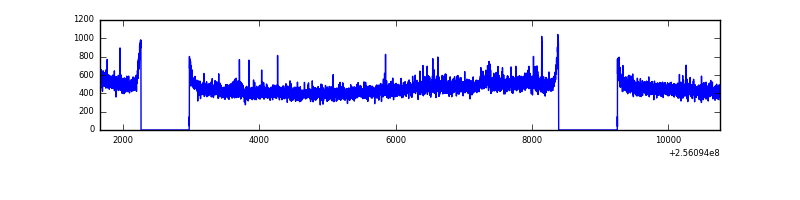 |
| B | 9110 | 7537 | 220 | 220 | 2.41% | 2.92% | 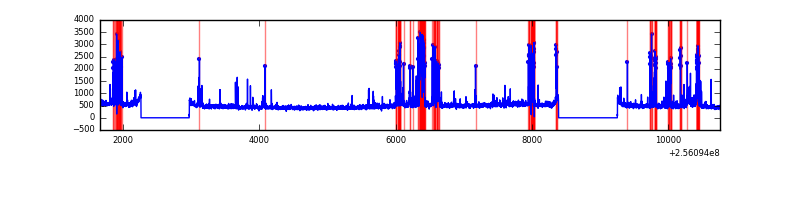 |
| C | 9110 | 7537 | 6 | 6 | 0.07% | 0.08% | 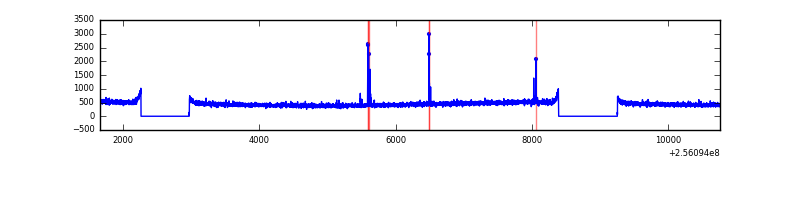 |
| D | 9110 | 7537 | 45 | 45 | 0.49% | 0.60% | 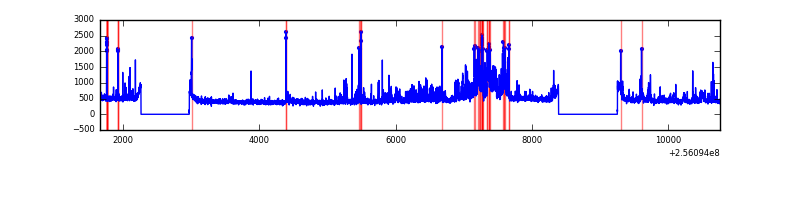 |
Top three noisy pixels from each quadrant. If the there are fewer than three noisy pixels in the level2.evt file, extra rows are filled as -1
| Pixel properties | Quadrant properties | ||||||
|---|---|---|---|---|---|---|---|
| Quadrant | DetID | PixID | Counts | Sigma | Mean | Median | Sigma |
| A | 12 | 189 | 45247 | 246.8 | 882 | 862 | 179.8 |
| A | 0 | 226 | 7712 | 38.09 | 882 | 862 | 179.8 |
| A | 8 | 15 | 7120 | 34.8 | 882 | 862 | 179.8 |
| B | 4 | 239 | 852445 | 5154.64 | 860 | 839 | 165.2 |
| B | 0 | 85 | 140369 | 844.55 | 860 | 839 | 165.2 |
| B | 0 | 219 | 55704 | 332.09 | 860 | 839 | 165.2 |
| C | 14 | 234 | 48293 | 238.74 | 856 | 860 | 198.7 |
| C | 13 | 61 | 6219 | 26.97 | 856 | 860 | 198.7 |
| C | 3 | 202 | 2024 | 5.86 | 856 | 860 | 198.7 |
| D | 1 | 52 | 426805 | 2080.58 | 848 | 822 | 204.7 |
| D | 13 | 172 | 275326 | 1340.73 | 848 | 822 | 204.7 |
| D | 2 | 136 | 39370 | 188.28 | 848 | 822 | 204.7 |
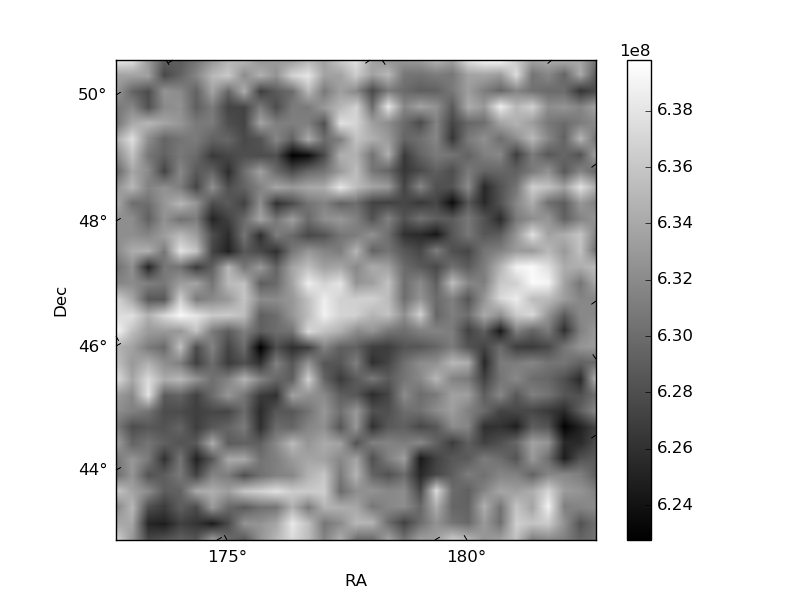
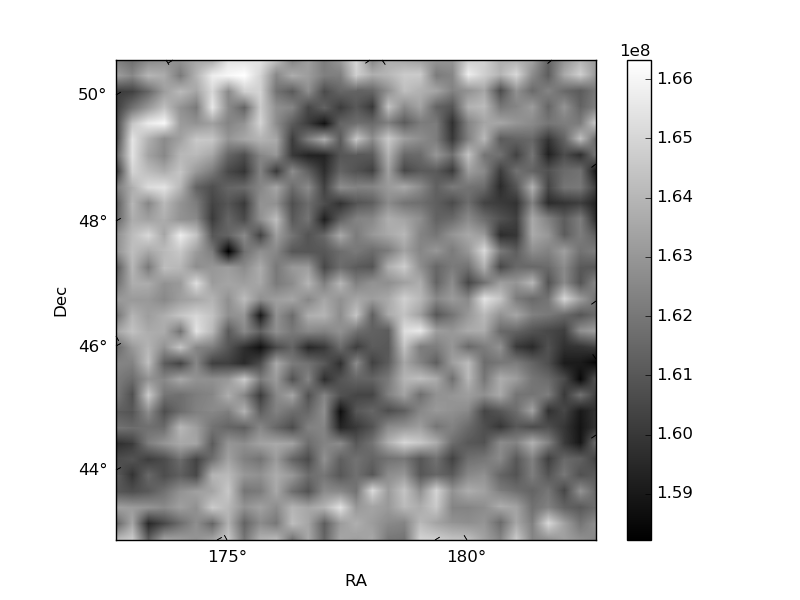
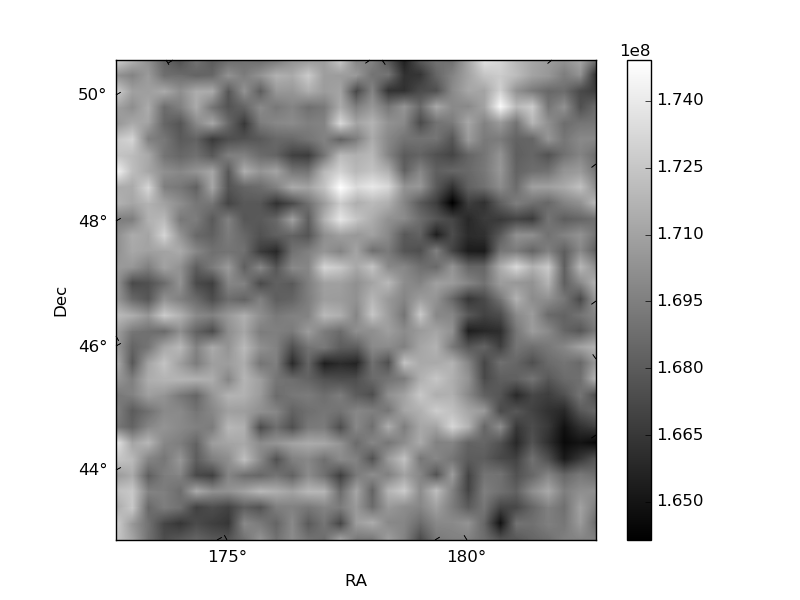
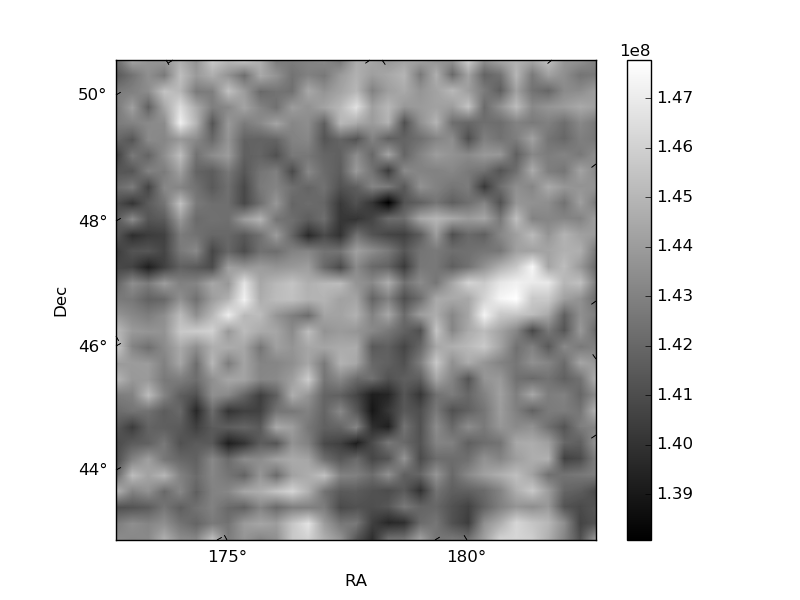
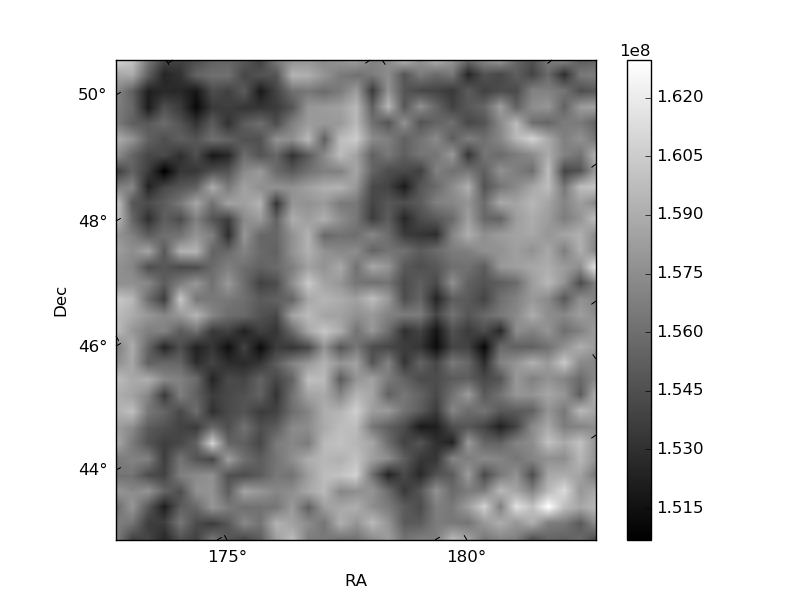
Histogram calculated using DETX and DETY for each event in the final _common_clean file
| Quadrant A | 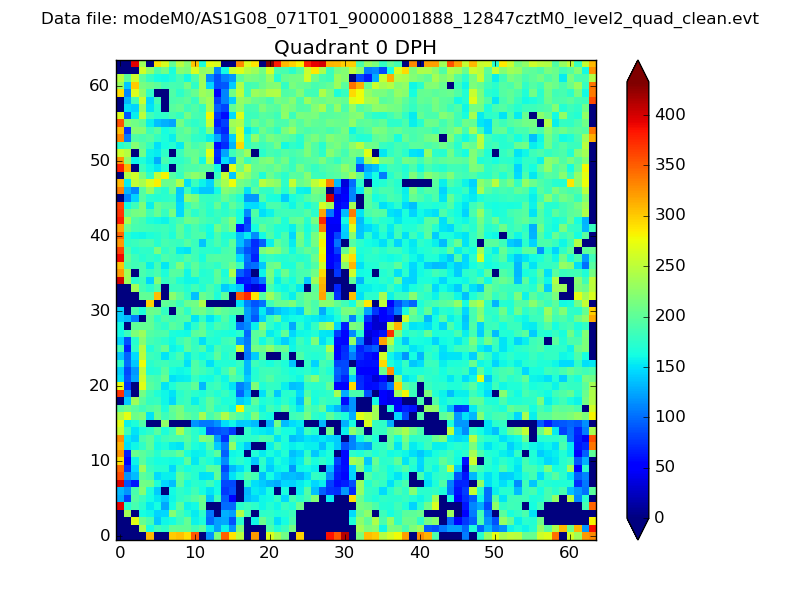 |
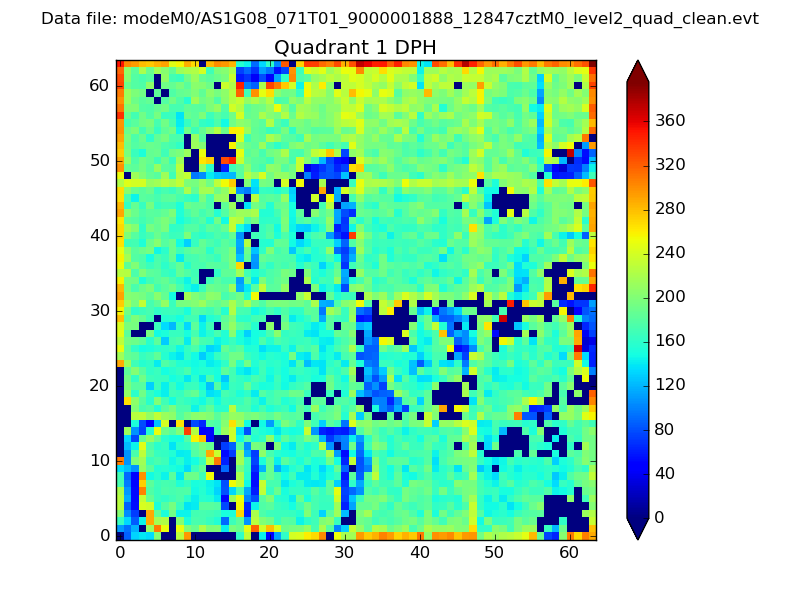 |
Quadrant B |
|---|---|---|---|
| Quadrant D | 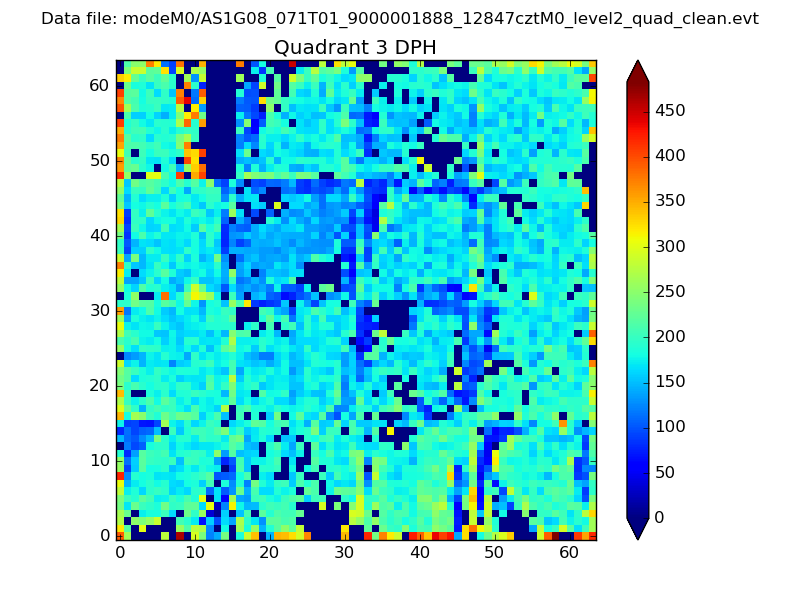 |
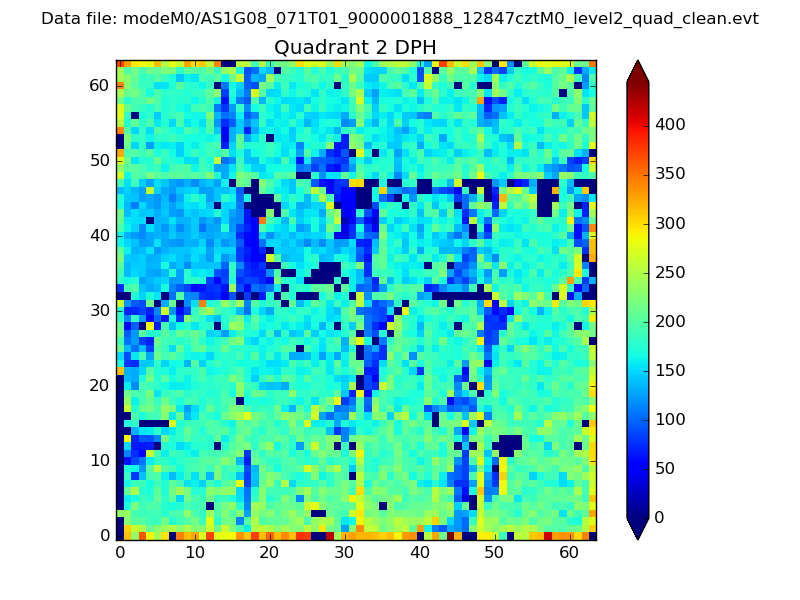 |
Quadrant C |
| Plot type | Count rate plots | Images |
|---|---|---|
| Comparison with Poisson distribution Blue bars denote a histogram of data divided into 1 sec bins. Red curve is a Poisson curve with rate = median count rate of data. |
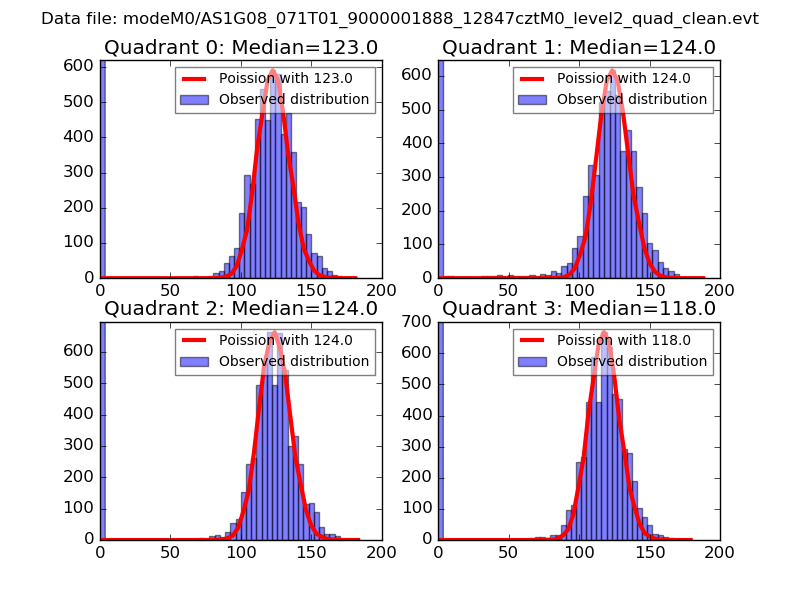 |
 |
| Quadrant-wise count rates Data is divided into 100 sec bins |
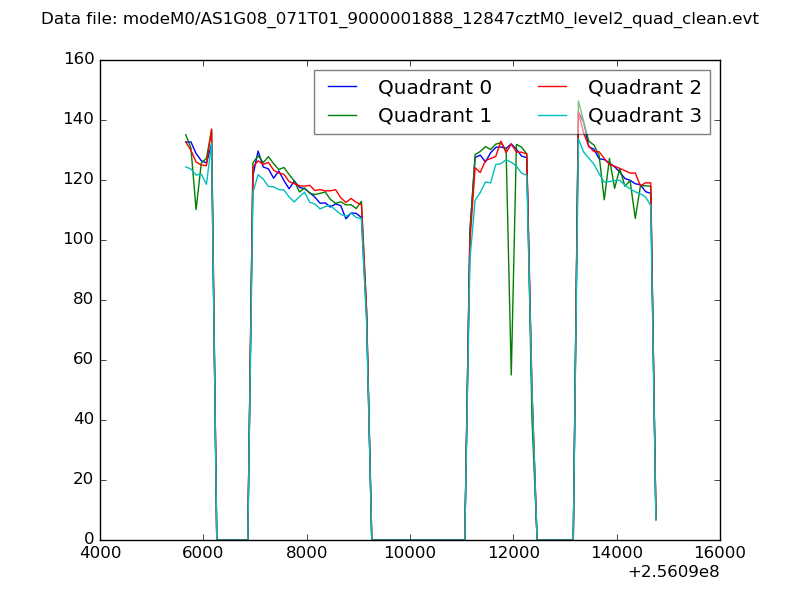 |
|
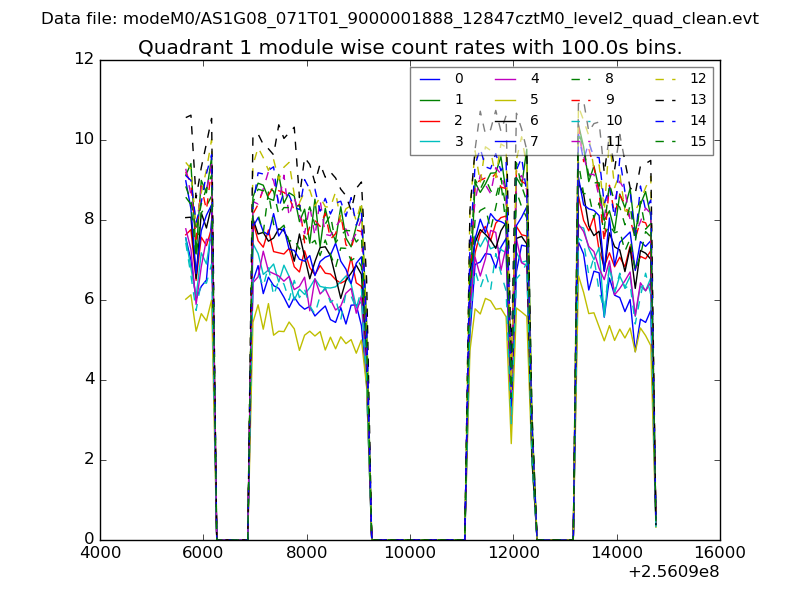
| Module-wise count rates for Quadrant A Data is divided into 100 sec bins |
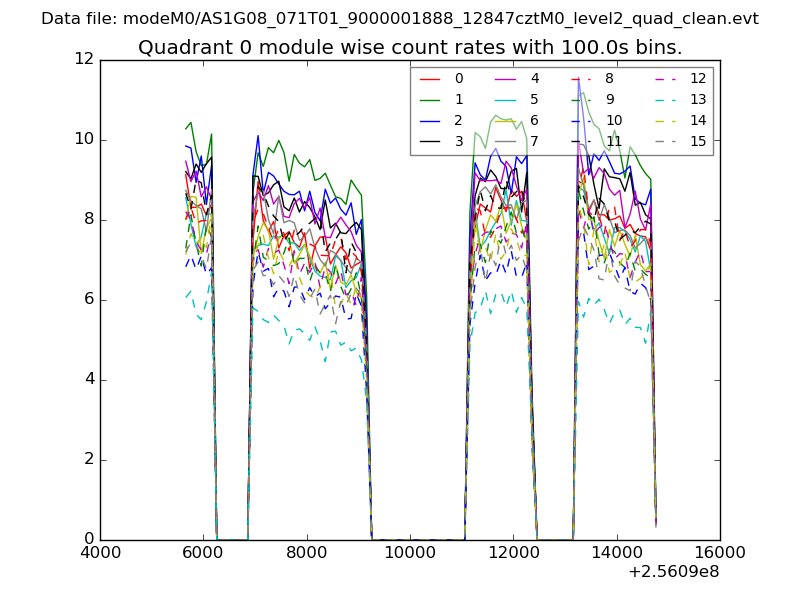 |
 |
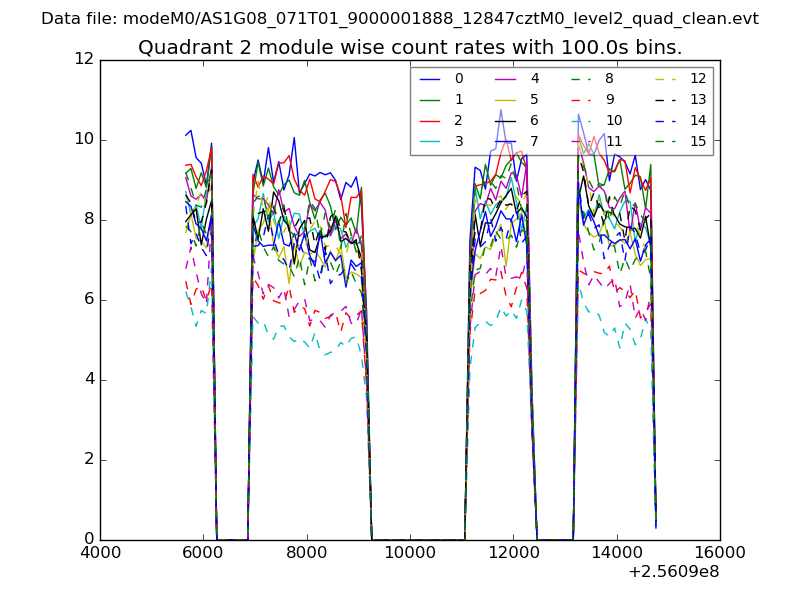
| Module-wise count rates for Quadrant B Data is divided into 100 sec bins |
 |
 |
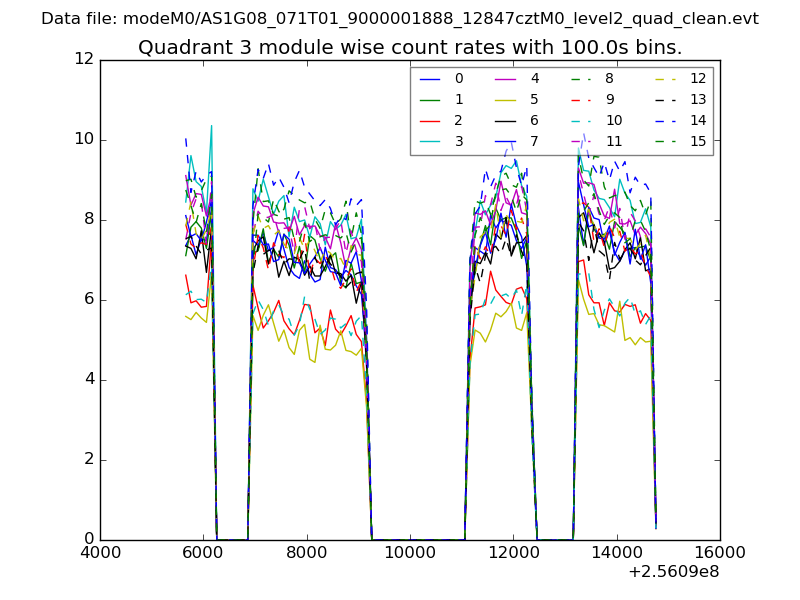
| Module-wise count rates for Quadrant C Data is divided into 100 sec bins |
 |
 |
| Module-wise count rates for Quadrant D Data is divided into 100 sec bins |
 |
 |
| Parameter | Plot |
|---|---|
| CZT HV Monitor | 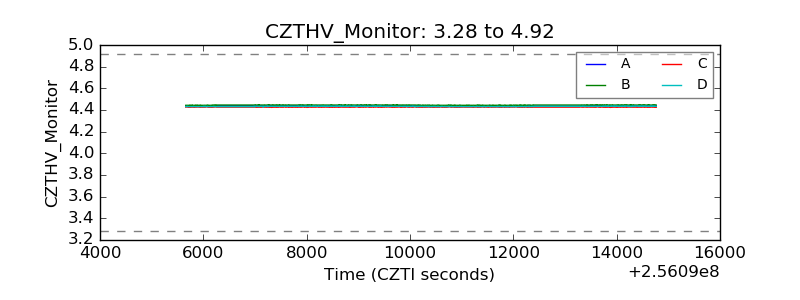 |
| D_VDD | 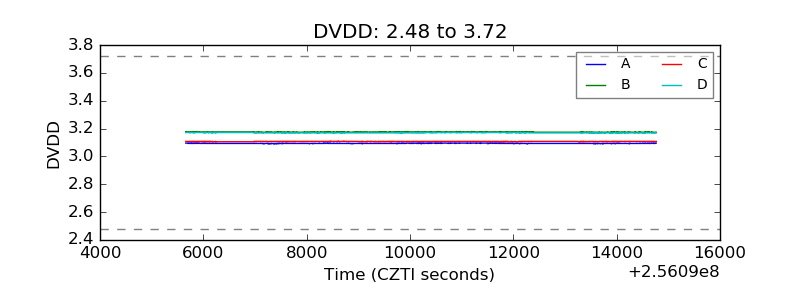 |
| Temperature 1 |  |
| Veto HV Monitor | 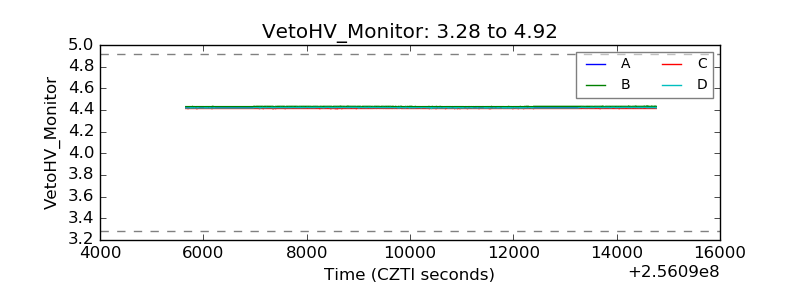 |
| Veto LLD |  |
| Alpha Counter | 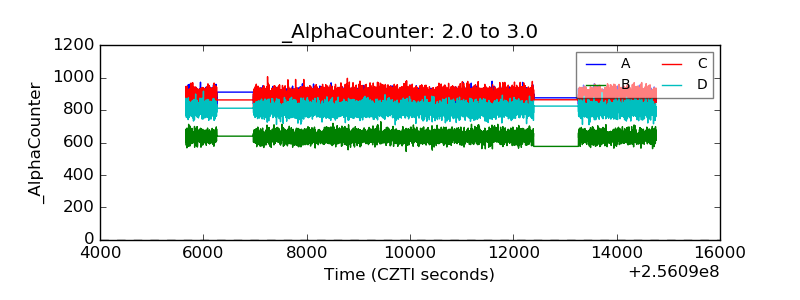 |
| _CPM_Rate | 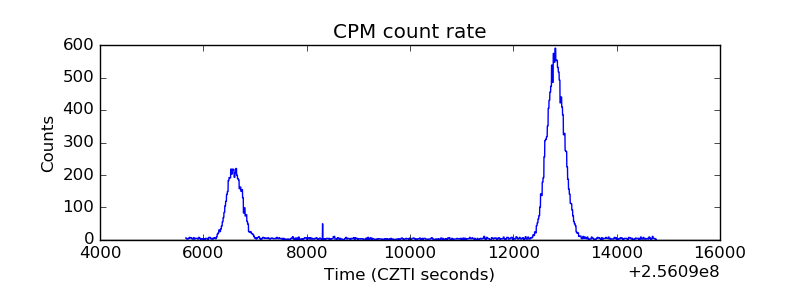 |
| CZT Counter | 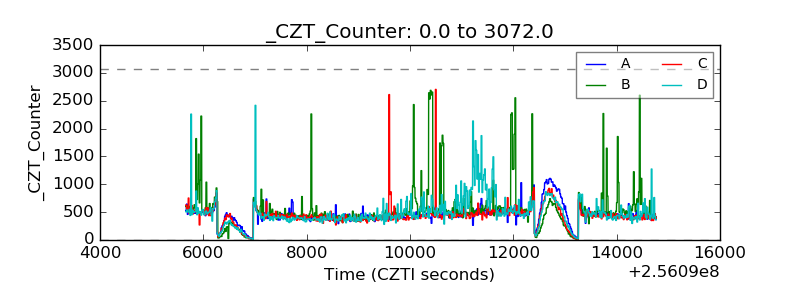 |
| +2.5 Volts monitor |  |
| +5 Volts monitor | 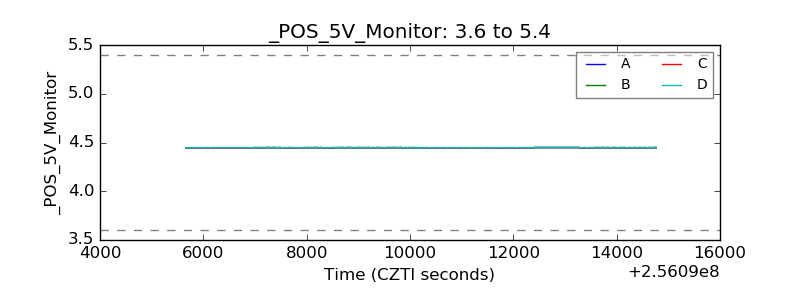 |
| _ROLL_ROT | 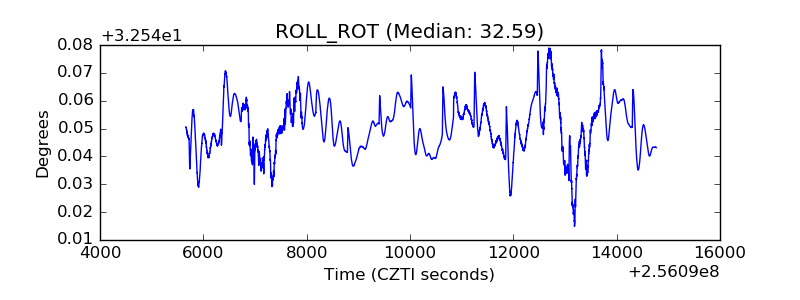 |
| _Roll_DEC | 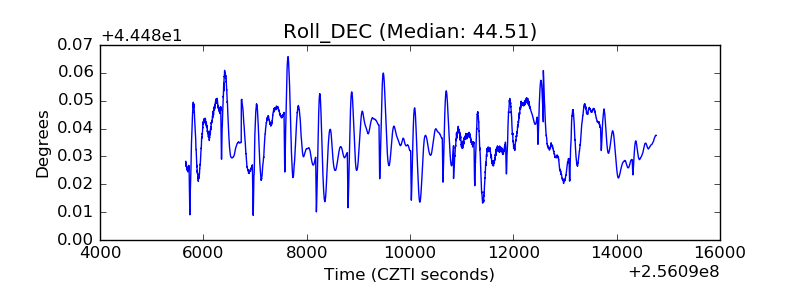 |
| _Roll_RA | 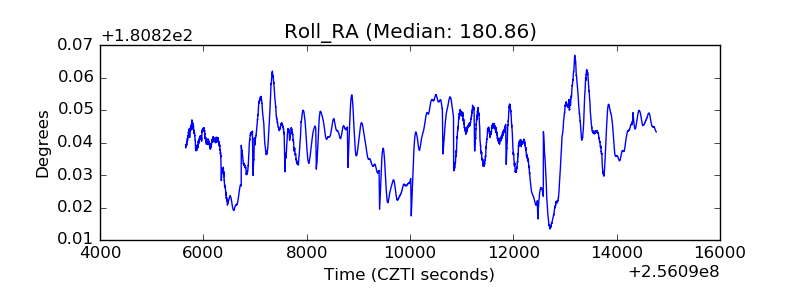 |
| Veto Counter | 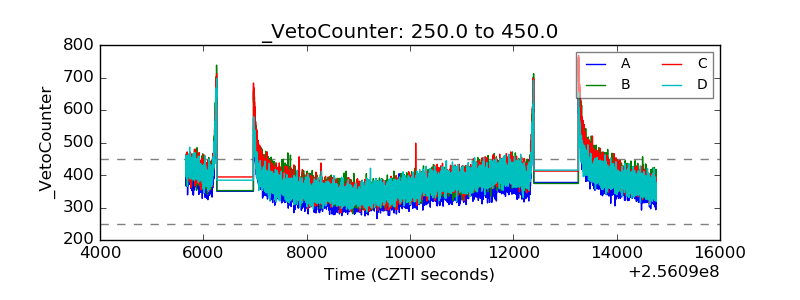 |