| Param | Original file | Final file |
|---|---|---|
| Filename | modeM0/AS1G08_071T01_9000001888_12848cztM0_level2.evt | modeM0/AS1G08_071T01_9000001888_12848cztM0_level2_quad_clean.evt |
| Size (bytes) | 466,902,720 | 93,810,240 |
| Size | 445.3 MB | 89.5 MB |
| Events in quadrant A | 3,123,676 | 604,142 |
| Events in quadrant B | 4,121,165 | 589,840 |
| Events in quadrant C | 2,972,272 | 602,208 |
| Events in quadrant D | 3,470,764 | 580,780 |
| Mode SS | |||
|---|---|---|---|
| Quadrant | BADHDUFLAG | Total packets | Discarded packets |
| A | 0 | 136 | 0 |
| B | 0 | 136 | 0 |
| C | 0 | 136 | 0 |
| D | 0 | 136 | 0 |
| Mode M9 | |||
|---|---|---|---|
| Quadrant | BADHDUFLAG | Total packets | Discarded packets |
| A | 0 | 13 | 0 |
| B | 0 | 13 | 0 |
| C | 0 | 13 | 0 |
| D | 0 | 14 | 0 |
| Mode M0 | |||
|---|---|---|---|
| Quadrant | BADHDUFLAG | Total packets | Discarded packets |
| A | 0 | 13637 | 3 |
| B | 0 | 16416 | 2 |
| C | 0 | 13456 | 2 |
| D | 0 | 14991 | 2 |
| Quadrant | Total seconds | Saturated seconds | Saturation percentage |
|---|---|---|---|
| A | 6651 | 41 | 0.616449% |
| B | 6651 | 304 | 4.570741% |
| C | 6651 | 18 | 0.270636% |
| D | 6651 | 36 | 0.541272% |
Noise dominated data is calculated using 1-second bins in cleaned event files. If a bin has >2000 counts, and if more than 50% of those come from <1% of pixels, then it is considered to be noise-dominated and hence unusable.
| Quadrant | # 1 sec bins | Bins with >0 counts | Bins with >2000 counts | High rate bins dominated by noise | Noise dominated (total time) | Noise dominated (detector-on time) | Marked lightcurve |
|---|---|---|---|---|---|---|---|
| A | 7677 | 6653 | 0 | 0 | 0.00% | 0.00% | 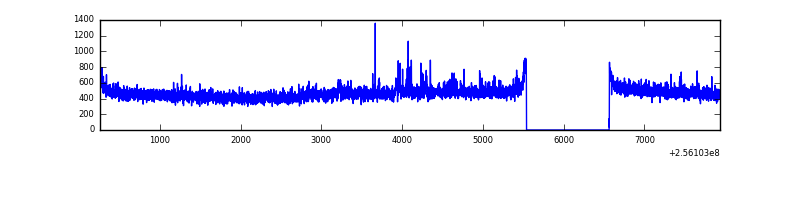 |
| B | 7677 | 6653 | 193 | 193 | 2.51% | 2.90% | 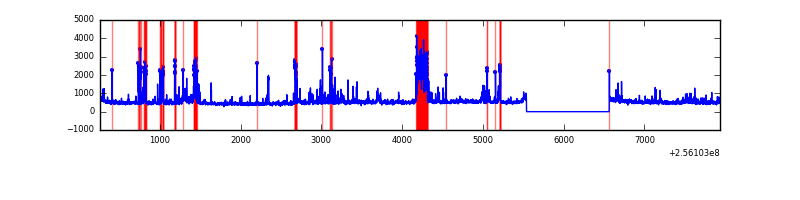 |
| C | 7677 | 6653 | 0 | 0 | 0.00% | 0.00% | 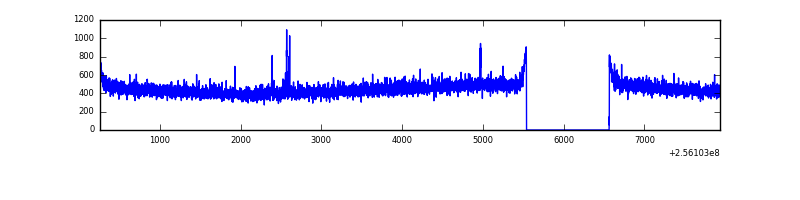 |
| D | 7677 | 6653 | 20 | 20 | 0.26% | 0.30% | 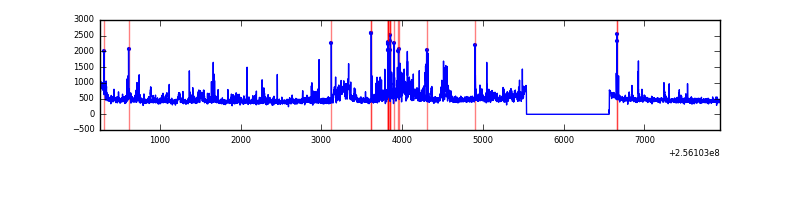 |
Top three noisy pixels from each quadrant. If the there are fewer than three noisy pixels in the level2.evt file, extra rows are filled as -1
| Pixel properties | Quadrant properties | ||||||
|---|---|---|---|---|---|---|---|
| Quadrant | DetID | PixID | Counts | Sigma | Mean | Median | Sigma |
| A | 12 | 189 | 81615 | 505.24 | 788 | 771 | 160.0 |
| A | 8 | 15 | 9587 | 55.1 | 788 | 771 | 160.0 |
| A | 0 | 226 | 7030 | 39.12 | 788 | 771 | 160.0 |
| B | 4 | 239 | 700996 | 4780.27 | 768 | 748 | 146.5 |
| B | 0 | 85 | 124854 | 847.21 | 768 | 748 | 146.5 |
| B | 0 | 219 | 69627 | 470.21 | 768 | 748 | 146.5 |
| C | 14 | 234 | 15466 | 83.91 | 758 | 762 | 175.2 |
| C | 13 | 61 | 5478 | 26.91 | 758 | 762 | 175.2 |
| C | 3 | 202 | 1843 | 6.17 | 758 | 762 | 175.2 |
| D | 1 | 52 | 387282 | 2116.67 | 756 | 737 | 182.6 |
| D | 13 | 172 | 131891 | 718.18 | 756 | 737 | 182.6 |
| D | 2 | 136 | 31832 | 170.27 | 756 | 737 | 182.6 |
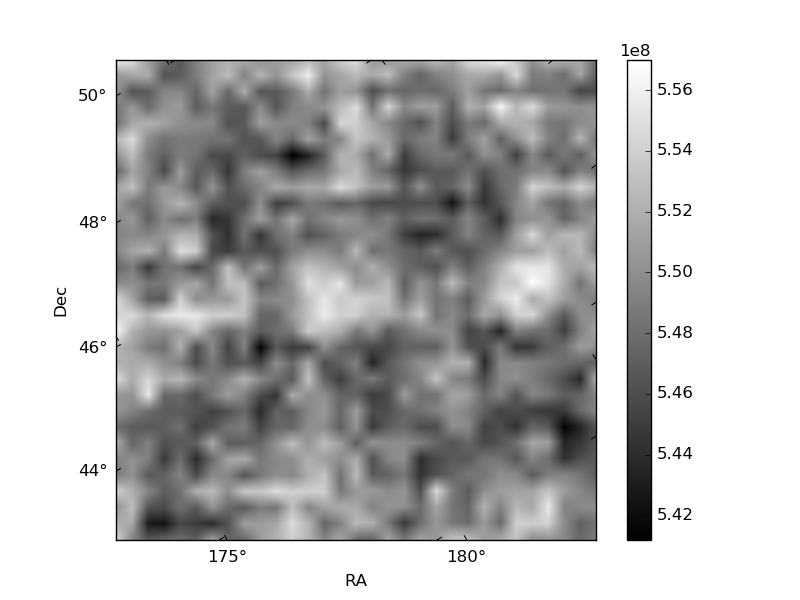
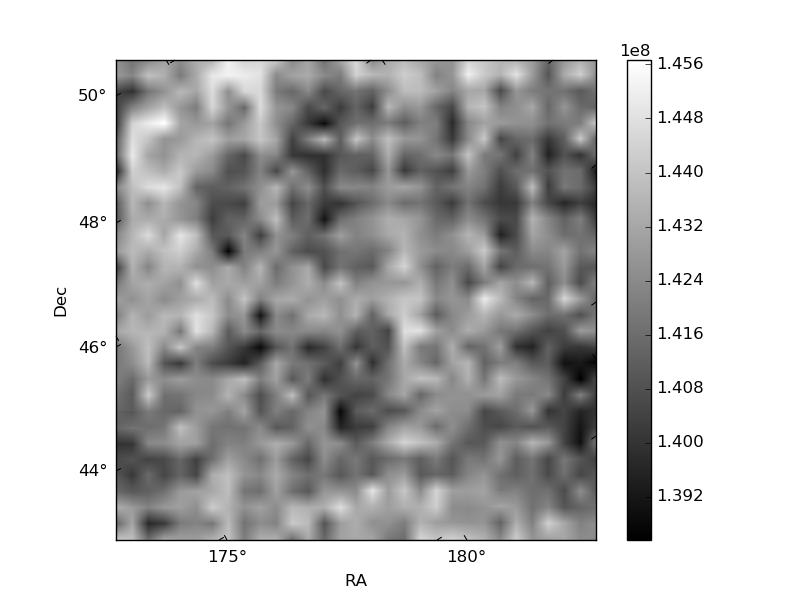
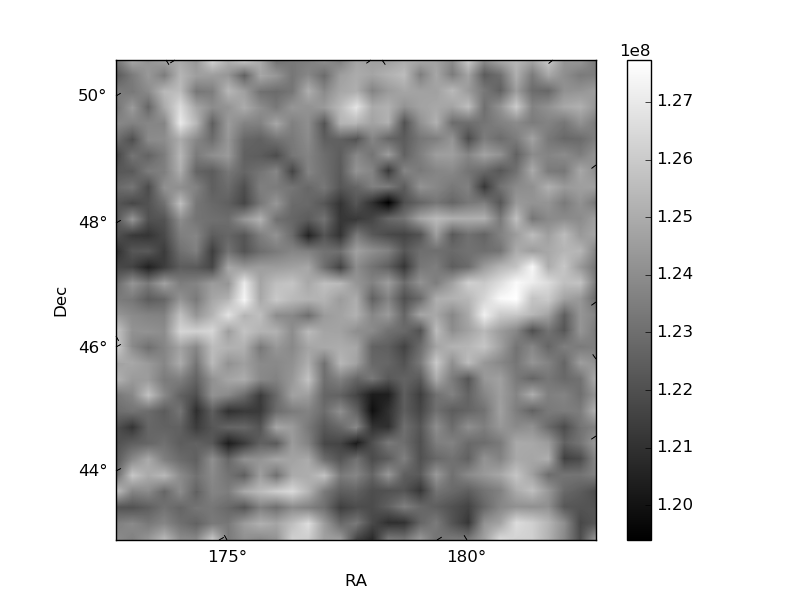
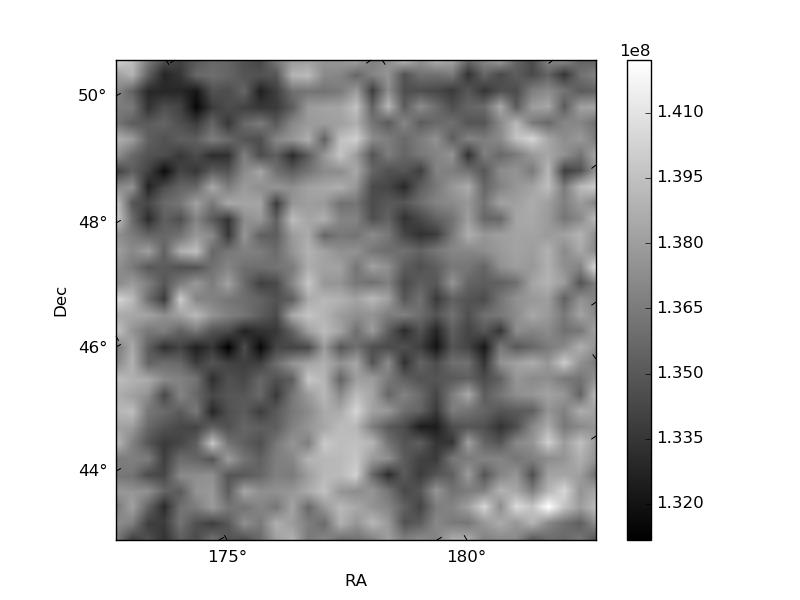
Histogram calculated using DETX and DETY for each event in the final _common_clean file
| Quadrant A | 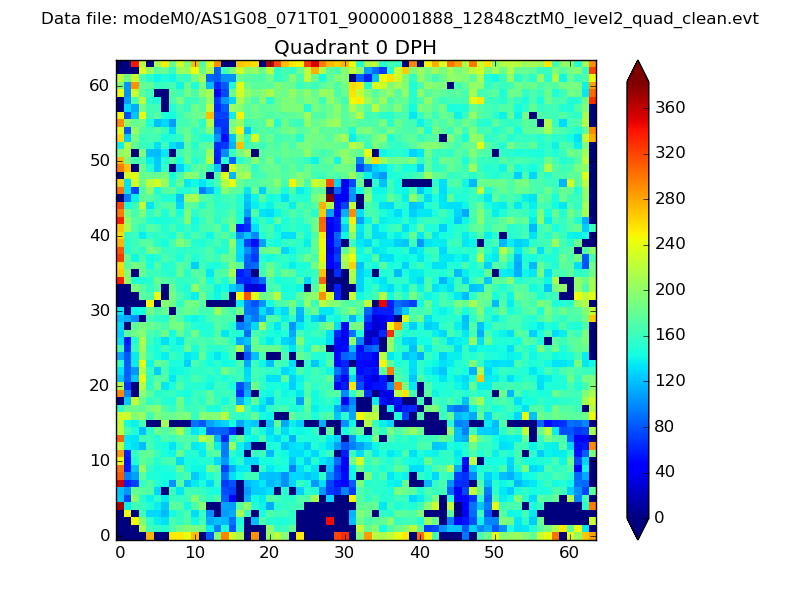 |
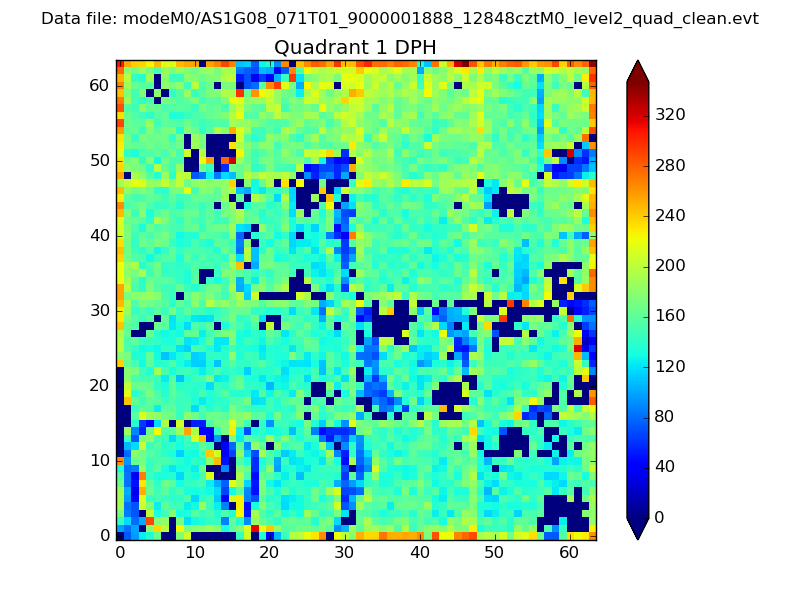 |
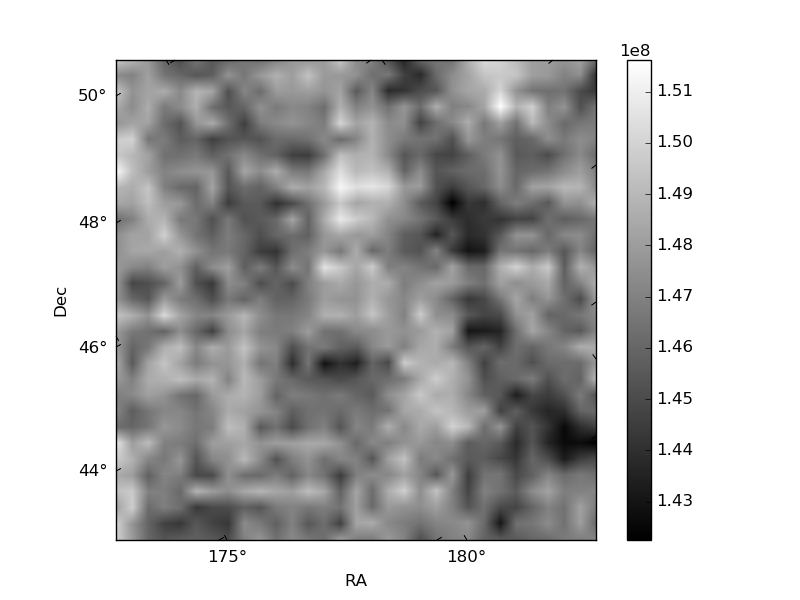
Quadrant B |
|---|---|---|---|
| Quadrant D | 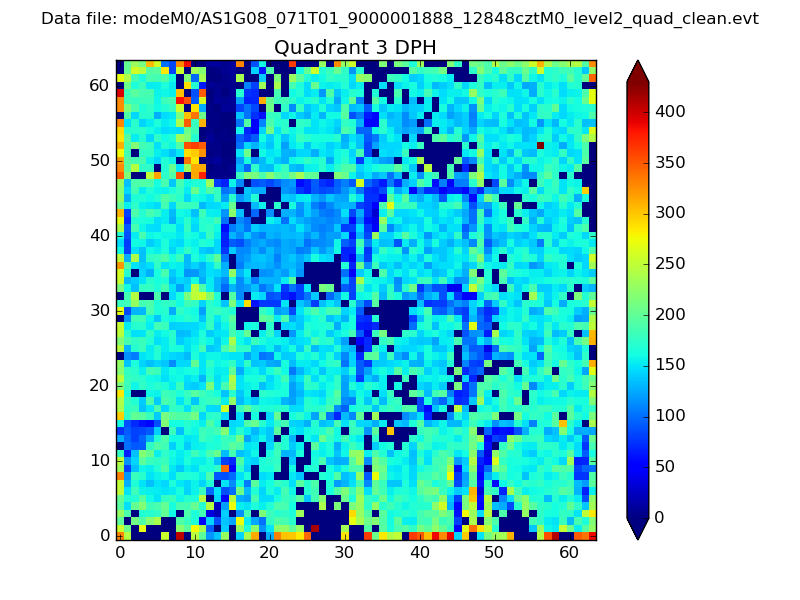 |
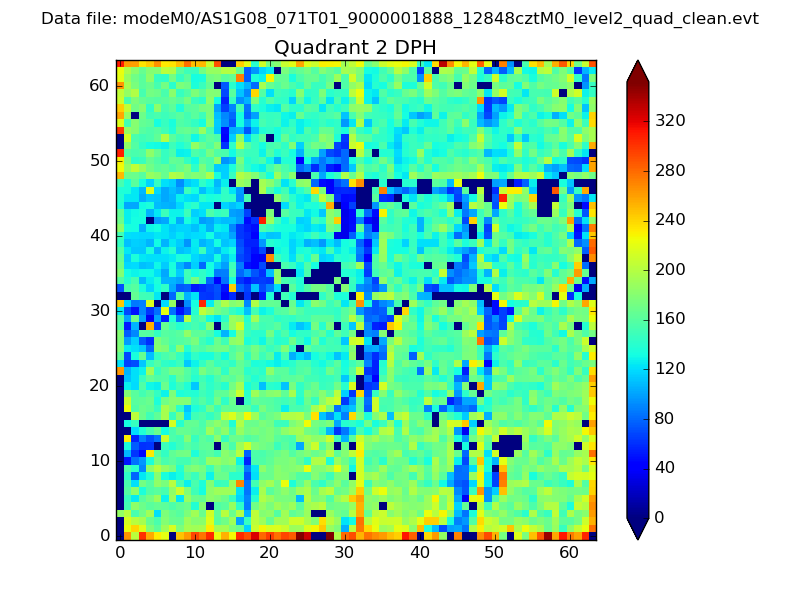 |
Quadrant C |
| Plot type | Count rate plots | Images |
|---|---|---|
| Comparison with Poisson distribution Blue bars denote a histogram of data divided into 1 sec bins. Red curve is a Poisson curve with rate = median count rate of data. |
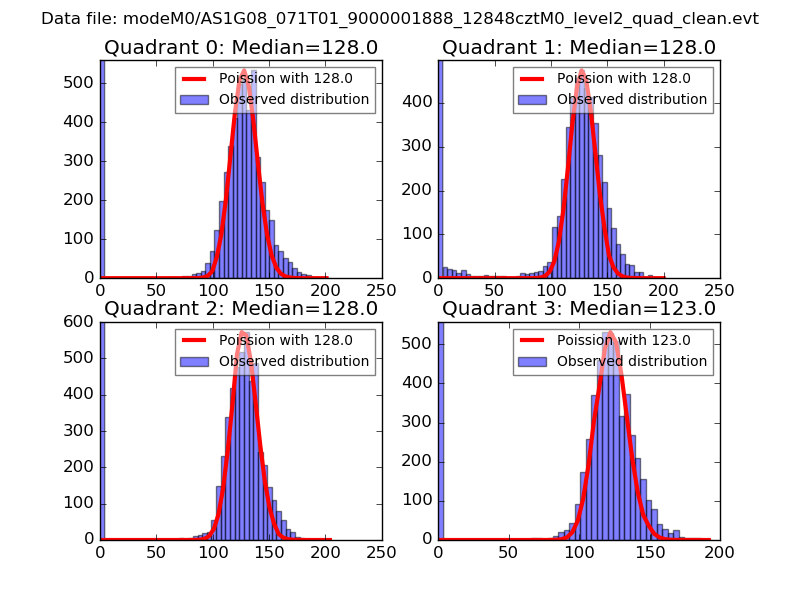 |
 |
| Quadrant-wise count rates Data is divided into 100 sec bins |
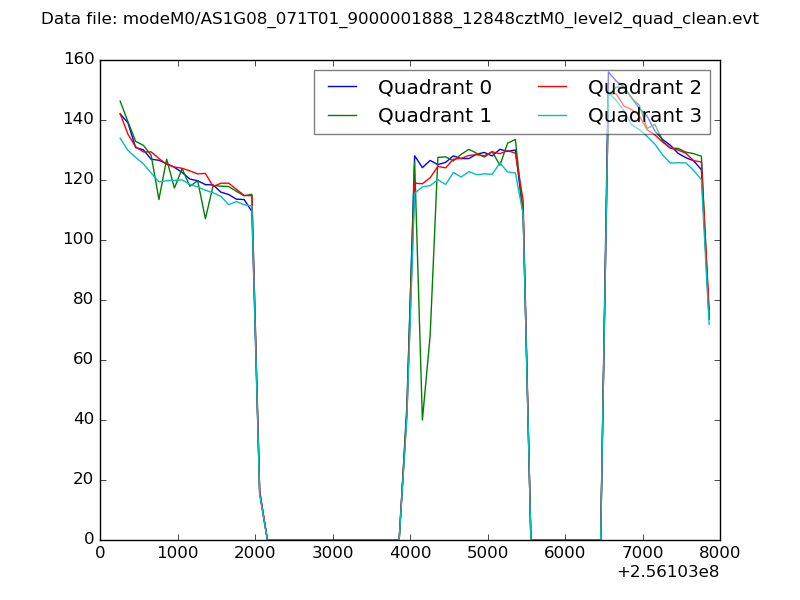 |
|
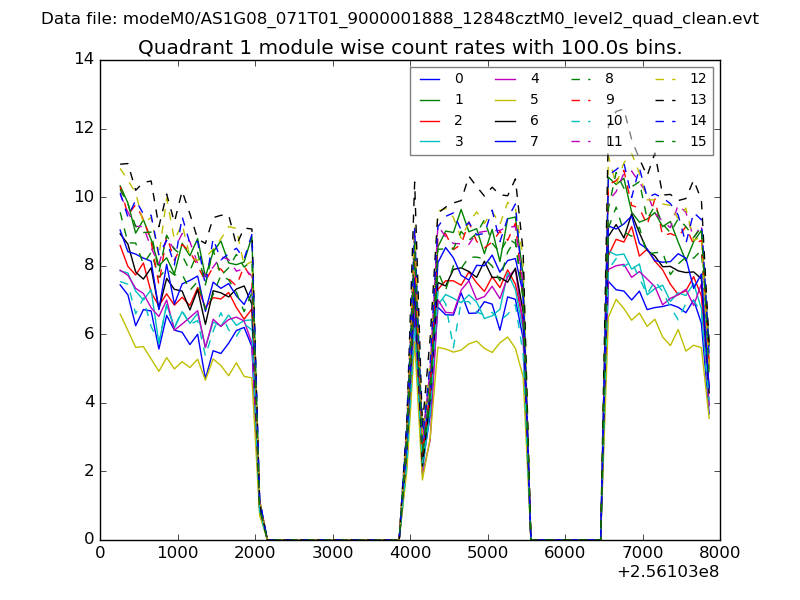
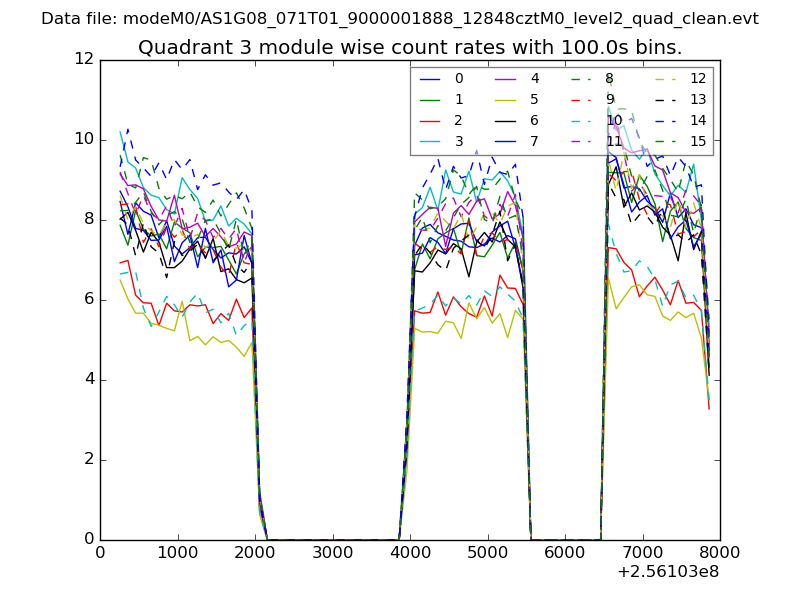
| Module-wise count rates for Quadrant A Data is divided into 100 sec bins |
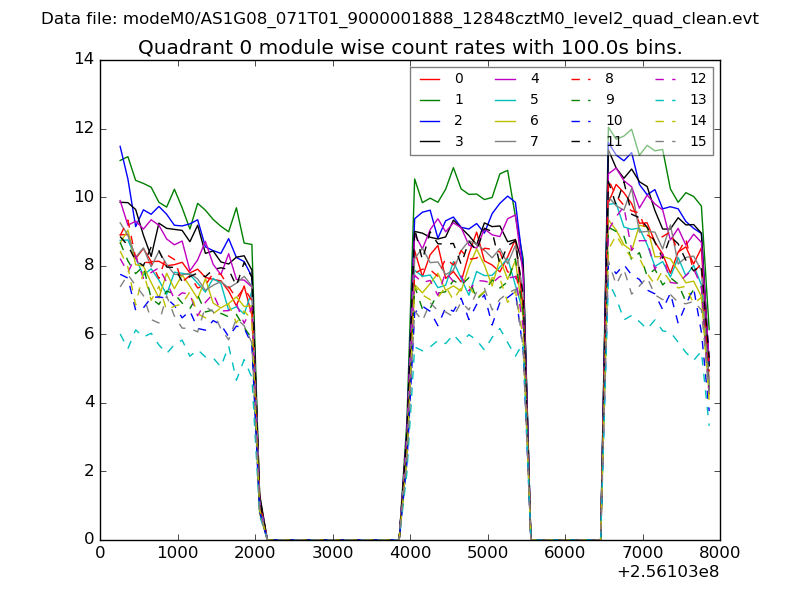 |
 |
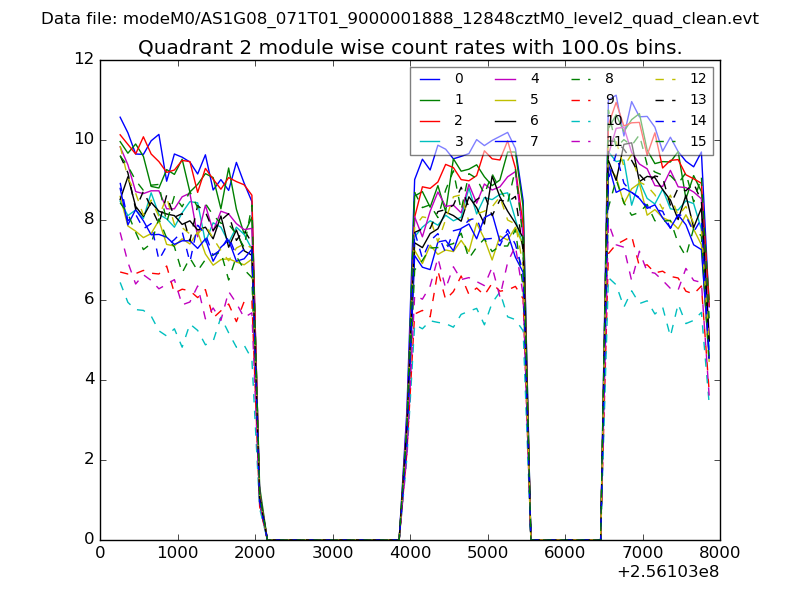
| Module-wise count rates for Quadrant B Data is divided into 100 sec bins |
 |
 |
| Module-wise count rates for Quadrant C Data is divided into 100 sec bins |
 |
 |
| Module-wise count rates for Quadrant D Data is divided into 100 sec bins |
 |
 |
| Parameter | Plot |
|---|---|
| CZT HV Monitor | 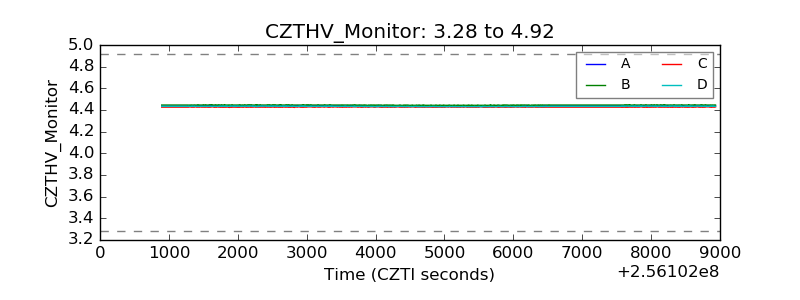 |
| D_VDD | 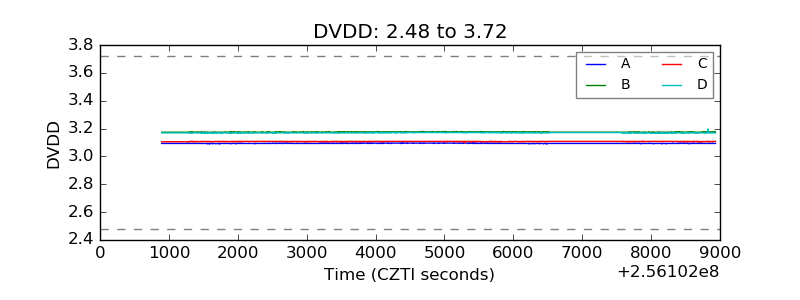 |
| Temperature 1 |  |
| Veto HV Monitor | 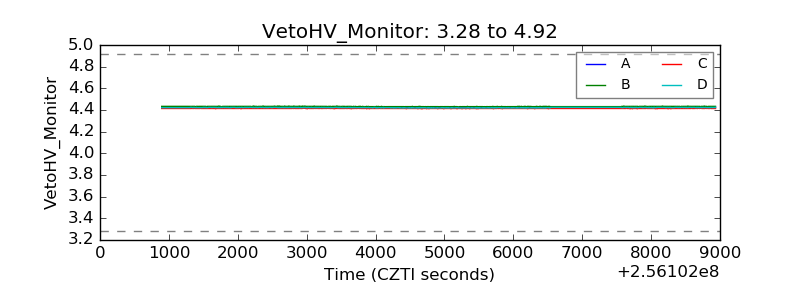 |
| Veto LLD | 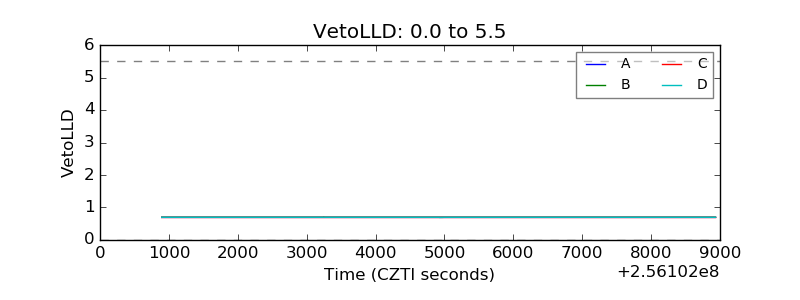 |
| Alpha Counter | 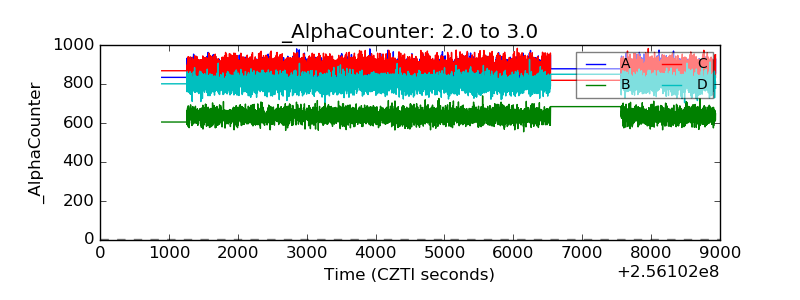 |
| _CPM_Rate | 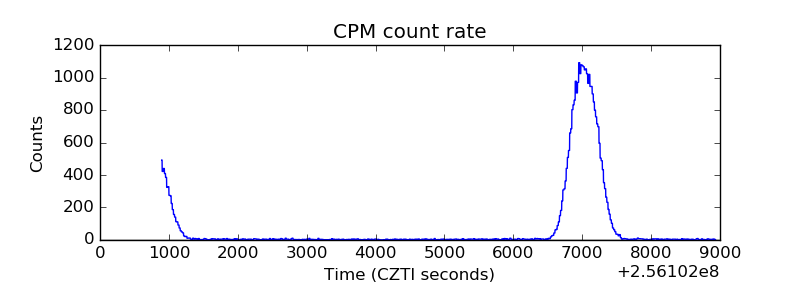 |
| CZT Counter | 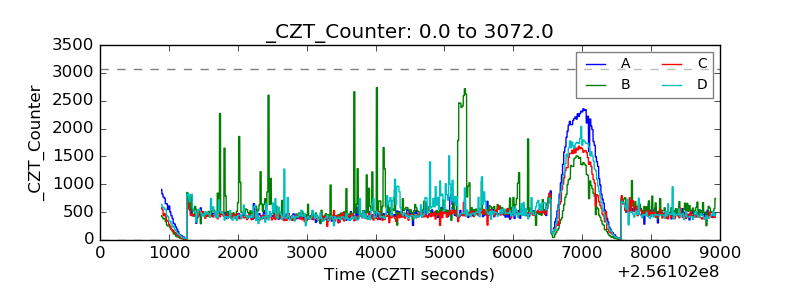 |
| +2.5 Volts monitor | 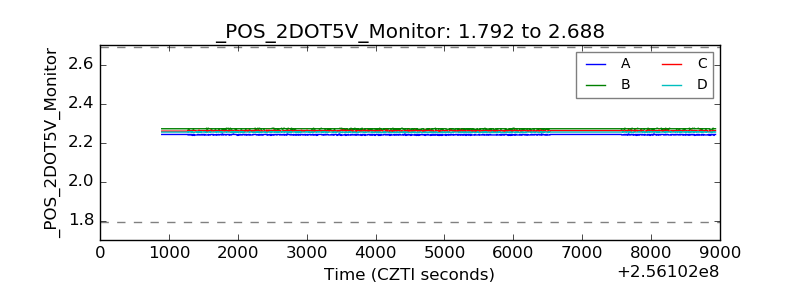 |
| +5 Volts monitor |  |
| _ROLL_ROT | 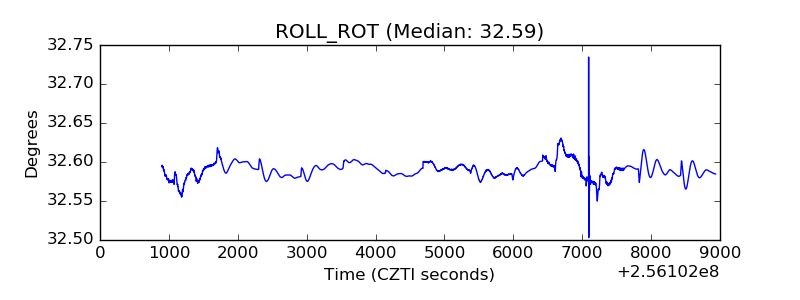 |
| _Roll_DEC | 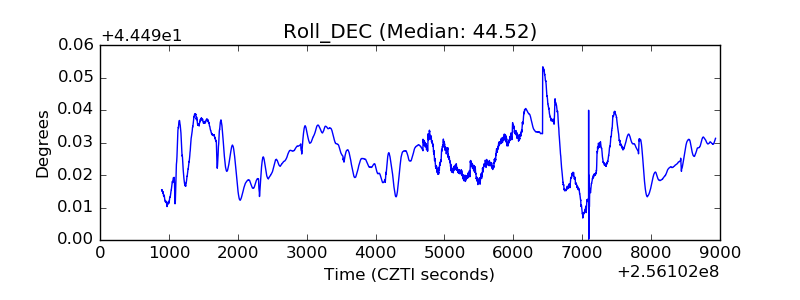 |
| _Roll_RA | 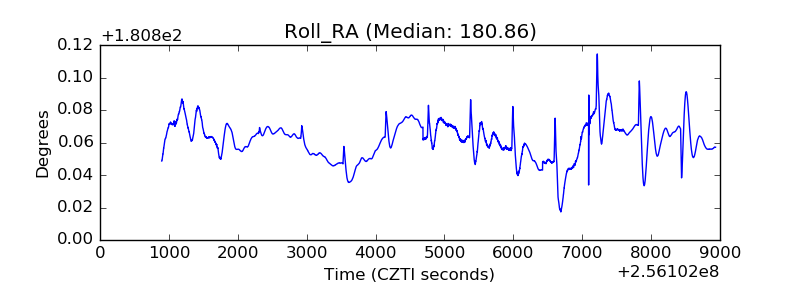 |
| Veto Counter | 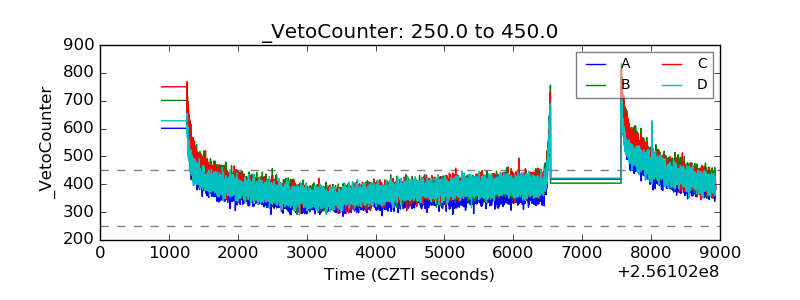 |