| Param | Original file | Final file |
|---|---|---|
| Filename | modeM0/AS1G08_071T01_9000001888_12850cztM0_level2.evt | modeM0/AS1G08_071T01_9000001888_12850cztM0_level2_quad_clean.evt |
| Size (bytes) | 469,143,360 | 89,058,240 |
| Size | 447.4 MB | 84.9 MB |
| Events in quadrant A | 3,279,233 | 568,702 |
| Events in quadrant B | 4,181,703 | 561,220 |
| Events in quadrant C | 3,049,851 | 562,507 |
| Events in quadrant D | 3,249,582 | 545,072 |
| Mode SS | |||
|---|---|---|---|
| Quadrant | BADHDUFLAG | Total packets | Discarded packets |
| A | 0 | 134 | 0 |
| B | 0 | 134 | 0 |
| C | 0 | 134 | 0 |
| D | 0 | 134 | 0 |
| Mode M9 | |||
|---|---|---|---|
| Quadrant | BADHDUFLAG | Total packets | Discarded packets |
| A | 0 | 11 | 0 |
| B | 0 | 11 | 0 |
| C | 0 | 11 | 0 |
| D | 0 | 11 | 0 |
| Mode M0 | |||
|---|---|---|---|
| Quadrant | BADHDUFLAG | Total packets | Discarded packets |
| A | 0 | 13823 | 2 |
| B | 0 | 16416 | 1 |
| C | 0 | 13409 | 1 |
| D | 0 | 13947 | 1 |
| Quadrant | Total seconds | Saturated seconds | Saturation percentage |
|---|---|---|---|
| A | 6587 | 71 | 1.077881% |
| B | 6587 | 326 | 4.949142% |
| C | 6587 | 43 | 0.652801% |
| D | 6587 | 49 | 0.743889% |
Noise dominated data is calculated using 1-second bins in cleaned event files. If a bin has >2000 counts, and if more than 50% of those come from <1% of pixels, then it is considered to be noise-dominated and hence unusable.
| Quadrant | # 1 sec bins | Bins with >0 counts | Bins with >2000 counts | High rate bins dominated by noise | Noise dominated (total time) | Noise dominated (detector-on time) | Marked lightcurve |
|---|---|---|---|---|---|---|---|
| A | 7708 | 6589 | 0 | 0 | 0.00% | 0.00% | 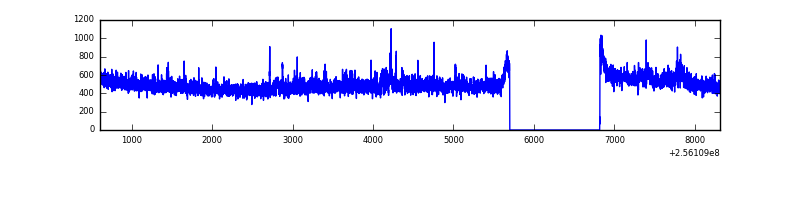 |
| B | 7708 | 6589 | 186 | 186 | 2.41% | 2.82% | 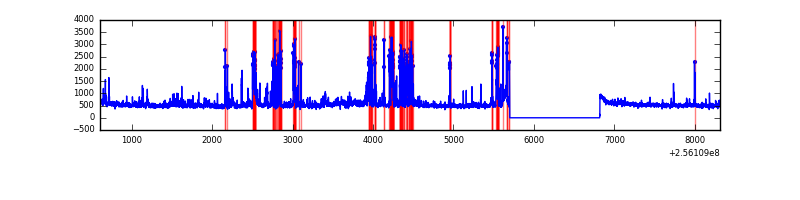 |
| C | 7708 | 6589 | 1 | 1 | 0.01% | 0.02% | 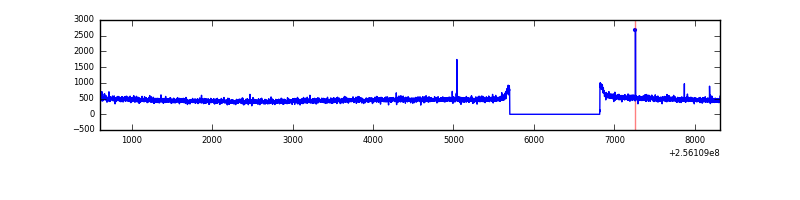 |
| D | 7708 | 6589 | 5 | 5 | 0.06% | 0.08% | 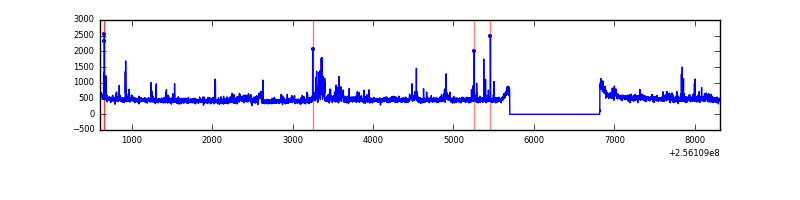 |
Top three noisy pixels from each quadrant. If the there are fewer than three noisy pixels in the level2.evt file, extra rows are filled as -1
| Pixel properties | Quadrant properties | ||||||
|---|---|---|---|---|---|---|---|
| Quadrant | DetID | PixID | Counts | Sigma | Mean | Median | Sigma |
| A | 12 | 189 | 105442 | 632.31 | 819 | 802 | 165.5 |
| A | 15 | 222 | 18927 | 109.52 | 819 | 802 | 165.5 |
| A | 8 | 15 | 9493 | 52.52 | 819 | 802 | 165.5 |
| B | 4 | 239 | 704818 | 4669.48 | 795 | 775 | 150.8 |
| B | 3 | 64 | 132487 | 873.56 | 795 | 775 | 150.8 |
| B | 0 | 219 | 74089 | 486.25 | 795 | 775 | 150.8 |
| C | 14 | 234 | 9851 | 50.65 | 779 | 784 | 179.0 |
| C | 13 | 61 | 5587 | 26.83 | 779 | 784 | 179.0 |
| C | 3 | 202 | 1957 | 6.55 | 779 | 784 | 179.0 |
| D | 1 | 52 | 109765 | 549.23 | 781 | 762 | 198.5 |
| D | 13 | 172 | 59795 | 297.45 | 781 | 762 | 198.5 |
| D | 13 | 104 | 35592 | 175.49 | 781 | 762 | 198.5 |
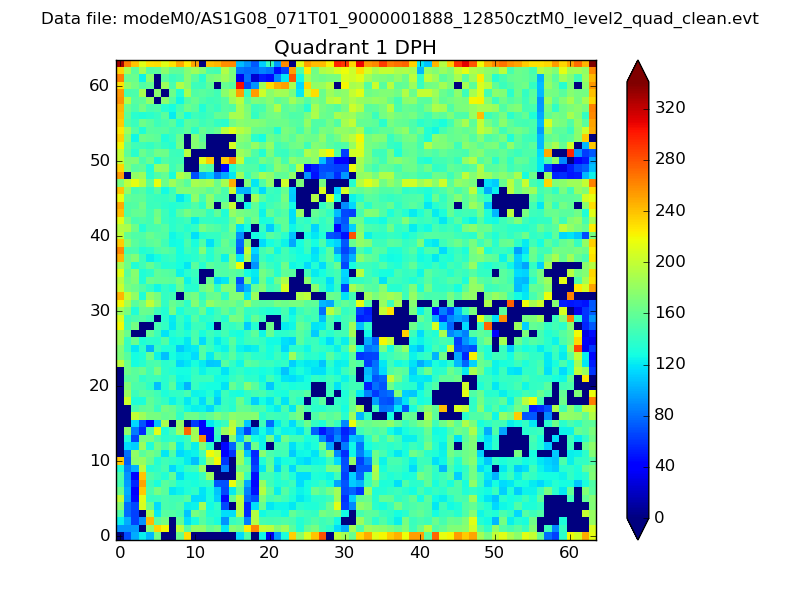
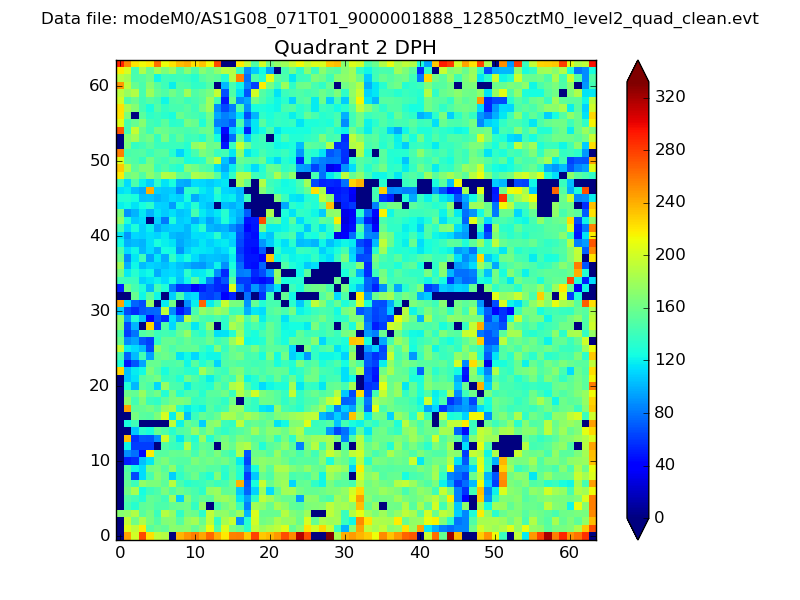
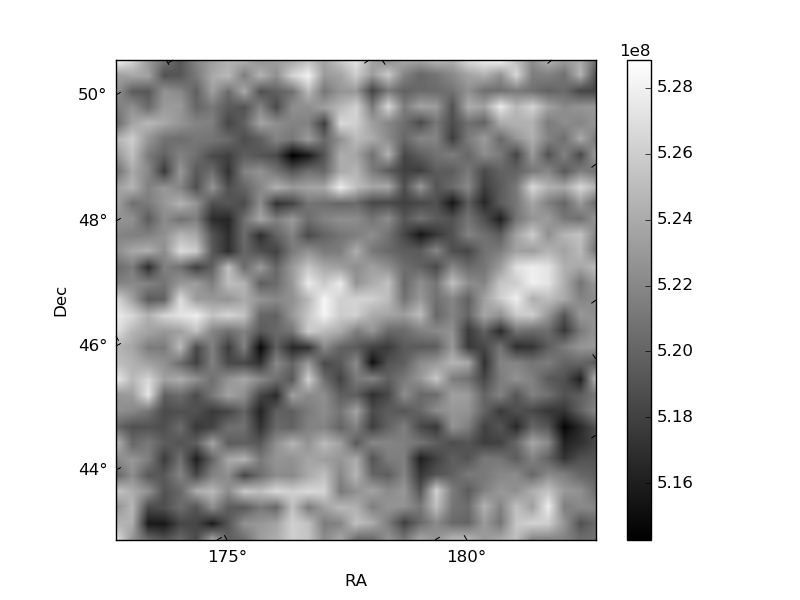
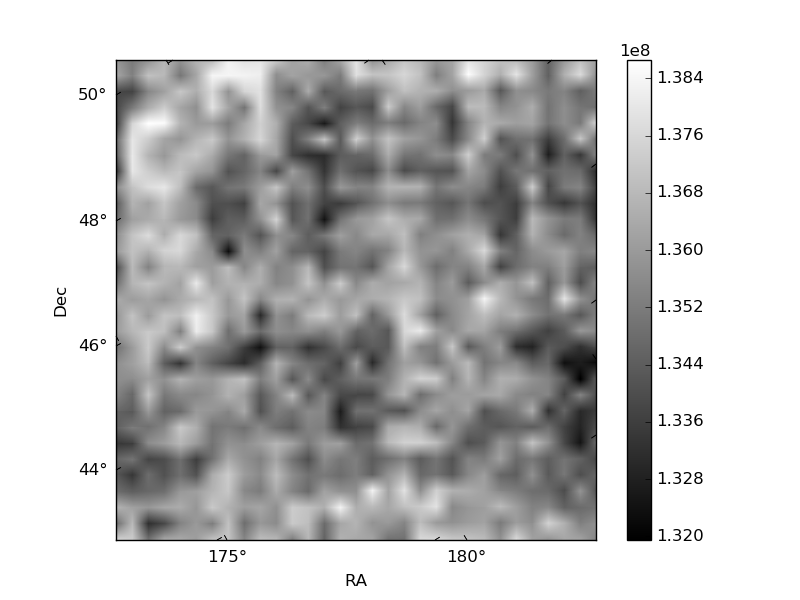
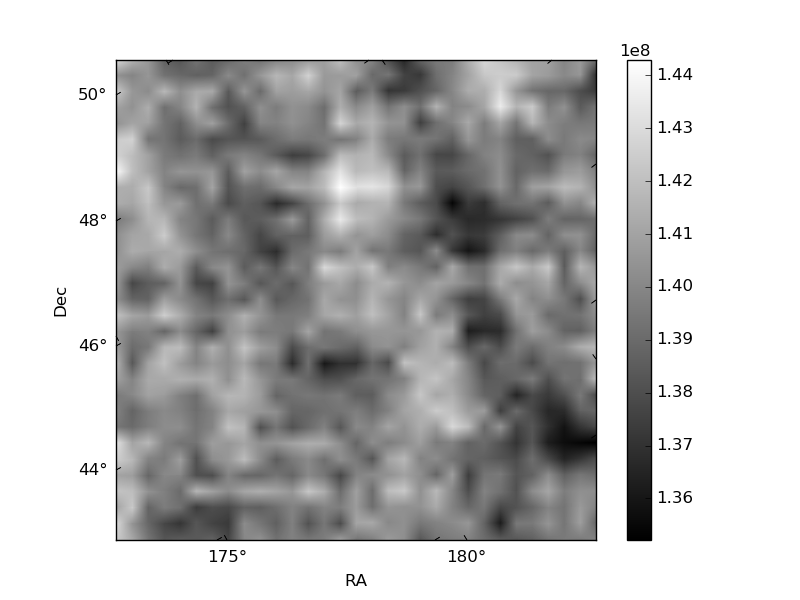
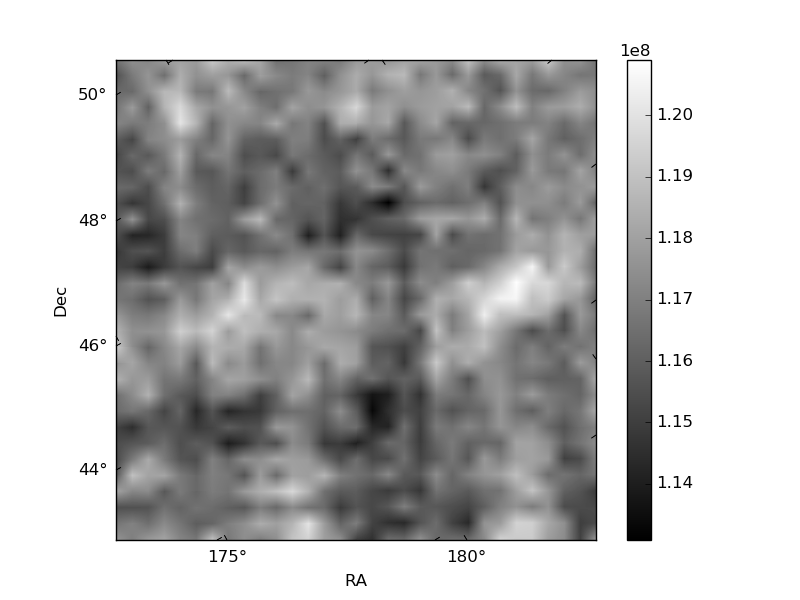
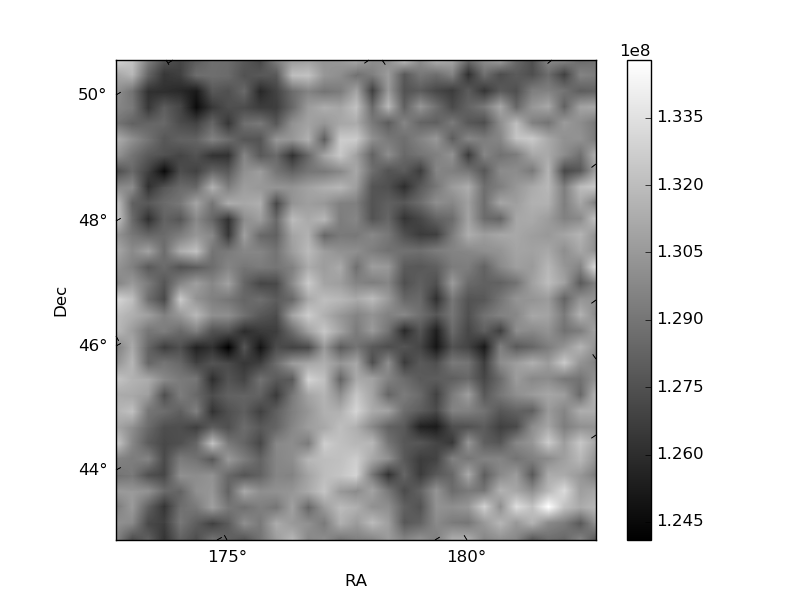
Histogram calculated using DETX and DETY for each event in the final _common_clean file
| Quadrant A |  |
 |
Quadrant B |
|---|---|---|---|
| Quadrant D | 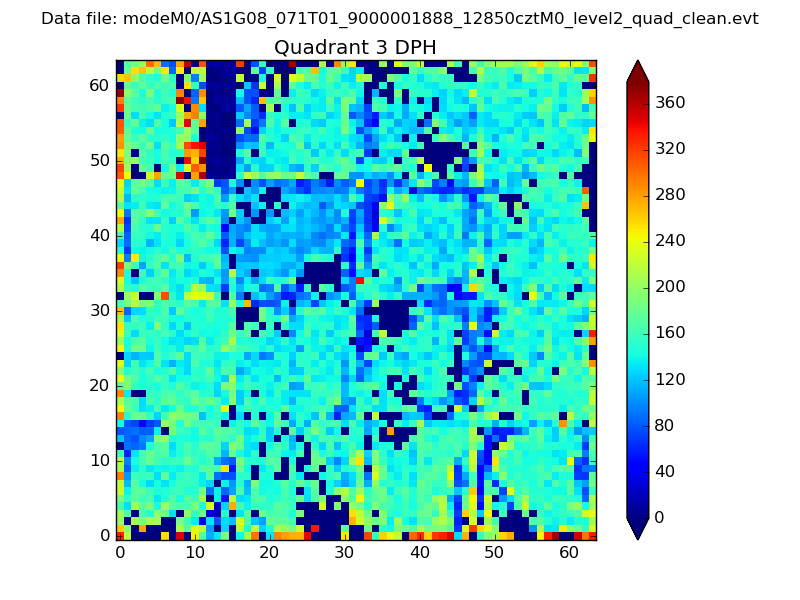 |
 |
Quadrant C |
| Plot type | Count rate plots | Images |
|---|---|---|
| Comparison with Poisson distribution Blue bars denote a histogram of data divided into 1 sec bins. Red curve is a Poisson curve with rate = median count rate of data. |
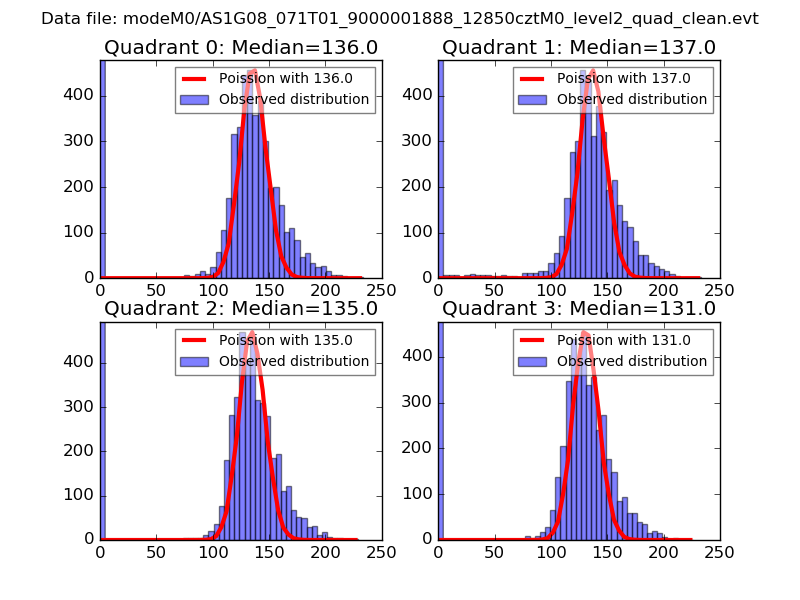 |
 |
| Quadrant-wise count rates Data is divided into 100 sec bins |
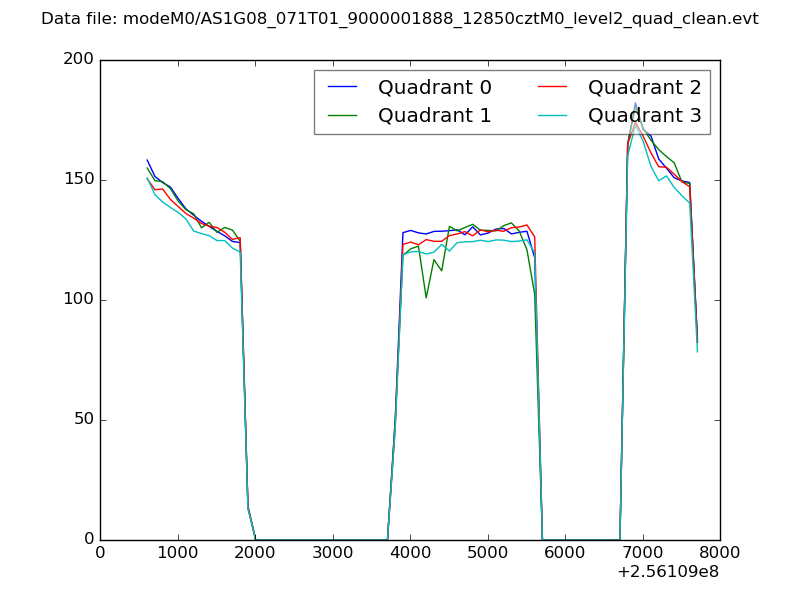 |
|
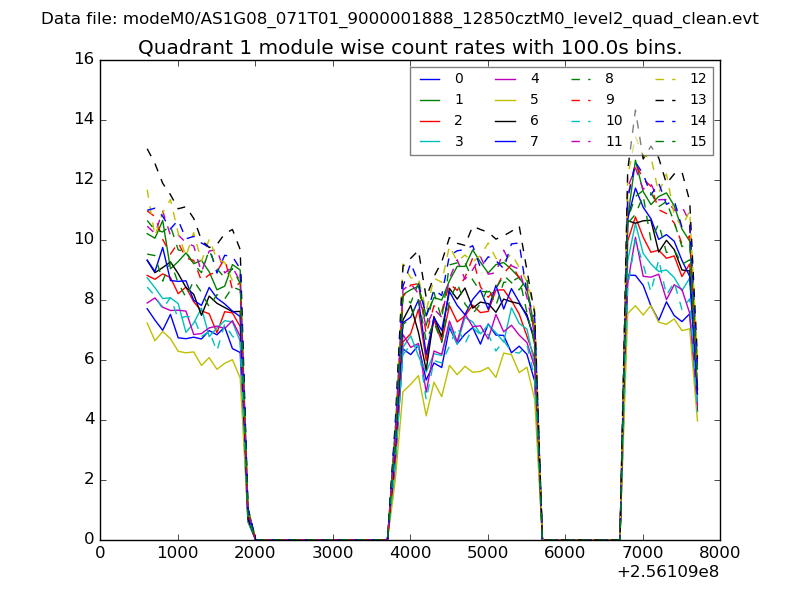
| Module-wise count rates for Quadrant A Data is divided into 100 sec bins |
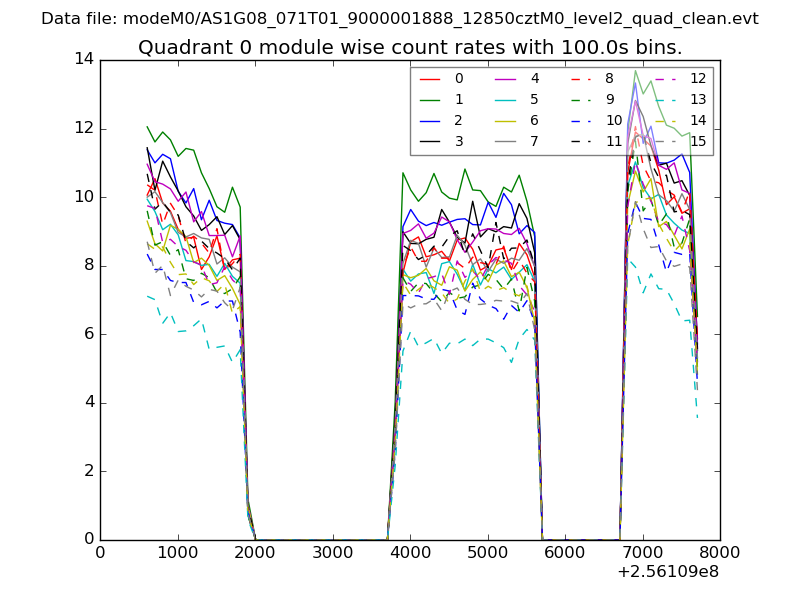 |
 |
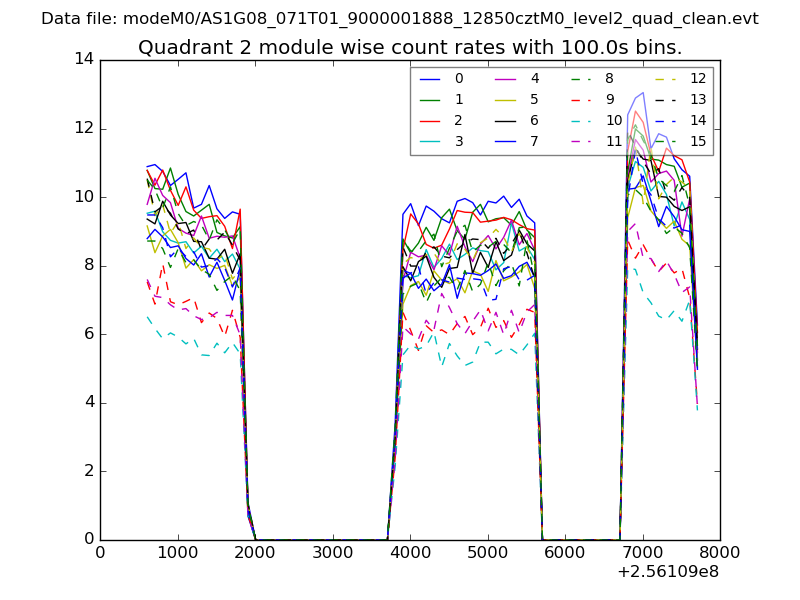
| Module-wise count rates for Quadrant B Data is divided into 100 sec bins |
 |
 |
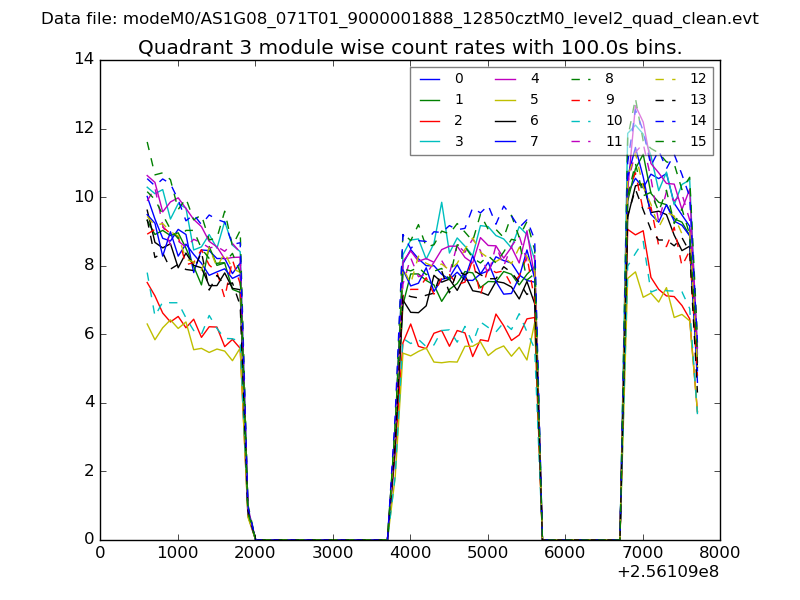
| Module-wise count rates for Quadrant C Data is divided into 100 sec bins |
 |
 |
| Module-wise count rates for Quadrant D Data is divided into 100 sec bins |
 |
 |
| Parameter | Plot |
|---|---|
| CZT HV Monitor | 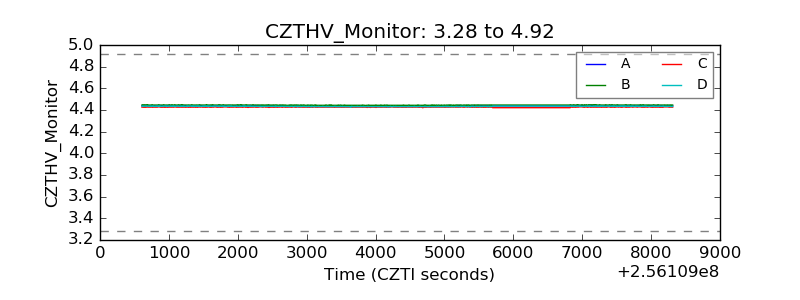 |
| D_VDD | 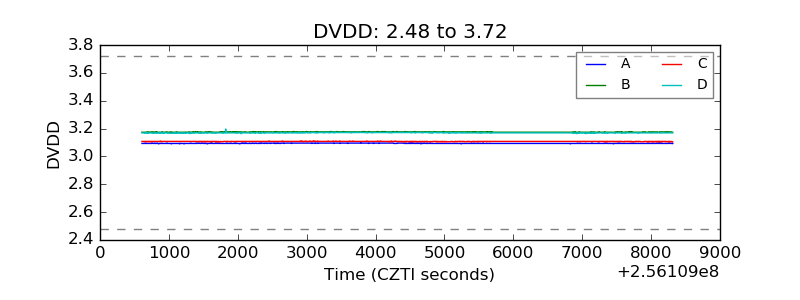 |
| Temperature 1 | 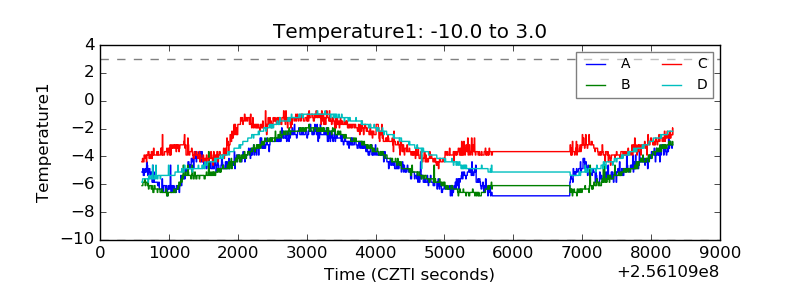 |
| Veto HV Monitor | 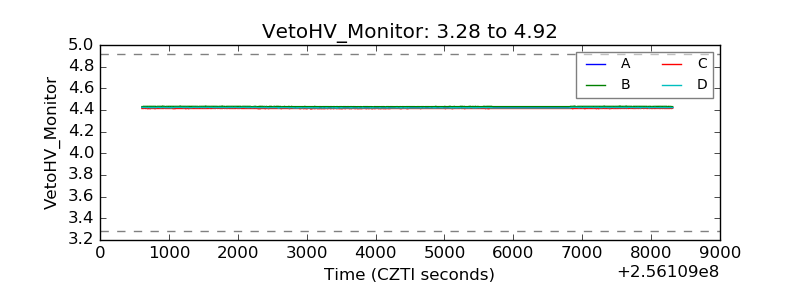 |
| Veto LLD | 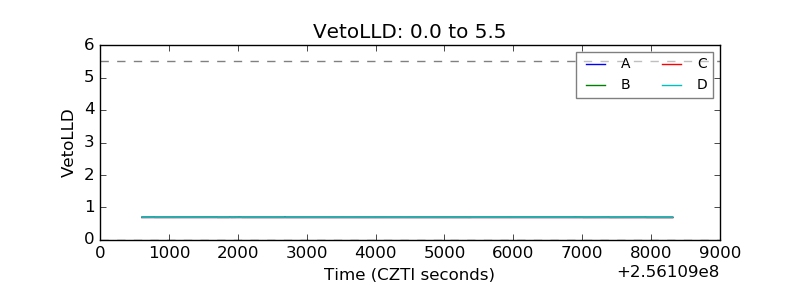 |
| Alpha Counter |  |
| _CPM_Rate | 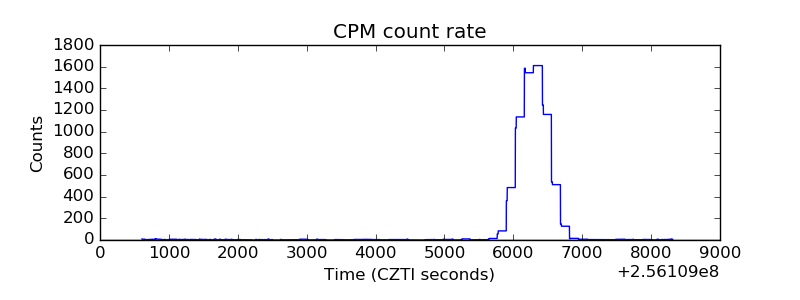 |
| CZT Counter | 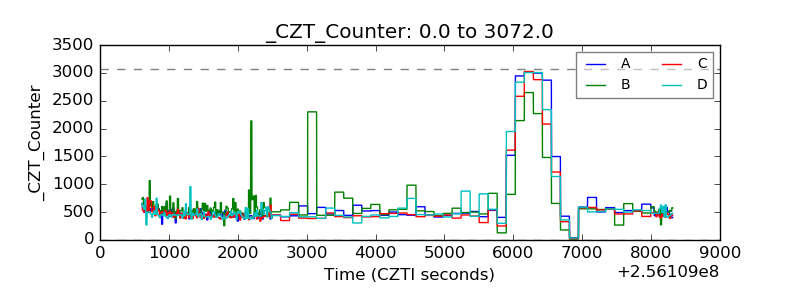 |
| +2.5 Volts monitor |  |
| +5 Volts monitor |  |
| _ROLL_ROT | 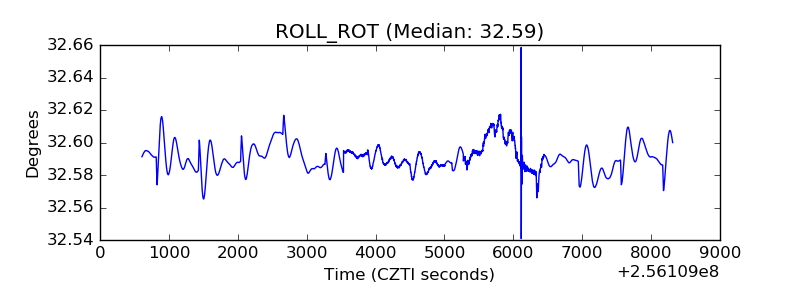 |
| _Roll_DEC | 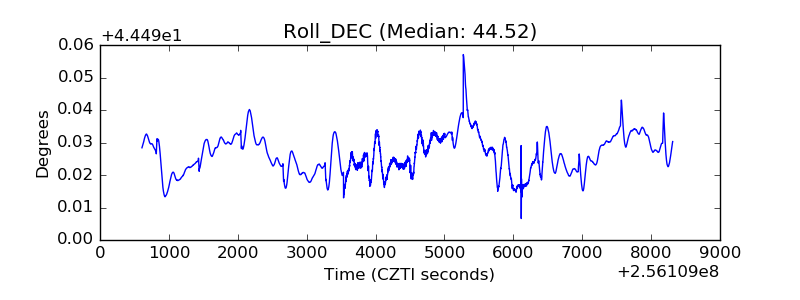 |
| _Roll_RA | 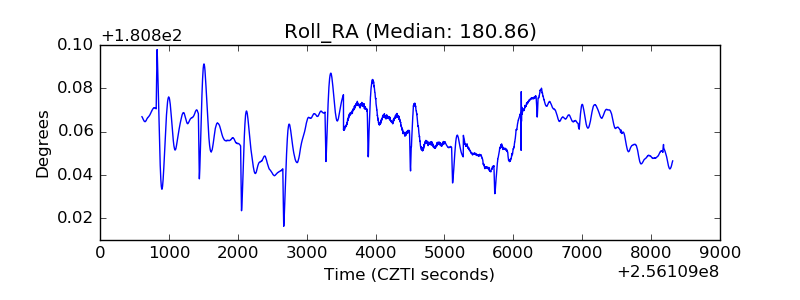 |
| Veto Counter | 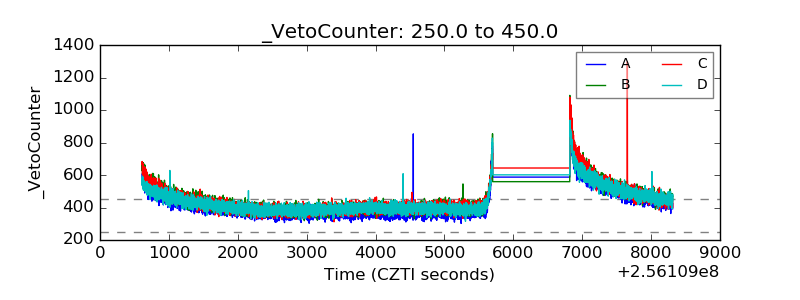 |