| Param | Original file | Final file |
|---|---|---|
| Filename | modeM0/AS1G08_071T01_9000001888_12852cztM0_level2.evt | modeM0/AS1G08_071T01_9000001888_12852cztM0_level2_quad_clean.evt |
| Size (bytes) | 486,564,480 | 68,826,240 |
| Size | 464.0 MB | 65.6 MB |
| Events in quadrant A | 3,367,394 | 418,131 |
| Events in quadrant B | 4,473,133 | 413,326 |
| Events in quadrant C | 3,159,805 | 415,400 |
| Events in quadrant D | 3,312,363 | 401,957 |
| Mode SS | |||
|---|---|---|---|
| Quadrant | BADHDUFLAG | Total packets | Discarded packets |
| A | 0 | 126 | 0 |
| B | 0 | 126 | 0 |
| C | 0 | 126 | 0 |
| D | 0 | 126 | 0 |
| Mode M9 | |||
|---|---|---|---|
| Quadrant | BADHDUFLAG | Total packets | Discarded packets |
| A | 0 | 13 | 0 |
| B | 0 | 13 | 0 |
| C | 0 | 13 | 0 |
| D | 0 | 13 | 0 |
| Mode M0 | |||
|---|---|---|---|
| Quadrant | BADHDUFLAG | Total packets | Discarded packets |
| A | 0 | 13712 | 2 |
| B | 0 | 17363 | 1 |
| C | 0 | 13073 | 1 |
| D | 0 | 13660 | 1 |
| Quadrant | Total seconds | Saturated seconds | Saturation percentage |
|---|---|---|---|
| A | 6235 | 103 | 1.651965% |
| B | 6235 | 438 | 7.024860% |
| C | 6235 | 79 | 1.267041% |
| D | 6235 | 79 | 1.267041% |
Noise dominated data is calculated using 1-second bins in cleaned event files. If a bin has >2000 counts, and if more than 50% of those come from <1% of pixels, then it is considered to be noise-dominated and hence unusable.
| Quadrant | # 1 sec bins | Bins with >0 counts | Bins with >2000 counts | High rate bins dominated by noise | Noise dominated (total time) | Noise dominated (detector-on time) | Marked lightcurve |
|---|---|---|---|---|---|---|---|
| A | 7521 | 6237 | 0 | 0 | 0.00% | 0.00% | 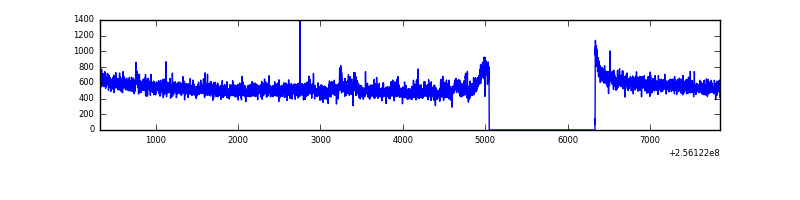 |
| B | 7521 | 6237 | 218 | 218 | 2.90% | 3.50% | 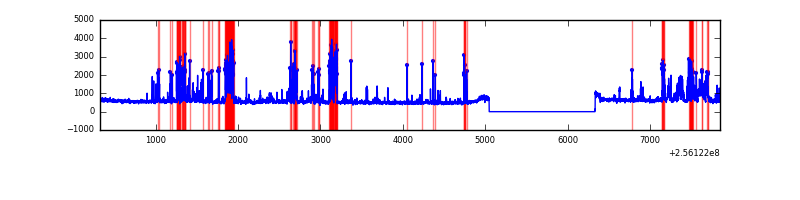 |
| C | 7521 | 6237 | 1 | 1 | 0.01% | 0.02% | 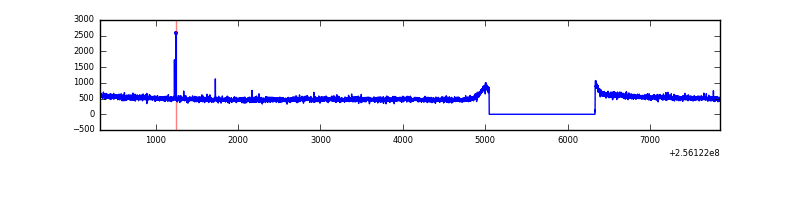 |
| D | 7521 | 6237 | 6 | 6 | 0.08% | 0.10% | 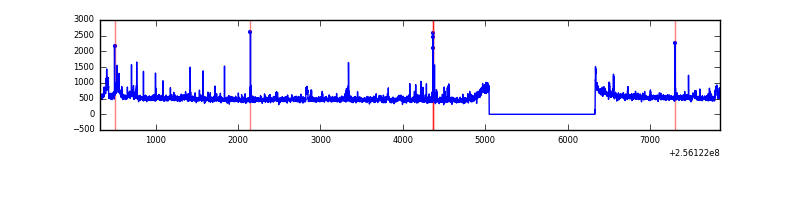 |
Top three noisy pixels from each quadrant. If the there are fewer than three noisy pixels in the level2.evt file, extra rows are filled as -1
| Pixel properties | Quadrant properties | ||||||
|---|---|---|---|---|---|---|---|
| Quadrant | DetID | PixID | Counts | Sigma | Mean | Median | Sigma |
| A | 12 | 189 | 111271 | 653.63 | 845 | 830 | 169.0 |
| A | 8 | 15 | 7627 | 40.23 | 845 | 830 | 169.0 |
| A | 0 | 226 | 7609 | 40.12 | 845 | 830 | 169.0 |
| B | 4 | 239 | 894722 | 5923.64 | 814 | 797 | 150.9 |
| B | 0 | 85 | 162206 | 1069.59 | 814 | 797 | 150.9 |
| B | 0 | 219 | 78312 | 513.66 | 814 | 797 | 150.9 |
| C | 13 | 61 | 6056 | 28.59 | 808 | 812 | 183.4 |
| C | 14 | 234 | 5871 | 27.58 | 808 | 812 | 183.4 |
| C | 4 | 112 | 3139 | 12.69 | 808 | 812 | 183.4 |
| D | 1 | 52 | 140694 | 728.0 | 813 | 793 | 192.2 |
| D | 13 | 104 | 40674 | 207.53 | 813 | 793 | 192.2 |
| D | 4 | 95 | 33739 | 171.44 | 813 | 793 | 192.2 |
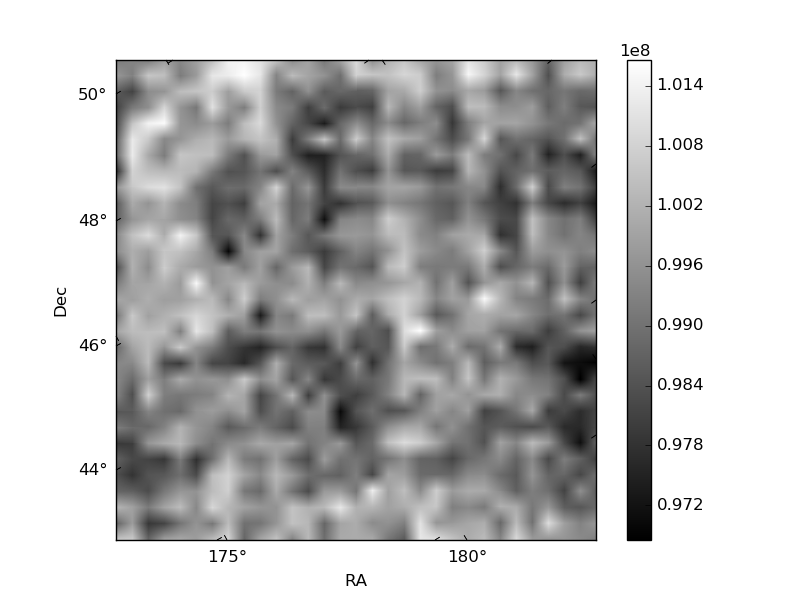
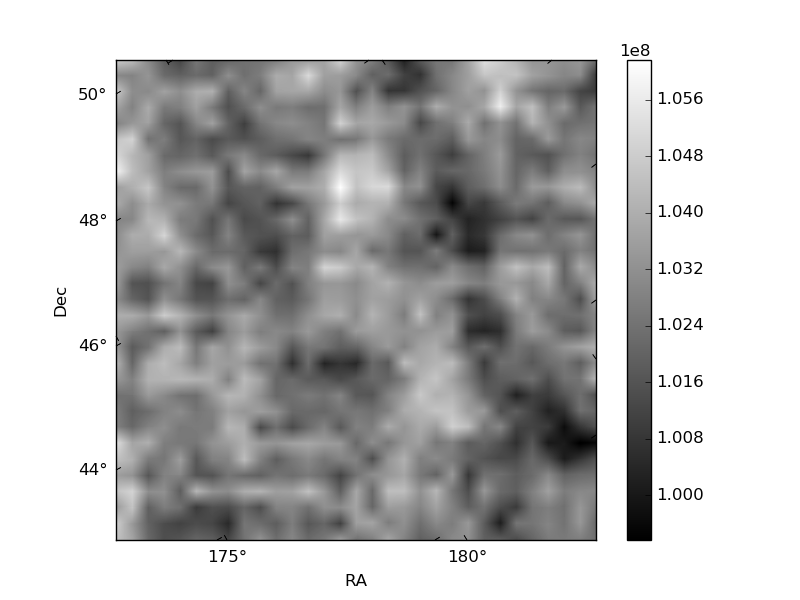
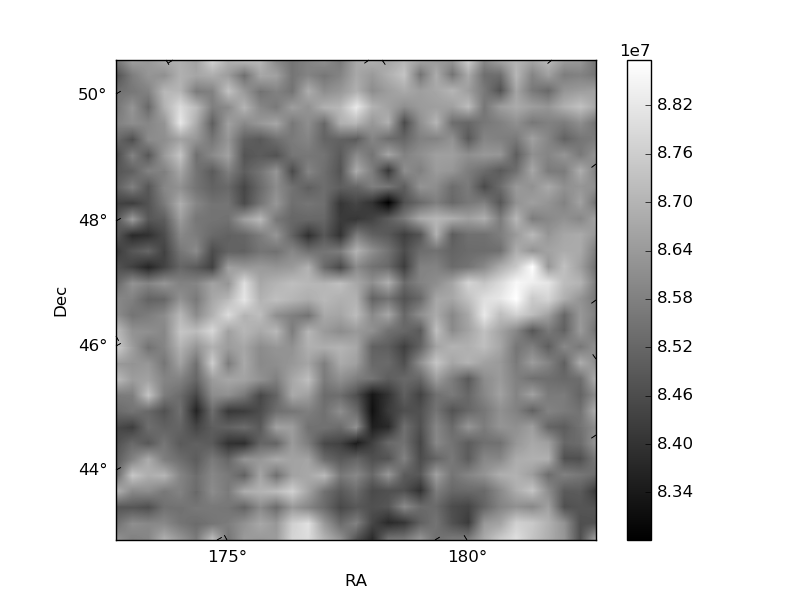
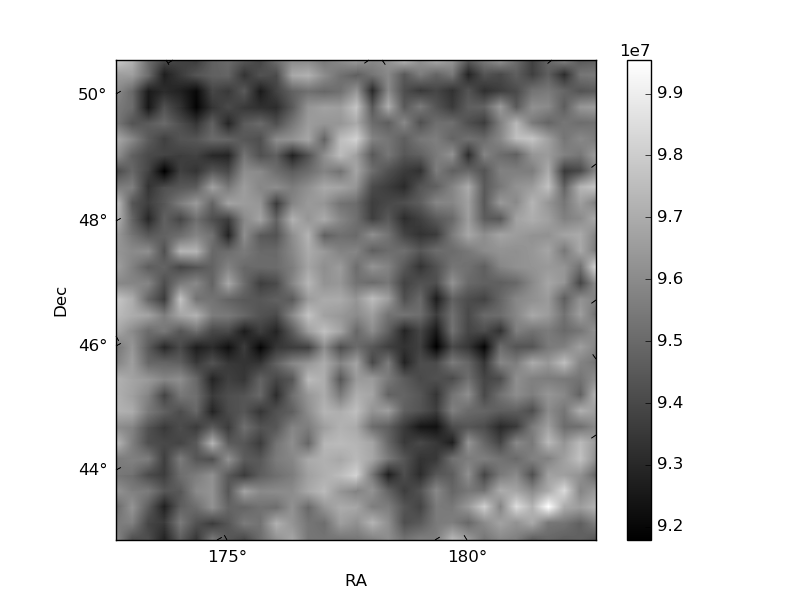
Histogram calculated using DETX and DETY for each event in the final _common_clean file
| Quadrant A |  |
 |
Quadrant B |
|---|---|---|---|
| Quadrant D |  |
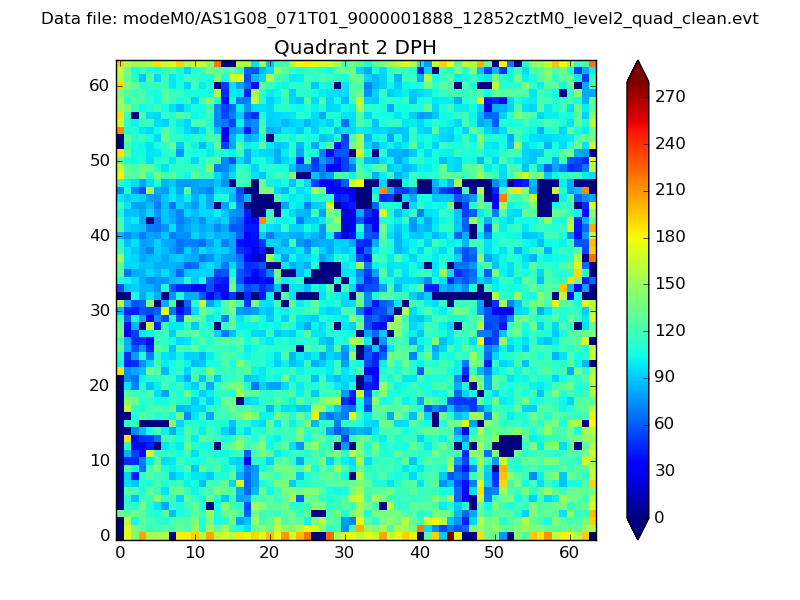 |
Quadrant C |
| Plot type | Count rate plots | Images |
|---|---|---|
| Comparison with Poisson distribution Blue bars denote a histogram of data divided into 1 sec bins. Red curve is a Poisson curve with rate = median count rate of data. |
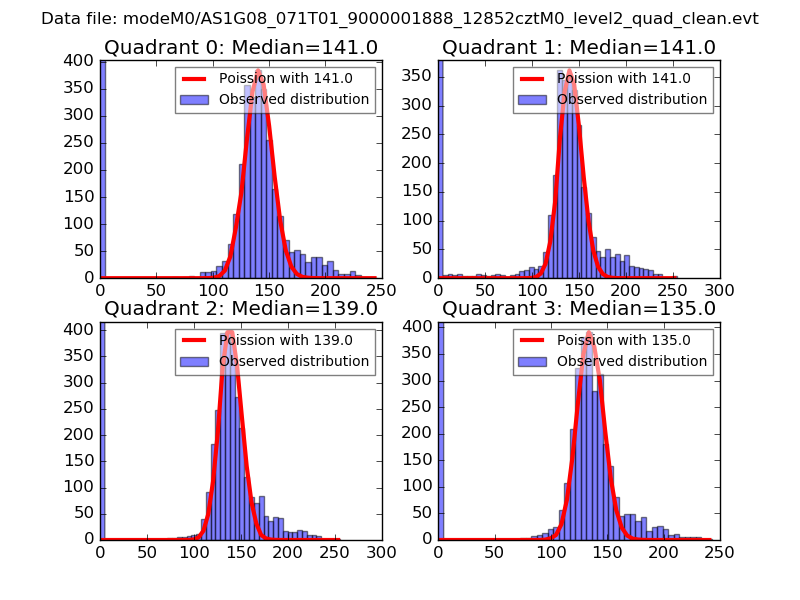 |
 |
| Quadrant-wise count rates Data is divided into 100 sec bins |
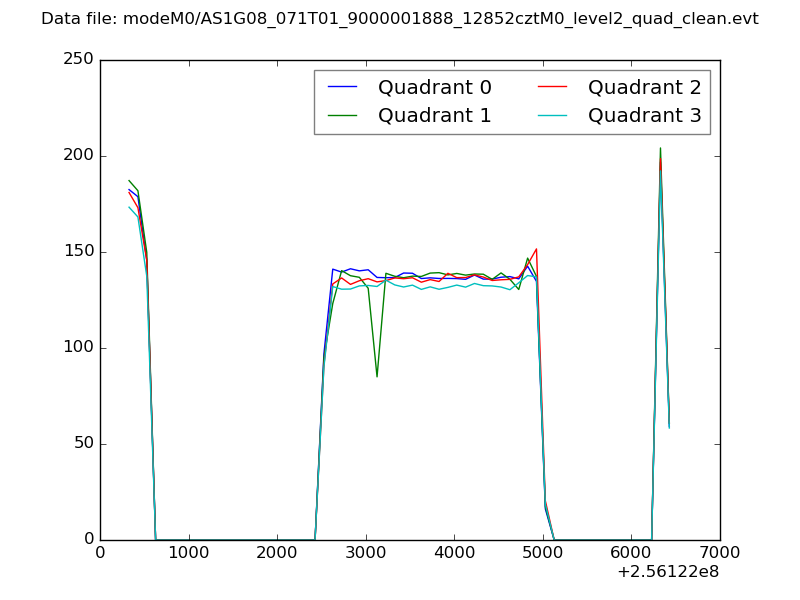 |
|
| Module-wise count rates for Quadrant A Data is divided into 100 sec bins |
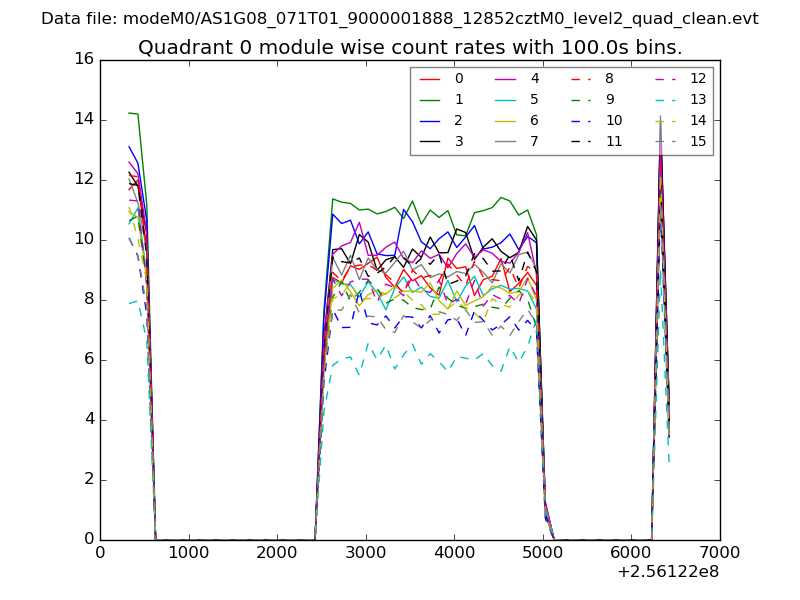 |
 |
| Module-wise count rates for Quadrant B Data is divided into 100 sec bins |
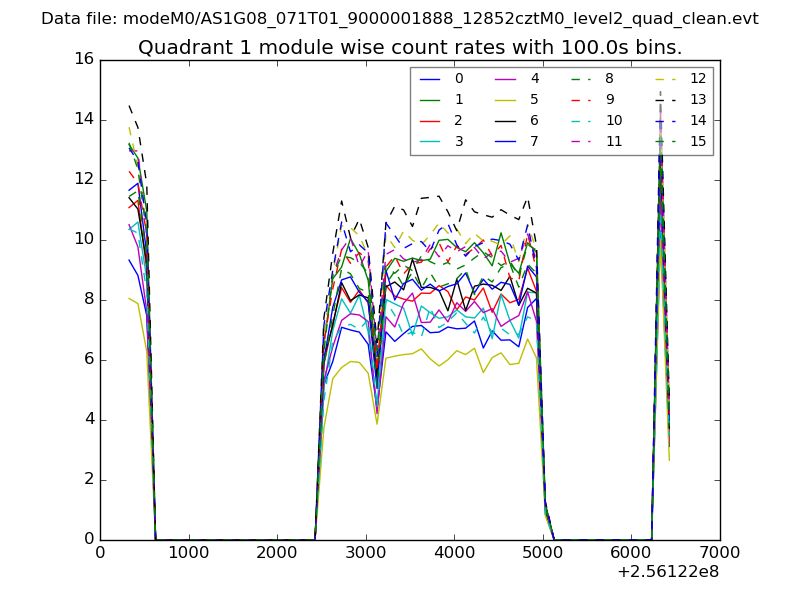 |
 |
| Module-wise count rates for Quadrant C Data is divided into 100 sec bins |
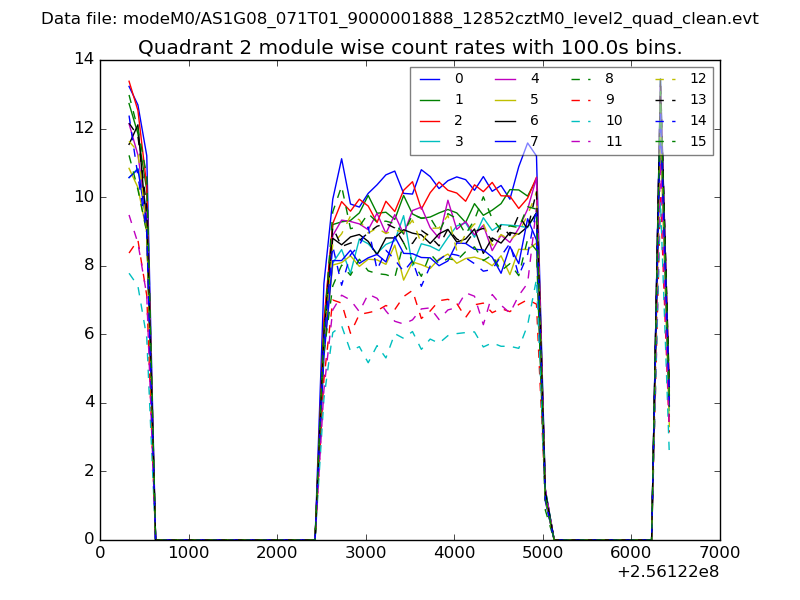 |
 |
| Module-wise count rates for Quadrant D Data is divided into 100 sec bins |
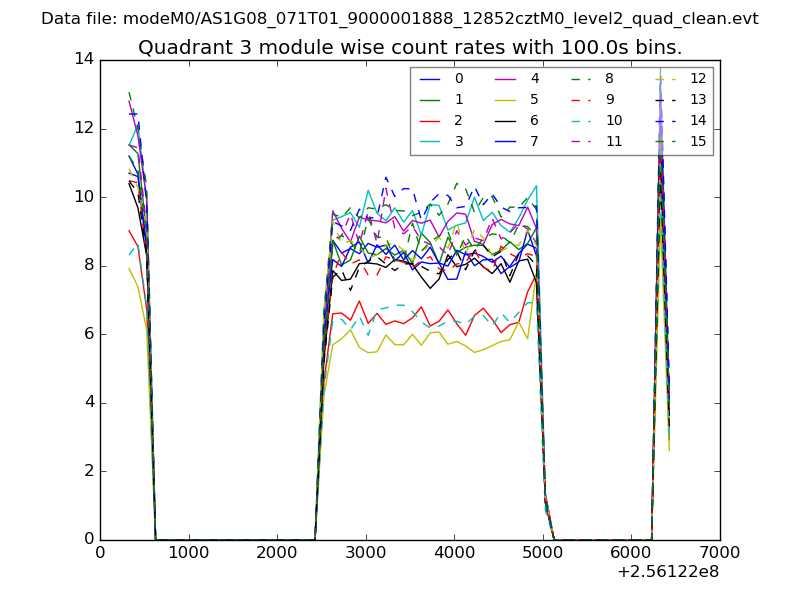 |
 |
| Parameter | Plot |
|---|---|
| CZT HV Monitor | 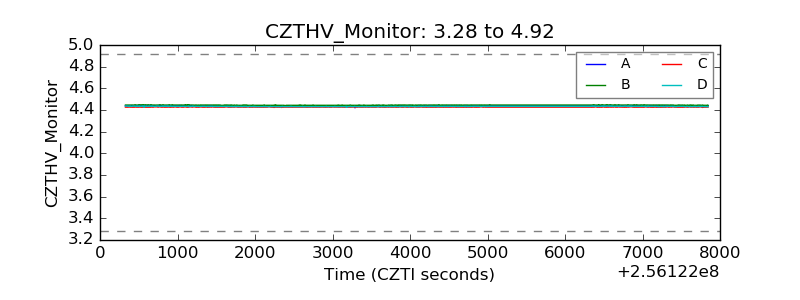 |
| D_VDD | 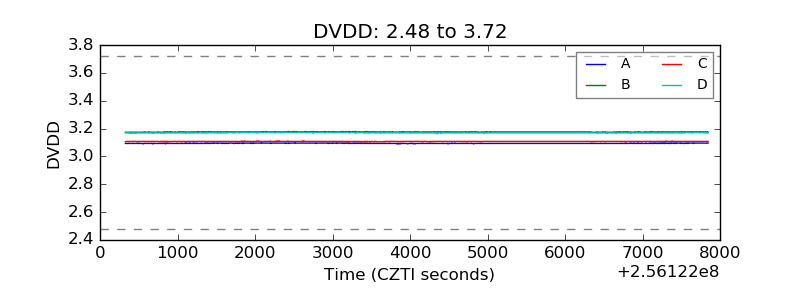 |
| Temperature 1 | 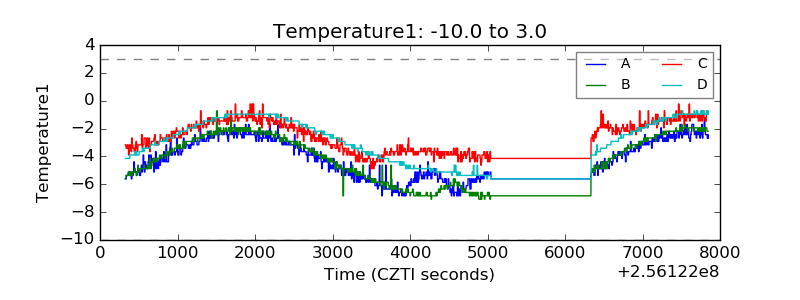 |
| Veto HV Monitor | 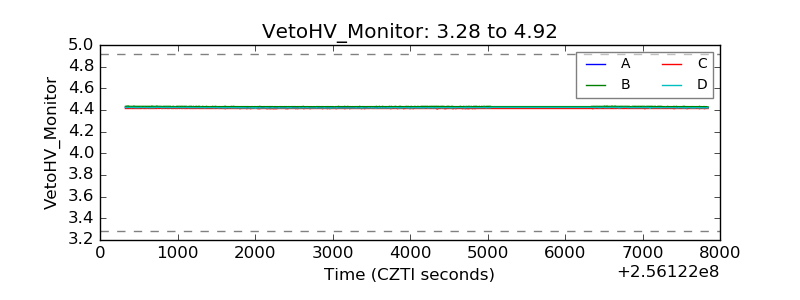 |
| Veto LLD | 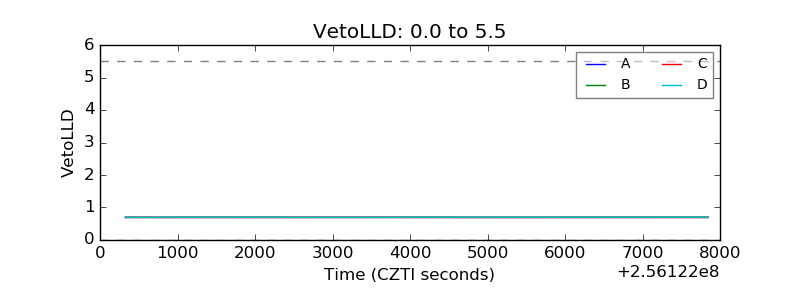 |
| Alpha Counter | 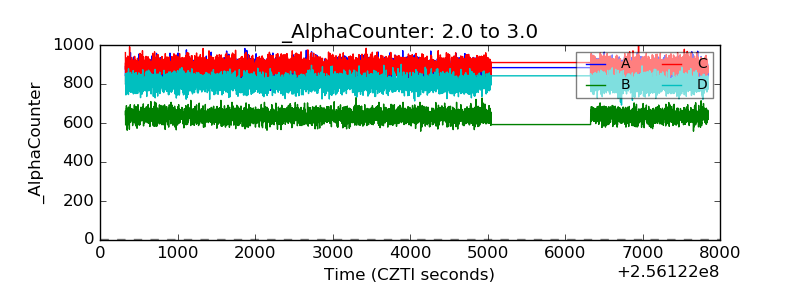 |
| _CPM_Rate | 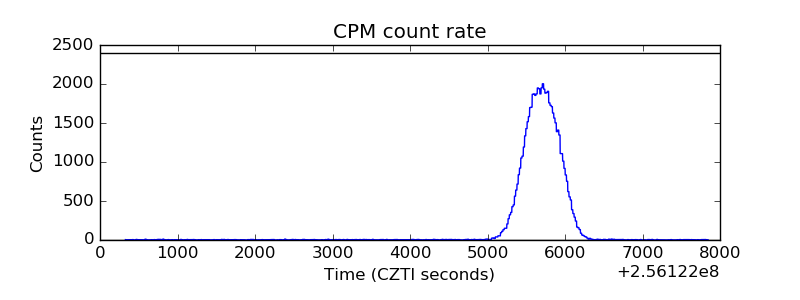 |
| CZT Counter | 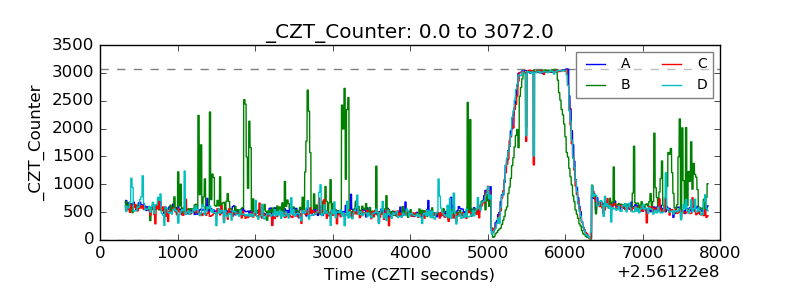 |
| +2.5 Volts monitor | 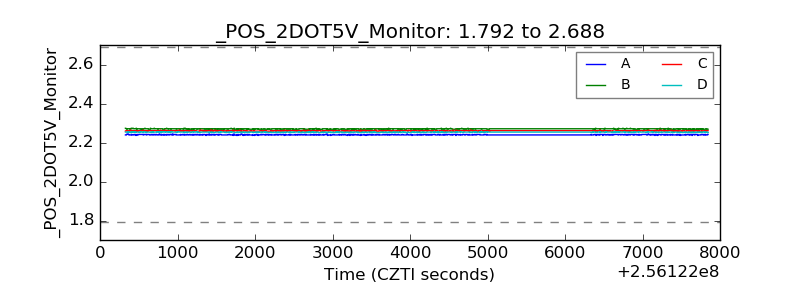 |
| +5 Volts monitor |  |
| _ROLL_ROT | 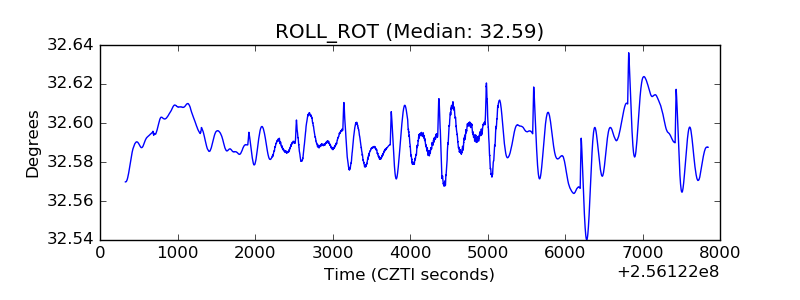 |
| _Roll_DEC | 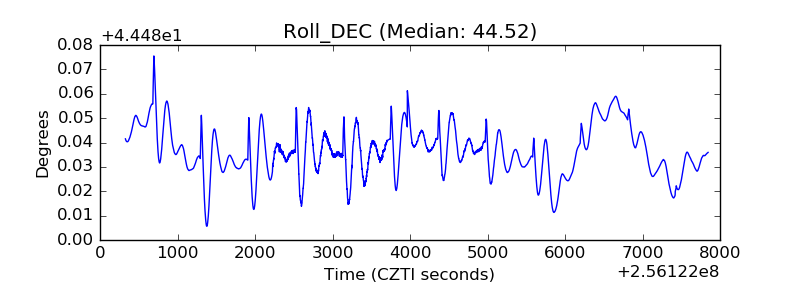 |
| _Roll_RA | 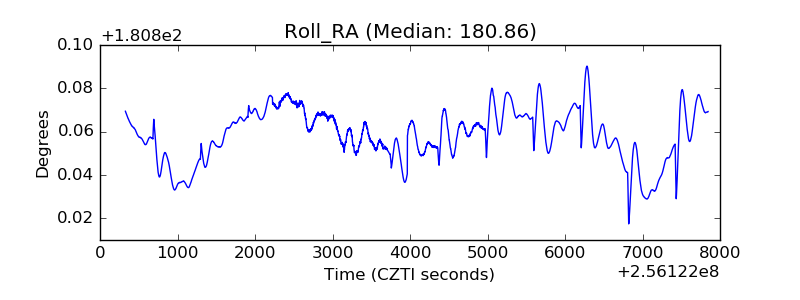 |
| Veto Counter | 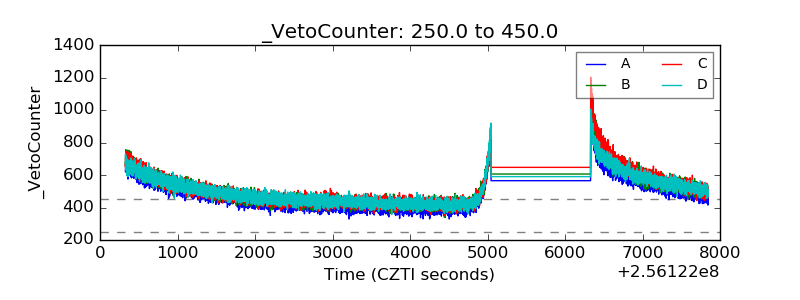 |