| Param | Original file | Final file |
|---|---|---|
| Filename | modeM0/AS1G08_071T01_9000001888_12853cztM0_level2.evt | modeM0/AS1G08_071T01_9000001888_12853cztM0_level2_quad_clean.evt |
| Size (bytes) | 529,168,320 | 70,148,160 |
| Size | 504.7 MB | 66.9 MB |
| Events in quadrant A | 3,471,220 | 425,610 |
| Events in quadrant B | 4,762,833 | 417,678 |
| Events in quadrant C | 3,329,222 | 423,099 |
| Events in quadrant D | 4,023,887 | 406,360 |
| Mode SS | |||
|---|---|---|---|
| Quadrant | BADHDUFLAG | Total packets | Discarded packets |
| A | 0 | 132 | 0 |
| B | 0 | 132 | 0 |
| C | 0 | 132 | 0 |
| D | 0 | 132 | 0 |
| Mode M9 | |||
|---|---|---|---|
| Quadrant | BADHDUFLAG | Total packets | Discarded packets |
| A | 0 | 15 | 0 |
| B | 0 | 15 | 0 |
| C | 0 | 15 | 0 |
| D | 0 | 16 | 0 |
| Mode M0 | |||
|---|---|---|---|
| Quadrant | BADHDUFLAG | Total packets | Discarded packets |
| A | 0 | 14291 | 3 |
| B | 0 | 18544 | 2 |
| C | 0 | 13737 | 2 |
| D | 0 | 16054 | 2 |
| Quadrant | Total seconds | Saturated seconds | Saturation percentage |
|---|---|---|---|
| A | 6464 | 116 | 1.794554% |
| B | 6464 | 524 | 8.106436% |
| C | 6464 | 80 | 1.237624% |
| D | 6464 | 236 | 3.650990% |
Noise dominated data is calculated using 1-second bins in cleaned event files. If a bin has >2000 counts, and if more than 50% of those come from <1% of pixels, then it is considered to be noise-dominated and hence unusable.
| Quadrant | # 1 sec bins | Bins with >0 counts | Bins with >2000 counts | High rate bins dominated by noise | Noise dominated (total time) | Noise dominated (detector-on time) | Marked lightcurve |
|---|---|---|---|---|---|---|---|
| A | 7785 | 6466 | 0 | 0 | 0.00% | 0.00% | 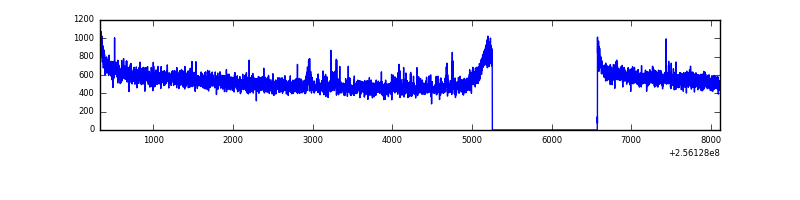 |
| B | 7785 | 6466 | 275 | 275 | 3.53% | 4.25% | 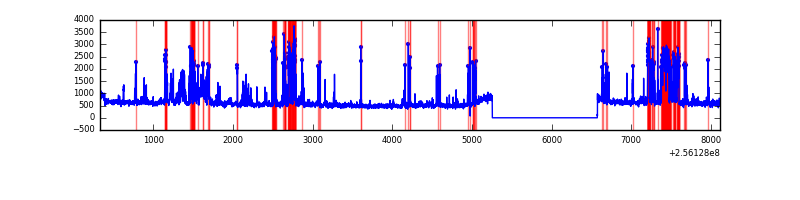 |
| C | 7785 | 6466 | 0 | 0 | 0.00% | 0.00% | 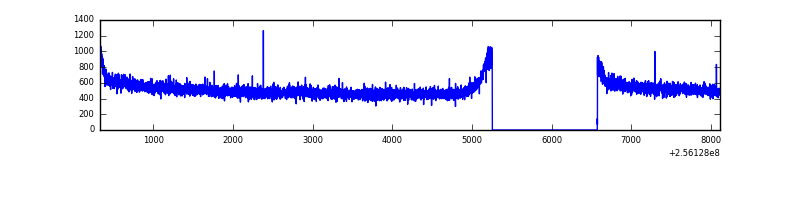 |
| D | 7785 | 6466 | 147 | 147 | 1.89% | 2.27% | 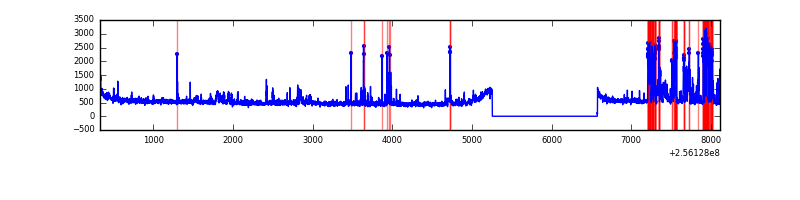 |
Top three noisy pixels from each quadrant. If the there are fewer than three noisy pixels in the level2.evt file, extra rows are filled as -1
| Pixel properties | Quadrant properties | ||||||
|---|---|---|---|---|---|---|---|
| Quadrant | DetID | PixID | Counts | Sigma | Mean | Median | Sigma |
| A | 12 | 189 | 58531 | 329.27 | 886 | 871 | 175.1 |
| A | 0 | 226 | 7902 | 40.15 | 886 | 871 | 175.1 |
| A | 12 | 194 | 7014 | 35.08 | 886 | 871 | 175.1 |
| B | 4 | 239 | 966410 | 6101.96 | 855 | 838 | 158.2 |
| B | 0 | 219 | 129508 | 813.13 | 855 | 838 | 158.2 |
| B | 0 | 85 | 117625 | 738.04 | 855 | 838 | 158.2 |
| C | 13 | 61 | 6306 | 28.03 | 852 | 858 | 194.3 |
| C | 14 | 234 | 3942 | 15.87 | 852 | 858 | 194.3 |
| C | 4 | 175 | 2589 | 8.91 | 852 | 858 | 194.3 |
| D | 1 | 52 | 684664 | 3417.27 | 850 | 830 | 200.1 |
| D | 13 | 104 | 69196 | 341.64 | 850 | 830 | 200.1 |
| D | 4 | 95 | 28951 | 140.53 | 850 | 830 | 200.1 |
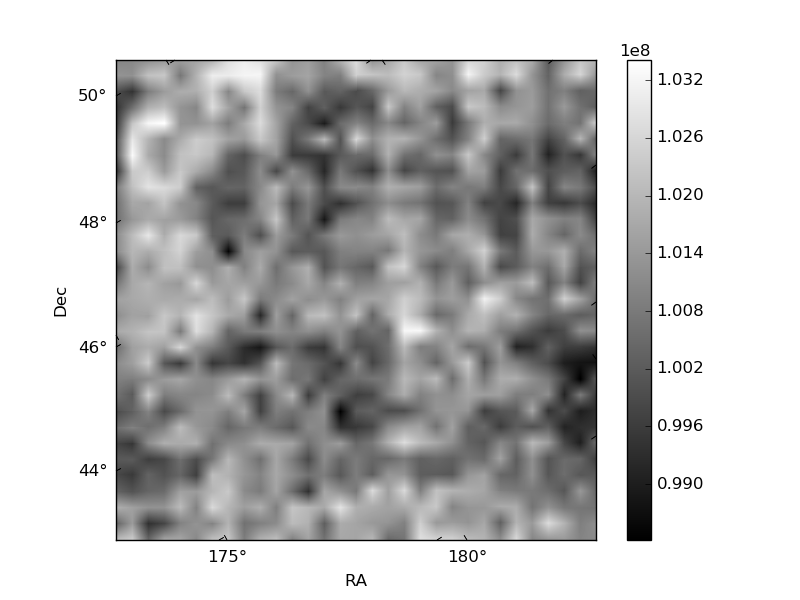
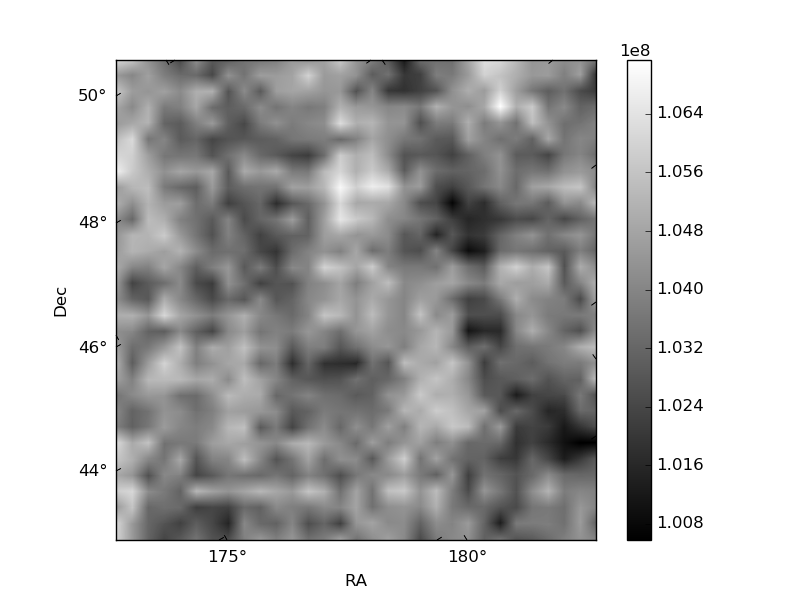
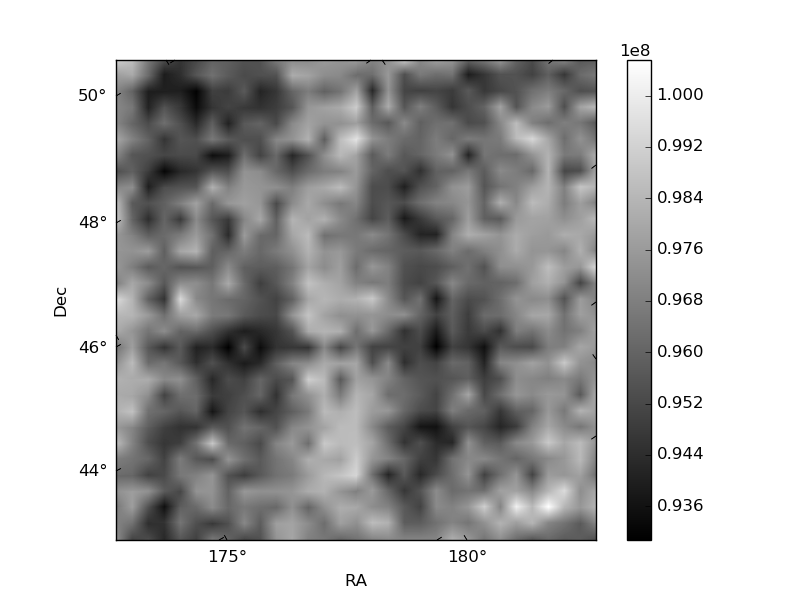
Histogram calculated using DETX and DETY for each event in the final _common_clean file
| Quadrant A | 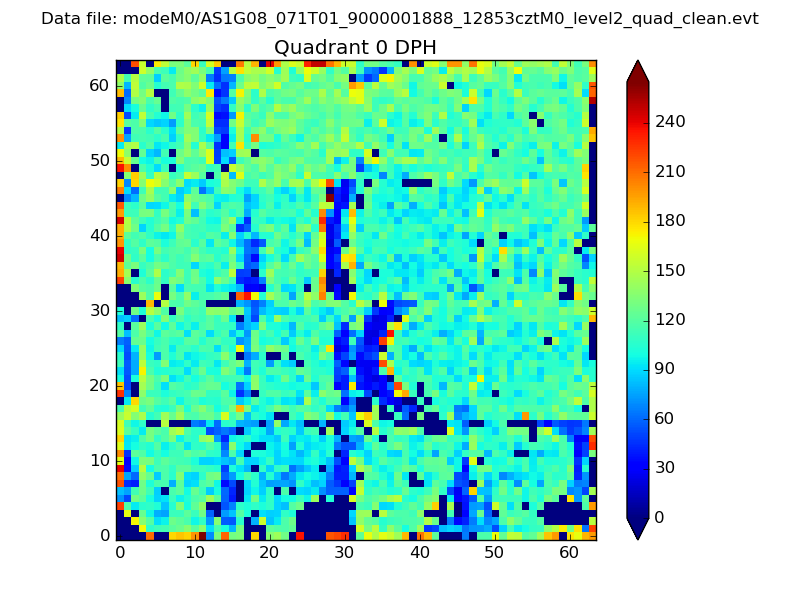 |
 |
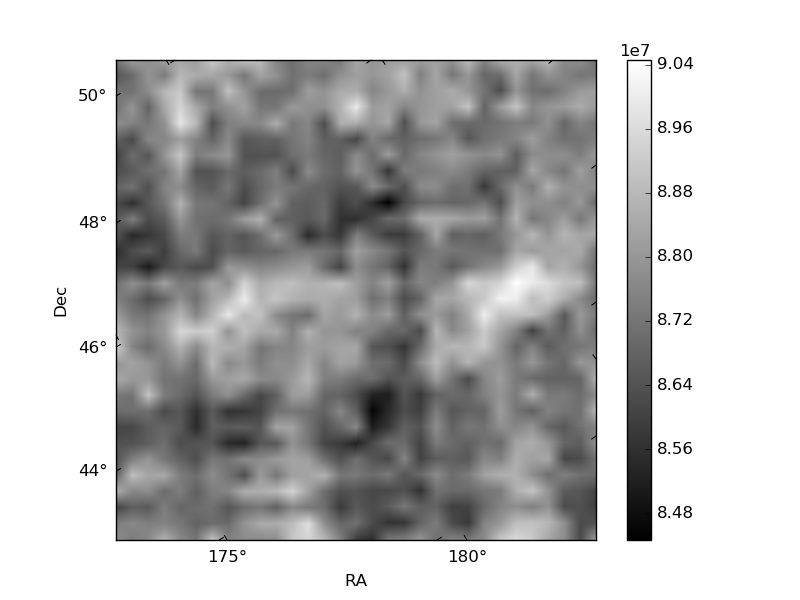
Quadrant B |
|---|---|---|---|
| Quadrant D | 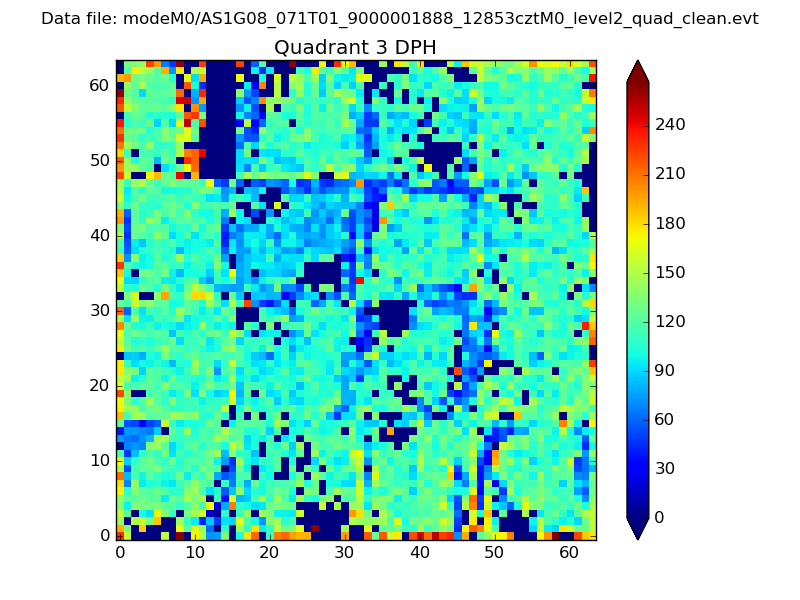 |
 |
Quadrant C |
| Plot type | Count rate plots | Images |
|---|---|---|
| Comparison with Poisson distribution Blue bars denote a histogram of data divided into 1 sec bins. Red curve is a Poisson curve with rate = median count rate of data. |
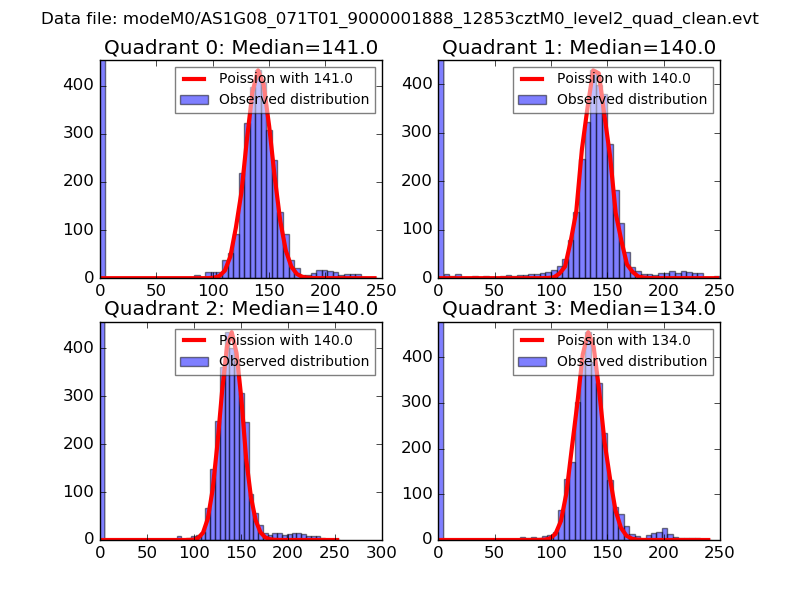 |
 |
| Quadrant-wise count rates Data is divided into 100 sec bins |
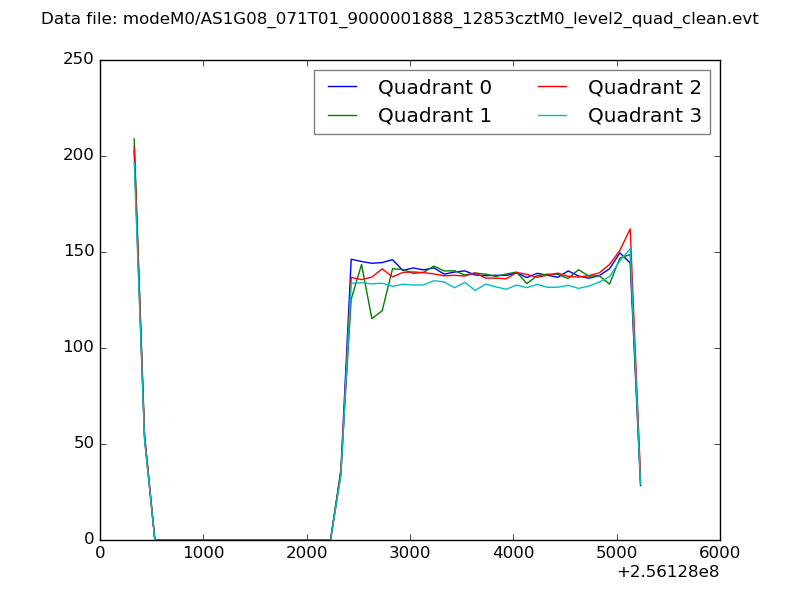 |
|
| Module-wise count rates for Quadrant A Data is divided into 100 sec bins |
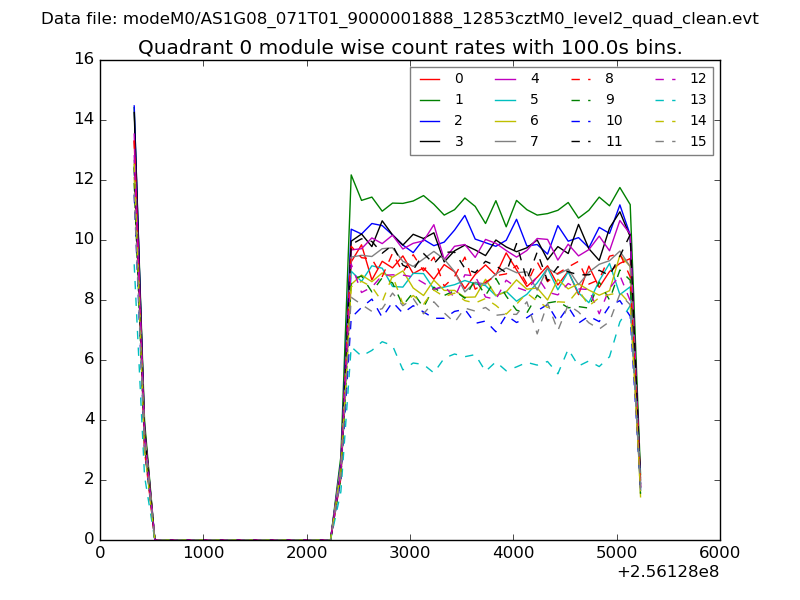 |
 |
| Module-wise count rates for Quadrant B Data is divided into 100 sec bins |
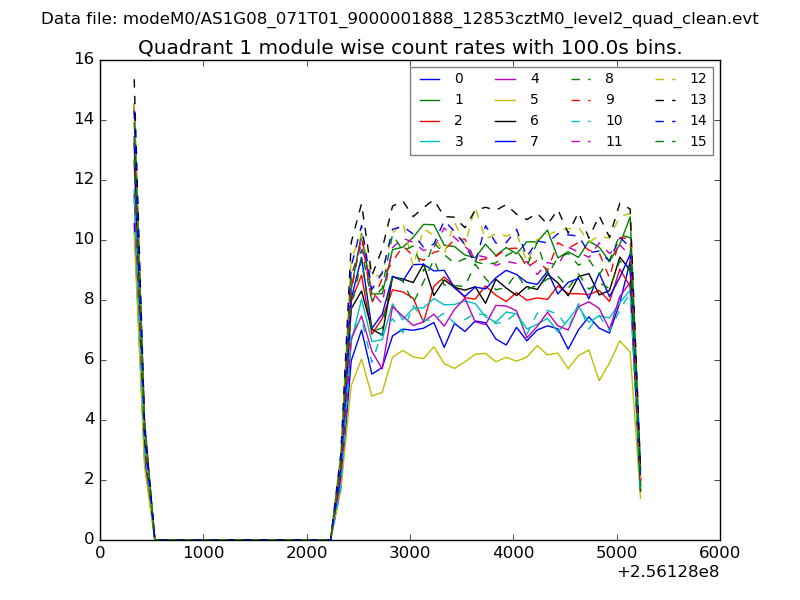 |
 |
| Module-wise count rates for Quadrant C Data is divided into 100 sec bins |
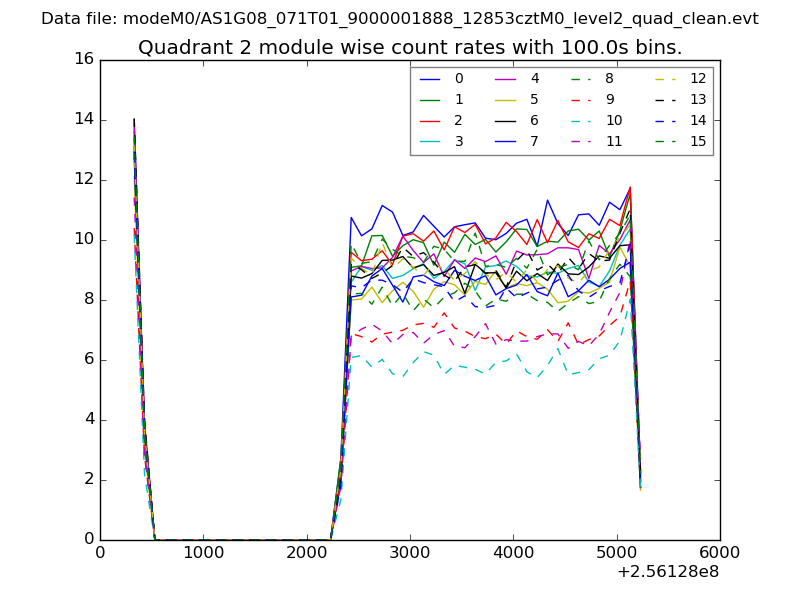 |
 |
| Module-wise count rates for Quadrant D Data is divided into 100 sec bins |
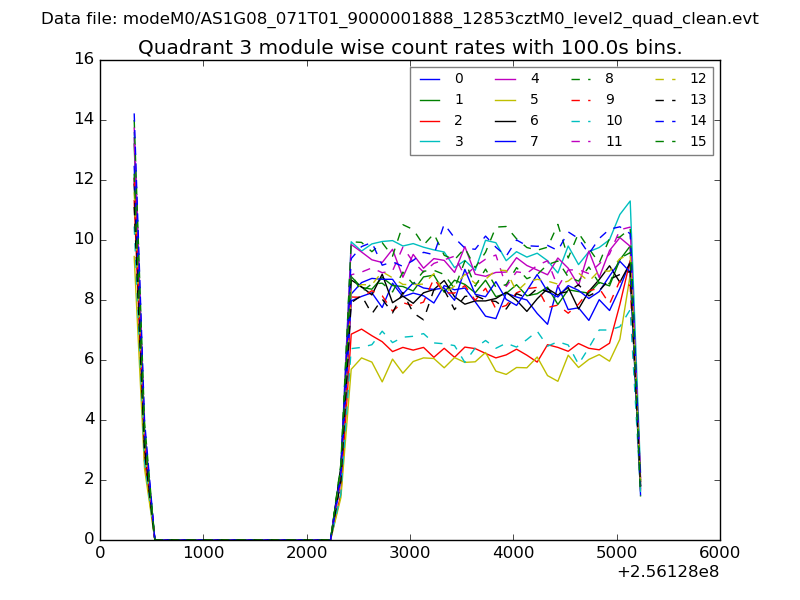 |
 |
| Parameter | Plot |
|---|---|
| CZT HV Monitor | 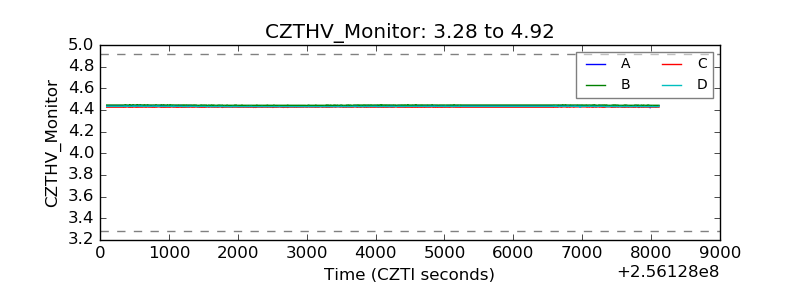 |
| D_VDD | 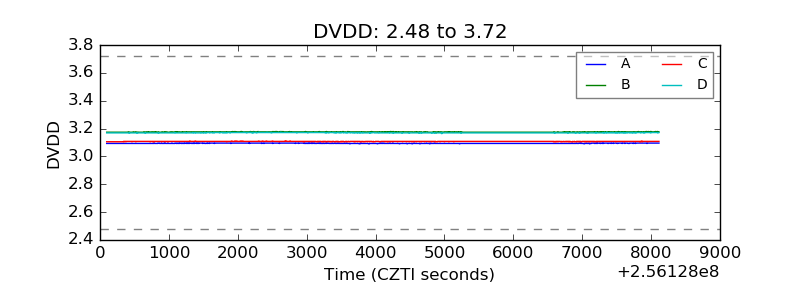 |
| Temperature 1 | 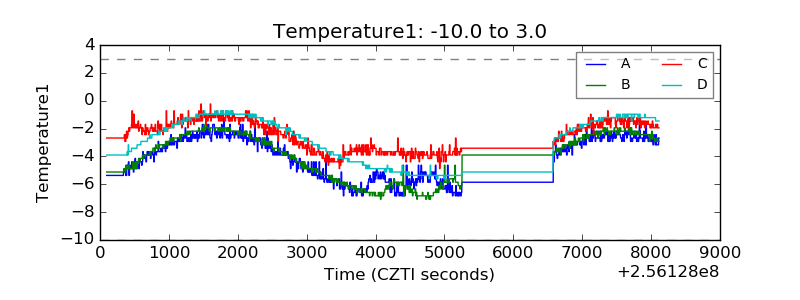 |
| Veto HV Monitor | 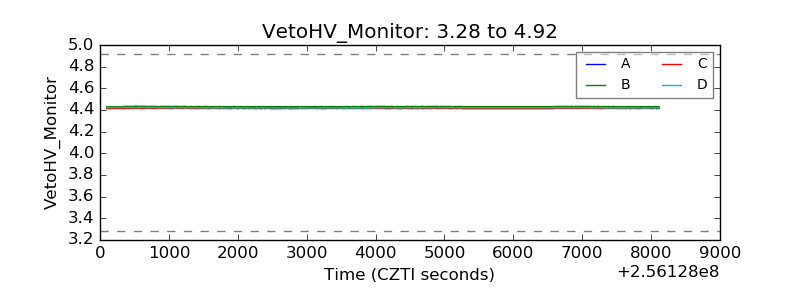 |
| Veto LLD | 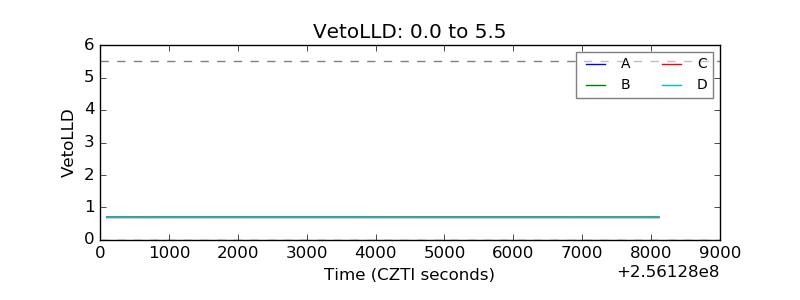 |
| Alpha Counter | 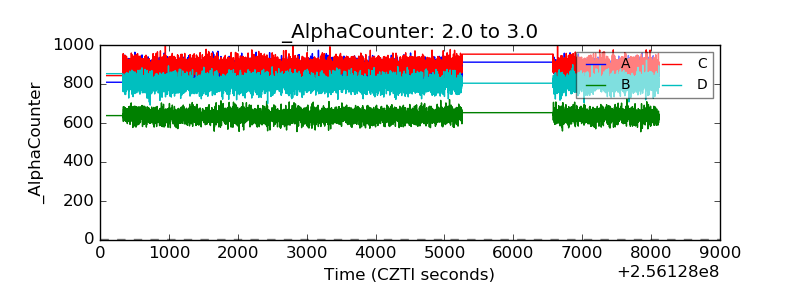 |
| _CPM_Rate | 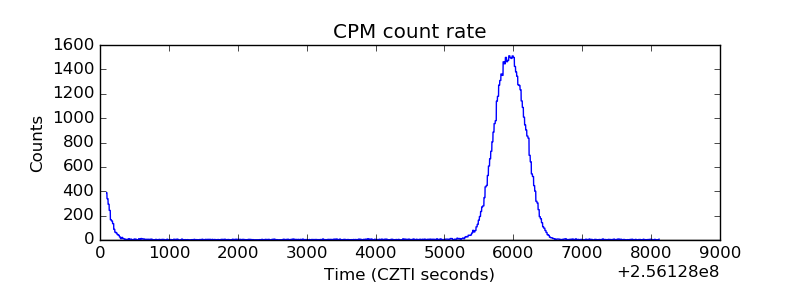 |
| CZT Counter | 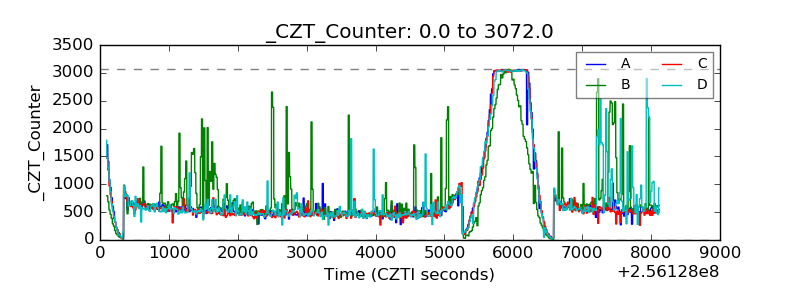 |
| +2.5 Volts monitor |  |
| +5 Volts monitor | 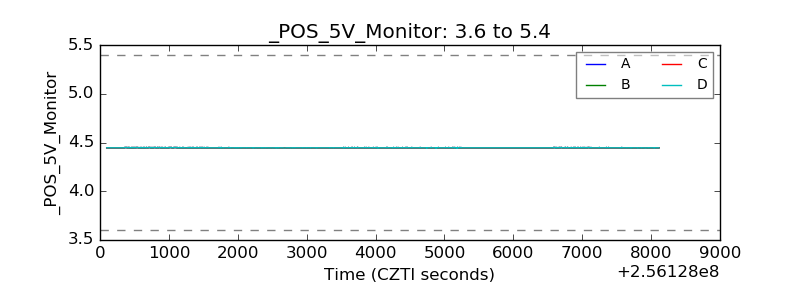 |
| _ROLL_ROT | 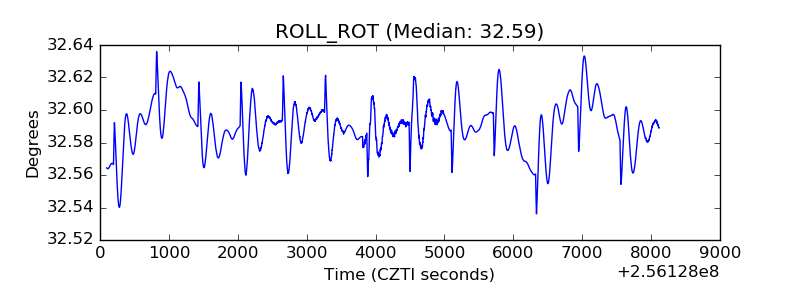 |
| _Roll_DEC | 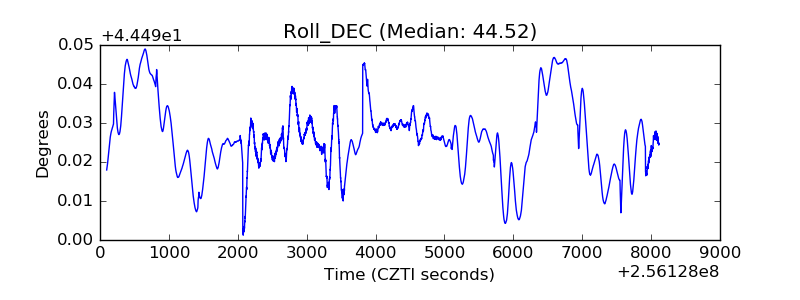 |
| _Roll_RA | 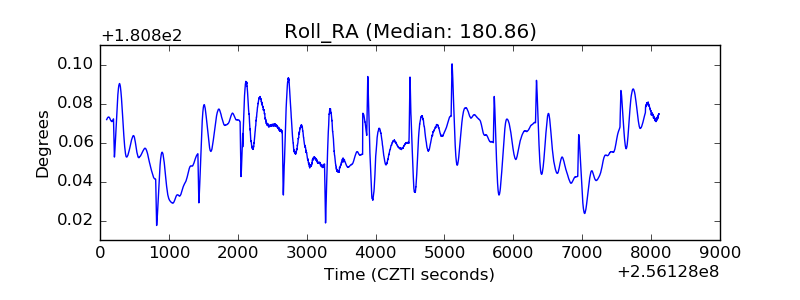 |
| Veto Counter | 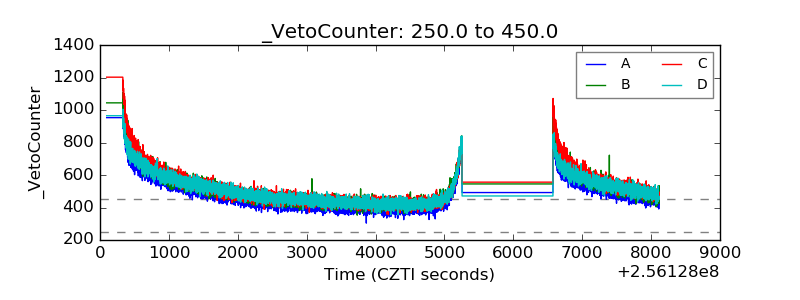 |